Stock Portfolio Organizer
The ultimate porfolio management solution.
Shares, Margin, CFD's, Futures and Forex
EOD and Realtime
Dividends and Trust Distributions
And Much More ....
WiseTrader Toolbox
#1 Selling Amibroker Plugin featuring:
Advanced Adaptive Indicators
Advanced Pattern Exploration
Neural Networks
And Much More ....
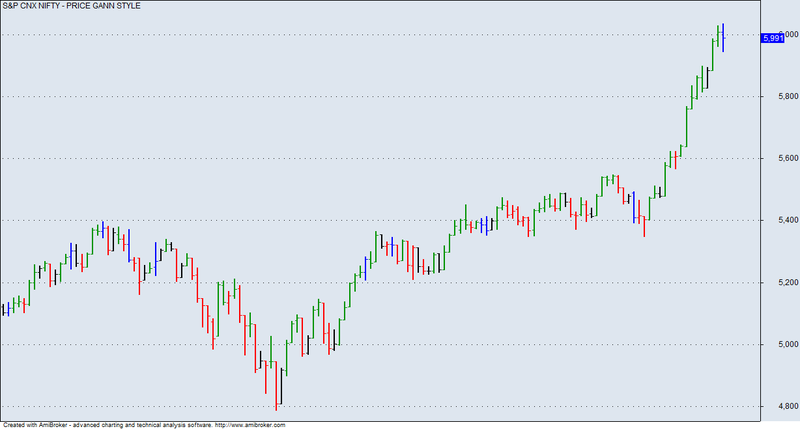
PRICE GANN STYLE for Amibroker (AFL)
Rating:
3 / 5 (Votes 2)
Tags:
amibroker, gann
The structure of this code was taken from a post made in amibroker yahoo group, i don’t remember the post-no, or the author name. This was further modified with some code by Tj.
SAHASRA
Screenshots
Similar Indicators / Formulas
GANN Levels with TGT & SL
Submitted
by niladri about 12 years ago
Gann level Plotter
Submitted
by anandsolanke about 10 years ago
Gann Trend Chart 1
Submitted
by walid over 13 years ago
SUPERcam
Submitted
by jaipal7786 about 10 years ago
Fibonacci And Gann Projections
Submitted
by ankit dargan about 14 years ago
GANN TREND (tiger)
Submitted
by tigernifty about 12 years ago
Indicator / Formula
Copy & Paste Friendly
ChartLum 		= Param("Chart Background Color Intensity", 0, 0, 1, 0.01);
SetChartBkColor(ColorBlend(colorWHITE, colorLIGHTBLUE, ChartLum));


_SECTION_BEGIN(" PRICE GANN STYLE");

 C1 = H > Ref(H,-1) AND L < Ref(L,-1) ;
 C2 = H < Ref(H,-1) AND L > Ref(L,-1) ;
 C3 = H > Ref(H,-1) AND L > Ref(L,-1) ;
 C4 = L < Ref(L,-1) AND H < Ref(H,-1) ;
 C5 = L == Ref(L,-1) OR H == Ref(H,-1) ;

 /* plot color coded bars */
 Plot( C, FullName(), IIf(C1 ,29,IIf(C2,1,IIf(C3 ,27,IIf(C4,32,IIf
 (C5 ,41,8))))),128+4 );

 x=Cum(1);

 /* criteria for high and low pivot */
 HP = IIf( H < Ref(H,-1) AND Ref(H ,-1) > Ref(H ,-2) AND Ref(H ,-1) >
 Ref(H ,-3), 1, 0);
 LP = IIf( L > Ref(L ,-1) AND Ref(L ,-1) < Ref(L ,-2) AND Ref(L ,-1)
 < Ref(L ,-3), 1, 0);


 /* find the end and start values and the end and start bar */
 startvalue=IIf(BarsSince(HP) < BarsSince(LP), ValueWhen(LP,Ref(L,-
 1),1), ValueWhen(HP,Ref(H,-1),1));


 startbar = IIf(BarsSince(HP) < BarsSince(LP), LastValue( ValueWhen(
 LP, x-1, 2 )) ,LastValue( ValueWhen( HP, x-1, 2 )));

 endbar = IIf(BarsSince(HP) < BarsSince(LP), LastValue( ValueWhen( HP,
 x-1, 1 )),LastValue( ValueWhen( LP, x-1, 1 )));

 b = startvalue;

_SECTION_END();

//outsidebar =  colour blue
//insidebar =  colour black
//upbar =  colour green
//downbar = colour red
//neutralbar = colour yellow
2 comments
Leave Comment
Please login here to leave a comment.
Back
Comment hidden - Show
outsidebar
insidebar
upbar
downbar
neutralbar
Good indicator