Stock Portfolio Organizer
The ultimate porfolio management solution.
Shares, Margin, CFD's, Futures and Forex
EOD and Realtime
Dividends and Trust Distributions
And Much More ....
WiseTrader Toolbox
#1 Selling Amibroker Plugin featuring:
Advanced Adaptive Indicators
Advanced Pattern Exploration
Neural Networks
And Much More ....
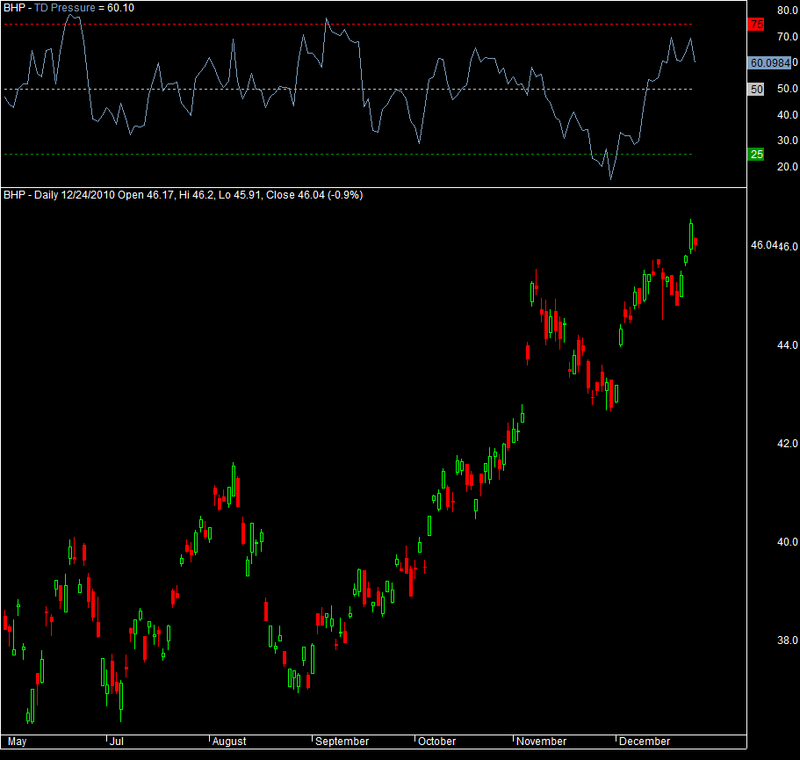
TD Pressure Ratio for Amibroker (AFL)
Rating:
4 / 5 (Votes 2)
Tags:
oscillator, amibroker
Numerator is the sum of all the accumulation (days the close was above the open) over a certain number of days,
multiplied by the volume – that is the “Buying Pressure”.
Note: “Selling Pressure” is the sum of all of the distribution over the same number of days, multiplied by the
volume. Denominator is the absolute value of the sum of the Buying Pressure and Selling Pressure.
The ratio gives you a measure of the Buying Pressure as a percentage of the total activity. This ratio
(oscillator) should fluctuate from 0 to 100.
Screenshots
Similar Indicators / Formulas
3 Days Track
Submitted
by janet0211 almost 14 years ago
Trading Volume Statistic
Submitted
by tuanstock1 almost 10 years ago
Ergodic Oscillator
Submitted
by dljtrader over 13 years ago
BoH Risk Aversion Indicator
Submitted
by genkumag over 12 years ago
Chande Momentum Oscillator
Submitted
by klimpek over 13 years ago
Indicator / Formula
Copy & Paste Friendly
_SECTION_BEGIN("TD Pressure Ratio");
SetChartBkColor(16);
Periods = Param("Periods",13,1,50,1);
function TDPressure (Periods)
{
for( i = 2; i < BarCount; i++ )

{
if((O[i] - C[i-1]) / C[i-1] > 0.15) // gapup
{
BP[i] = (H[i] - C[i-1] + C[i] - L[i]) * V[i];
}
else if((C[i-1]-O[i]) / O[i] > 0.15)// gapdown
{
SP[i] = (C[i-1] - L[i] + H[i] - C[i]) * V[i];
}
else
{
BP[i] = IIf(C[i] > O[i], C[i] - O[i],0) * V[i];
SP[i] = IIf(C[i] < O[i], C[i] - O[i],0) * V[i];
}
}
Result = 100 *Sum(BP,Periods)/ (Sum(BP,Periods) -
Sum(SP,Periods));
Result = IIf(Result < 0,0,Result);
Result = IIf(Result > 100,100,Result);
return Result;
}

TDP = TDPressure(Periods);
Plot(TDP ,"TD Pressure",colorLightBlue,1);
Plot( 25 , "", colorGreen,styleDashed);
Plot( 50 , "", colorLightGrey,styleDashed);
Plot( 75 , "", colorRed,styleDashed);
_SECTION_END();
0 comments
Leave Comment
Please login here to leave a comment.
Back