Stock Portfolio Organizer
The ultimate porfolio management solution.
Shares, Margin, CFD's, Futures and Forex
EOD and Realtime
Dividends and Trust Distributions
And Much More ....
WiseTrader Toolbox
#1 Selling Amibroker Plugin featuring:
Advanced Adaptive Indicators
Advanced Pattern Exploration
Neural Networks
And Much More ....
all in one for Amibroker (AFL)
Rating:
4 / 5 (Votes 11)
Tags:
amibroker, all in one
A awesom indicator created so i thought to share it plus this formula gives all n every desired combinations u need to evavulate market in just one afl
has got max 15 different charts layout with unlinited combinations in it
see it urself!!!!!!!!!!!1
Screenshots
Similar Indicators / Formulas
Kavach Of Karna v2
Submitted
by hbkwarez almost 10 years ago
Advanced Elliott Waves
Submitted
by MarcosEn over 12 years ago
3_6Day GuaiLiLv
Submitted
by motorfly over 12 years ago
Williams Alligator System
Submitted
by durgesh1712 over 12 years ago
Interactive Linear Regression Channel
Submitted
by InternetWorm over 12 years ago
*Level Breakout system*
Submitted
by Tinych over 12 years ago
Indicator / Formula
Copy & Paste Friendly
_SECTION_BEGIN( "Chart Settings" );
SetChartOptions( 0, chartShowArrows | chartShowDates );
SetChartBkColor( ParamColor( "Outer Panel", colorPaleBlue ) );
SetChartBkGradientFill( ParamColor( "Upper Chart", 1 ), ParamColor( "Lower Chart", 23 ) );
_SECTION_END();
_SECTION_BEGIN( "Pilihan Charts" );
TSFC = ParamToggle( "TSFC", "Hide|Show", 0 );
TREND = ParamToggle( "TREND", "Hide|Show", 0 );
CHART = ParamToggle( "CHART", "Hide|Show", 0 );
SR = ParamToggle( "SR" , "Hide|Show", 0 );
SILVER = ParamToggle( "SILVER", "Hide|Show", 0 );
NICK_MA = ParamToggle( "NICK_MA", "Hide|Show", 0 );
ZIGZAG = ParamToggle( "ZIGZAG", "Hide|Show", 0 );
STREND = ParamToggle( "SUPER TREND", "Hide|Show", 0 );
TSR = ParamToggle( "TSR", "Hide|Show", 0 );
BOLLINGER = ParamToggle( "BOLLINGER", "Show|Hide", 1 );
CHALOKE = ParamToggle( "CHALOKE", "Hide|Show", 0 );
INTRA_TREND = ParamToggle( "INTRA_TREND", "Hide|Show", 0 );
EKEKO = ParamToggle( "EKEKO", "Hide|Show", 0 );
CANDLE_PIVOT_TRENDLINES = ParamToggle( "CANDLE_PIVOT_TRENDLINES", "Hide|Show", 0 );
ISFANDI = ParamToggle( "ISFANDI", "Hide|Show", 0 );
PEAK_VALLEY = ParamToggle( "PEAK_VALLEY", "Hide|Show", 0 );
AUTO_FIBO = ParamToggle( "AUTO_FIBO", "Hide|Show", 0 );
NEED = ParamToggle( "NEED", "Hide|Show", 0 );
FLOWER = ParamToggle( "FLOWER", "Hide|Show", 0 );
_SECTION_END();
if ( CHART == 1 )
{
_SECTION_BEGIN( "CHART" );
Plot( C, "", colorWhite, styleCandle | styleThick );
_SECTION_END();
}
if ( TSFC == 1 )
{
_SECTION_BEGIN( "TSFC" );
JSB_InitLib();
Phase = Param( "Phase", 1, 1, 200, 1, 0 );
T1 = Param( "T", 3, 1, 200, 1, 0 );
Y = C;
Displacement = Param( "Displacement", 1, -50, 50 );
TSFC = LinRegSlope( Y, T1 ) + ( ( T1 * Sum( Cum( 1 ) * Y, T1 ) - Sum( Cum( 1 ), T1 ) * Sum( Y, T1 ) ) / ( T1 * Sum( ( Cum( 1 ) ^ 2 ), T1 ) -
( Sum( Cum( 1 ), T1 ) ^ 2 ) ) * Cum( 1 ) + ( MA( Y, T1 ) - MA( Cum( 1 ), T1 ) * ( T1 * Sum( Cum( 1 ) * Y, T1 ) -
Sum( Cum( 1 ), T1 ) * Sum( Y, T1 ) ) / ( T1 * Sum( ( Cum( 1 ) ^ 2 ), T1 ) - ( Sum( Cum( 1 ), T1 ) ^ 2 ) ) ) );
AA = JSB_JMA( TSFC, T1, Phase );
Plot( C, "", colorWhite, styleCandle | styleThick );
Plot( AA, "", colorYellow, styleLine | styleThick | styleDots, 0, 0, Displacement );
_SECTION_END();
}
if ( SR == 1 )
{
_SECTION_BEGIN( "SR " );
//sbrAll
SetBarsRequired( 100, 0 );
xx = Cum( 1 );
nbar = Param( "nbar", 5, 2, 50, 1 );
PHigh = H > Ref( HHV( H, nbar ), -1 ) AND Ref( HHV( H, nbar ), nbar ) <= H;
PHighPrice = ValueWhen( PHigh, H );
PLow = L < Ref( LLV( L, nbar ), -1 ) AND Ref( LLV( L, nbar ), nbar ) >= L;
PLowPrice = ValueWhen( PLow, L );
startval_L = ValueWhen( PLow, L, 1 );
endval_L = ValueWhen( PLow, L, 0 );
startbar_L = ValueWhen( PLow, xx, 1 );
endbar_L = ValueWhen( PLow, xx, 0 );
aa_L = ( endval_L - startval_L ) / ( endbar_L - startbar_L );
bb_L = startval_L;
trendline_L = aa_L * ( xx - startbar_L ) + bb_L;
dtrendline_L = trendline_L - Ref( trendline_L, -1 );
startval_L_extend = ValueWhen( PLow, L, 2 );
endval_L_extend = ValueWhen( PLow, L, 1 );
startbar_L_extend = ValueWhen( PLow, xx, 2 );
endbar_L_extend = ValueWhen( PLow, xx, 1 );
aa_L_extend = ( endval_L_extend - startval_L_extend ) / ( endbar_L_extend - startbar_L_extend );
bb_L_extend = startval_L;
trendline_L_extend = aa_L_extend * ( xx - startbar_L ) + endval_L_extend;
dtrendline_L_extend = trendline_L_extend - Ref( trendline_L_extend, -1 );
dtrendline_L_extend = IIf( PLow, Ref( dtrendline_L, -1 ), dtrendline_L_extend );
startval_L_extend2 = ValueWhen( PLow, L, 3 );
endval_L_extend2 = ValueWhen( PLow, L, 2 );
startbar_L_extend2 = ValueWhen( PLow, xx, 3 );
endbar_L_extend2 = ValueWhen( PLow, xx, 2 );
aa_L_extend2 = ( endval_L_extend2 - startval_L_extend2 ) / ( endbar_L_extend2 - startbar_L_extend2 );
bb_L_extend2 = endval_L_extend2;
trendline_L_extend2 = aa_L_extend2 * ( xx - endbar_L_extend2 ) + endval_L_extend2;
dtrendline_L_extend2 = trendline_L_extend2 - Ref( trendline_L_extend2, -1 );
dtrendline_L_extend2 = IIf( PLow, Ref( dtrendline_L_extend, -1 ), dtrendline_L_extend2 );
startval_H = ValueWhen( PHigh, H, 1 );
endval_H = ValueWhen( PHigh, H, 0 );
startbar_H = ValueWhen( PHigh, xx, 1 );
endbar_H = ValueWhen( PHigh, xx, 0 );
aa_H = ( endval_H - startval_H ) / ( endbar_H - startbar_H );
bb_H = startval_H;
trendline_H = aa_H * ( xx - startbar_H ) + bb_H;
dtrendline_H = trendline_H - Ref( trendline_H, -1 );
startval_H_extend = ValueWhen( PHigh, H, 2 );
endval_H_extend = ValueWhen( PHigh, H, 1 );
startbar_H_extend = ValueWhen( PHigh, xx, 2 );
endbar_H_extend = ValueWhen( PHigh, xx, 1 );
aa_H_extend = ( endval_H_extend - startval_H_extend ) / ( endbar_H_extend - startbar_H_extend );
bb_H_extend = startval_H;
trendline_H_extend = aa_H_extend * ( xx - startbar_H ) + endval_H_extend;
dtrendline_H_extend = trendline_H_extend - Ref( trendline_H_extend, -1 );
dtrendline_H_extend = IIf( PHigh, Ref( dtrendline_H, -1 ), dtrendline_H_extend );
startval_H_extend2 = ValueWhen( PHigh, H, 3 );
endval_H_extend2 = ValueWhen( PHigh, H, 2 );
startbar_H_extend2 = ValueWhen( PHigh, xx, 3 );
endbar_H_extend2 = ValueWhen( PHigh, xx, 2 );
aa_H_extend2 = ( endval_H_extend2 - startval_H_extend2 ) / ( endbar_H_extend2 - startbar_H_extend2 );
bb_H_extend2 = endval_H_extend2;
trendline_H_extend2 = aa_H_extend2 * ( xx - endbar_H_extend2 ) + endval_H_extend2;
dtrendline_H_extend2 = trendline_H_extend2 - Ref( trendline_H_extend2, -1 );
dtrendline_H_extend2 = IIf( PHigh, Ref( dtrendline_H_extend, -1 ), dtrendline_H_extend2 );
tld = ParamToggle( "All trendlines", "Show|Hide", 1 );
if ( tld )
{
trendline_L = IIf( dtrendline_L > 0, trendline_L, Null );
trendline_L_extend = IIf( dtrendline_L_extend > 0, trendline_L_extend, Null );
trendline_L_extend2 = IIf( dtrendline_L_extend2 > 0, trendline_L_extend2, Null );
trendline_H = IIf( dtrendline_H < 0, trendline_H, Null );
trendline_H_extend = IIf( dtrendline_H_extend < 0, trendline_H_extend, Null );
trendline_H_extend2 = IIf( dtrendline_H_extend2 < 0, trendline_H_extend2, Null );
}
trendline_L_extend2 = IIf( BarsSince( Plow ) <= nbar, trendline_L_extend2, Null );
trendline_H_extend2 = IIf( BarsSince( PHigh ) <= nbar, trendline_H_extend2, Null );
GraphXSpace = 5;
SetChartOptions( 0, chartShowDates );
chartflag = ParamToggle( "Heikin Ashi", "show|hide", 1 );
if ( chartFlag )
{
Plot( C, "", colorWhite, styleBar );
}
else
{
HaClose = ( O + H + L + C ) / 4;
HaOpen = AMA( Ref( HaClose, -1 ), 0.5 );
HaHigh = Max( H, Max( HaClose, HaOpen ) );
HaLow = Min( L, Min( HaClose, HaOpen ) );
PlotOHLC( HaOpen, HaHigh, HaLow, HaClose, "Modified " + Name(), colorWhite, styleBar );
}
PlotShapes( shapeHollowStar*PLow, colorYellow, 0, L, -10 );
PlotShapes( shapeHollowStar*PHigh, colorRed, 0, H, 10 );
Plot( trendline_L, "", colorBrightGreen, styleLine );
Plot( IIf( BarsSince( Plow ) <= nbar, trendline_L_extend, Null ), "", colorLightGrey, styleNoLine | styleDots | styleThick );
Plot( IIf( BarsSince( Plow ) > nbar, trendline_L_extend, Null ), "", colorBrightGreen, styleNoLine | styleDots | styleThick );
Plot( IIf( BarsSince( Plow ) <= nbar, trendline_L_extend2, Null ), "", colorDarkGreen, styleNoLine | styleDots | styleThick );
Plot( trendline_H, "", colorRed, styleLine );
Plot( IIf( BarsSince( PHigh ) <= nbar, trendline_H_extend, Null ), "", colorLightGrey, styleNoLine | styleDots | styleThick );
Plot( IIf( BarsSince( PHigh ) > nbar, trendline_H_extend, Null ), "", colorOrange, styleNoLine | styleDots | styleThick );
Plot( IIf( BarsSince( PHigh ) <= nbar, trendline_H_extend2, Null ), "", colorOrange, styleNoLine | styleDots | styleThick );
signalFlag = ParamToggle( "Possible Signals", "show|hide", 1 );
if ( signalFlag )
{
Buy = ( !IsEmpty( trendline_H_extend ) AND Cross( C, trendline_H_extend ) AND BarsSince( PHigh ) > nbar ) OR
( !IsEmpty( trendline_H_extend2 ) AND Cross( C, trendline_H_extend2 ) AND !PHigh ) OR
( PHigh AND C > trendline_H_extend2 AND Ref( C, -1 ) < Ref( trendline_H_extend, -1 ) AND !IsEmpty( trendline_H_extend ) AND !IsEmpty( trendline_H_extend2 ) );
BuyPrice = C;
Short = ( !IsEmpty( trendline_L_extend ) AND Cross( trendline_L_extend, C ) AND BarsSince( PLow ) > nbar ) OR
( !IsEmpty( trendline_L_extend2 ) AND Cross( trendline_L_extend2, C ) AND !PLow ) OR
( PLow AND C < trendline_L_extend2 AND Ref( C, -1 ) > Ref( trendline_L_extend, -1 ) AND !IsEmpty( trendline_L_extend ) AND !IsEmpty( trendline_L_extend2 ) );
ShortPrice = C;
Sell = 0;
Cover = 0;
}
_SECTION_END();
}
if ( SILVER == 1 )
{
CHART == 0;
_SECTION_BEGIN( "SILVER" );
Col_1 = IIf( EMA( RSI( 39 ), 30 ) > Ref( EMA( RSI( 39 ), 30 ), -1 ), colorGreen, colorOrange );
Plot( C, "", col_1, styleCandle + styleThick );
_SECTION_END();
_SECTION_BEGIN( "guppy" );
e3 = EMA( Close, 3 );
e5 = EMA( Close, 5 );
e8 = EMA( Close, 8 );
e10 = EMA( Close, 10 );
e12 = EMA( Close, 12 );
e15 = EMA( Close, 15 );
e30 = EMA( Close, 30 );
e35 = EMA( Close, 35 );
e40 = EMA( Close, 40 );
e45 = EMA( Close, 45 );
e50 = EMA( Close, 50 );
e55 = EMA( Close, 55 );
e60 = EMA( Close, 60 );
Buy_guppy = e3 > e60;
Sell_guppy = e60 > e3;
Buy_guppy = ExRem ( Buy_guppy, Sell_guppy );
Sell_guppy = ExRem( Sell_guppy, Buy_guppy );
PlotShapes( Buy_guppy*shapeHollowSmallUpTriangle, colorYellow );
PlotShapes( Sell_guppy*shapeHollowSmallDownTriangle , colorYellow );
Plot ( e3, "", colorBlue, styleThick );
Plot ( e5, "", colorBlue, styleThick );
Plot ( e8, "", colorBlue, styleThick );
Plot ( e10, "", colorBlue, styleNoLabel );
Plot ( e12, "", colorBlue, styleNoLabel );
Plot ( e15, "", colorBlue, styleNoLabel );
Plot ( e30, "", colorYellow, styleThick );
Plot ( e35, "", colorRed, styleNoLabel + styleThick );
Plot ( e40, "", colorRed, styleNoLabel + styleThick );
Plot ( e45, "", colorRed, styleNoLabel + styleThick );
Plot ( e50, "", colorRed, styleNoLabel + styleThick );
Plot ( e55, "", colorRed, styleNoLabel + styleThick );
Plot ( e60, "", colorRed, styleNoLabel + styleThick );
_SECTION_END();
_SECTION_BEGIN( "rsi de ema" );
Buy_rsi = EMA( RSI( 21 ), 3 ) > EMA( RSI( 21 ), 34 );
Sell_rsi = EMA( RSI( 21 ), 34 ) > EMA( RSI( 21 ), 3 );
Buy = Buy_rsi AND Buy_guppy;
Sell = sell_rsi AND sell_guppy;
Buy = ExRem( Buy, Sell );
Sell = ExRem( Sell, Buy );
_SECTION_END();
_SECTION_BEGIN( "Tops and bottom" );
pd = Param( "Periods", 13, 5, 144, 1 );
pds = 2 * pd - 1;
aa = Close - Ref( Close, -1 );
uu = EMA( Max( 0, aa ), pds );
dd = EMA( ( Max( 0, 0 - aa ) ), pds );
rf = IIf( C > 2, 1000, 10000 );
c1 = Param( "Upper Level", 70, 50, 90, 1 );
qq1 = 100 / ( 100 - c1 ) - 1;
ff1 = qq1 * dd - uu;
ff2 = ff1 / qq1;
f1 = Max( ff1, ff2 );
UL = Close + f1 * ( pds - 1 ) / 2;
UL = IIf( UL > C, floor( UL * rf ), ceil( UL * rf ) ) / rf;
c2 = Param( "Equilibrium", 50, 50, 50, 0 );
qq2 = 100 / ( 100 - c2 ) - 1;
ff = dd - uu;
MM = Close + ff * ( pds - 1 ) / 2;
MM = IIf( MM > C, floor( MM * rf ), ceil( MM * rf ) ) / rf;
c3 = Param( "Lower Level", 30, 10, 50, 1 );
qq3 = 100 / ( 100 - c3 ) - 1;
ff1 = qq3 * dd - uu;
ff2 = ff1 / qq3;
f3 = Min( ff1, ff2 );
LL = Close + f3 * ( pds - 1 ) / 2;
LL = IIf( LL > C, floor( LL * rf ), ceil( LL * rf ) ) / rf;
band = Param( "band width", 4, 0, 15, 0.25 );
mmu = MM + band;
mmd = MM - band;
X = Cross( C, LL );
Y = Cross( UL, C );
Buy1 = X ;
Sell1 = Y ;
PlotShapes( shapeCircle*Buy1, colorRed, 0, L, -15 );
PlotShapes( shapeCircle*Sell1, colorGreen, 0, H, -15 );
Filter = Buy1 OR Sell1 ;
AddTextColumn( FullName(), "Name" );
AddColumn( Buy1, "Buy" );
AddColumn( Sell1, "sell" );
dist = 1.5 * ATR( 10 );
for ( i = 0; i < BarCount; i++ )
{
if ( Buy_guppy[i] )
PlotText( "Buy @ \n" + C[i] , i, L[ i ] - dist[i], colorYellow, colorGreen );
if ( Sell_guppy[i] )
PlotText( "Sell@ \n" + C[i], i, H[ i ] + dist[i], colorYellow, colorRed );
if ( Sell1[i] )
PlotText( "Top" , i, H[ i ] + dist[i], colorGreen, colorYellow );
if ( Buy1[i] )
PlotText( "Bottom", i, L[ i ] - dist[i], colorRed, colorYellow );
}
PlotShapes( IIf( Buy, shapeSquare, shapeNone ), colorGreen, 0, L, Offset = -40 );
PlotShapes( IIf( Buy, shapeSquare, shapeNone ), colorLime, 0, L, Offset = -50 );
PlotShapes( IIf( Buy, shapeUpArrow, shapeNone ), colorWhite, 0, L, Offset = -45 );
PlotShapes( IIf( Sell, shapeSquare, shapeNone ), colorRed, 0, H, Offset = 40 );
PlotShapes( IIf( Sell, shapeSquare, shapeNone ), colorOrange, 0, H, Offset = 50 );
PlotShapes( IIf( Sell, shapeDownArrow, shapeNone ), colorWhite, 0, H, Offset = -45 );
_SECTION_END();
SellPrice = ValueWhen( Sell_guppy, C, 1 );
BuyPrice = ValueWhen( Buy_guppy, C, 1 );
Long = Flip( Buy_guppy, Sell_guppy );
Shrt = Flip( Sell_guppy, Buy_guppy );
_SECTION_BEGIN( "Pivot calc" );
TimeFrameSet( in15Minute*2 );
DH = Ref( H, -1 );
DL = Ref( L, -1 );
DC = Ref( C, -1 );
pd = ( DH + DL + DC ) / 3;
sd1 = ( 2 * pd ) - DH;
sd2 = pd - ( DH - DL );
sd3 = Sd1 - ( DH - DL );
rd1 = ( 2 * pd ) - DL;
rd2 = pd + ( DH - DL );
rd3 = rd1 + ( DH - DL );
TimeFrameRestore();
_SECTION_END();
Title =
EncodeColor( colorWhite ) + "Linkon's Silver" + " - " + Name() + " - " + EncodeColor( colorRed ) + Interval( 2 )
+ EncodeColor( colorWhite ) + " - " + Date() + " - "
+ "\n"
+ EncodeColor( colorYellow ) + "Op-" + O + " " + "Hi-" + H + " " + "Lo-" + L + " " + "Cl-" + C + " " + "Vol= " + WriteVal( V )
+ "\n"
+ WriteIf ( Sell_guppy , " EXIT LONG / Reverse Signal at " + C + "\n", "" )
+ WriteIf ( Buy_guppy , " EXIT SHORT / Reverse Signal at " + C + "\n", "" )
+ WriteIf( Sell_guppy , "Total Profit / Loss for the Last Trade Rs." + ( C - BuyPrice ) + "", "" ) +
WriteIf( Buy_guppy , "Total Profit / Loss for the Last trade Rs." + ( SellPrice - C ) + "", "" ) +
WriteIf( Long AND NOT Buy_guppy, EncodeColor( colorLime ) + "Trade : Long - Entry price Rs." + ( BuyPrice ) + " Tgt : " + UL, "" ) +
WriteIf( shrt AND NOT Sell_guppy, EncodeColor( colorRed ) + "Trade : Short - Entry price Rs." + ( SellPrice ) + " Tgt : " + LL, "" ) + "\n" +
WriteIf( Long AND NOT Buy_guppy, "Current Profit / Loss Rs." + ( C - BuyPrice ) + "", "" ) +
WriteIf( shrt AND NOT Sell_guppy, "Current Profit / Loss Rs." + ( SellPrice - C ) + "", "" )
+ EncodeColor( colorBrightGreen ) + "\n R3 : " + EncodeColor( colorWhite ) + RD3
+ EncodeColor( colorBrightGreen ) + "\n R2 : " + EncodeColor( colorWhite ) + RD2
+ EncodeColor( colorBrightGreen ) + "\n R1 : " + EncodeColor( colorWhite ) + RD1 + EncodeColor( colorBrightGreen ) + " UP TGT : " + EncodeColor( colorWhite ) + UL
+ EncodeColor( colorBlue ) + "\n Pivot : " + EncodeColor( colorWhite ) + pd + EncodeColor( colorBlue ) + " MIDPOINT : " + EncodeColor( colorWhite ) + MM
+ EncodeColor( colorRed ) + "\n S1 : " + EncodeColor( colorWhite ) + SD1 + EncodeColor( colorRed ) + " BOT TGT : " + EncodeColor( colorWhite ) + LL
+ EncodeColor( colorRed ) + "\n S2 : " + EncodeColor( colorWhite ) + SD2
+ EncodeColor( colorRed ) + "\n S3 : " + EncodeColor( colorWhite ) + SD3
;
_SECTION_BEGIN( "KPL" );
no = Param( "Swing", 2, 1, 55 );
tsl_col = ParamColor( "Color", colorCycle );
res = HHV( H, no );
sup = LLV( L, no );
avd = IIf( C > Ref( res, -1 ), 1, IIf( C < Ref( sup, -1 ), -1, 0 ) );
avn = ValueWhen( avd != 0, avd, 1 );
tsl = IIf( avn == 1, sup, res );
Plot( tsl, _DEFAULT_NAME(), tsl_col, styleStaircase );
Buy = Cross( C, tsl );
Sell = Cross( tsl, C );
shape = Buy * shapeUpArrow + Sell * shapeDownArrow;
PlotShapes( shape, IIf( Buy, tsl_col, tsl_col ), 0, IIf( Buy, Low, High ) );
_SECTION_END();
SetChartBkGradientFill( ParamColor( "Inner panel upper", colorYellow ), ParamColor( "Inner panel lower", colorYellow ) );
_SECTION_BEGIN( "Magnified Market Price" );
FS = Param( "Font Size", 28, 11, 100, 1 );
GfxSelectFont( "Arial", FS, 700, italic = False, underline = False, True );
GfxSetBkMode( colorWhite );
GfxSetTextColor( ParamColor( "Color", colorViolet ) );
Hor = Param( "Horizontal Position", 766, 1, 1200, 1 );
Ver = Param( "Vertical Position", 1, 1, 1, 1 );
GfxTextOut( "" + C, Hor , Ver );
YC = TimeFrameGetPrice( "C", inDaily, -1 );
DD = Prec( C - YC, 2 );
xx = Prec( ( DD / YC ) * 100, 2 );
GfxSelectFont( "Arial", 12, 700, italic = False, underline = False, True );
GfxSetBkMode( colorWhite );
GfxSetTextColor( ParamColor( "Color", colorViolet ) );
GfxTextOut( "" + DD + " (" + xx + "%)", Hor + 5, Ver + 45 );
_SECTION_END();
}
if ( TREND == 1 )
{
_SECTION_BEGIN( "TREND" );
Plot( C, "", colorWhite, styleCandle | styleThick );
P = ParamField( "Price field", -1 );
Daysback = Param( "Period for Liner Regression Line", 21, 1, 240, 1 );
shift = Param( "Look back period", 0, 0, 240, 1 );
x = Cum( 1 );
lastx = LastValue( x ) - shift;
aa = LastValue( Ref( LinRegIntercept( p, Daysback ), -shift ) );
bb = LastValue( Ref( LinRegSlope( p, Daysback ), -shift ) );
y = Aa + bb * ( x - ( Lastx - DaysBack + 1 ) );
LRColor = ParamColor( "LR Color", colorCycle );
LRStyle = ParamStyle( "LR Style" );
LRLine = IIf( x > ( lastx - Daysback ) AND BarIndex() < Lastx, y, Null );
Plot( LRLine , "LinReg", LRCOLOR, LRSTYLE );
SDP = Param( "Standard Deviation", 1.5, 0, 6, 0.1 );
SD = SDP / 2;
z = ( GetPerformanceCounter() / 100 ) % 256;
anim = ColorHSB( ( z ) % 256, 255, Param( "Brightness", 75, 0, 255, 1 ) );
RequestTimedRefresh( 1 );
width = LastValue( Ref( SD * StDev( p, Daysback ), -shift ) );
SDU = IIf( x > ( lastx - Daysback ) AND BarIndex() < Lastx, y + width , Null ) ;
SDL = IIf( x > ( lastx - Daysback ) AND BarIndex() < Lastx, y - width , Null ) ;
SDColor = ParamColor( "SD Color", colorCycle );
SDStyle = ParamStyle( "SD Style" );
Plot( SDU , "Upper Lin Reg", colorYellow, SDStyle );
Plot( SDL , "Lower Lin Reg", colorYellow, SDStyle );
PlotOHLC( O, SDU, SDL, C , _DEFAULT_NAME(), anim, styleCloud );
SDP2 = Param( "2d Standard Deviation", 2.0, 0, 6, 0.1 );
SD2 = SDP2 / 2;
width2 = LastValue( Ref( SD2 * StDev( p, Daysback ), -shift ) );
SDU2 = IIf( x > ( lastx - Daysback ) AND BarIndex() < Lastx, y + width2 , Null ) ;
SDL2 = IIf( x > ( lastx - Daysback ) AND BarIndex() < Lastx, y - width2 , Null ) ;
SDColor2 = ParamColor( "2 SD Color", colorCycle );
SDStyle2 = ParamStyle( "2 SD Style" );
Plot( SDU2 , "Upper Lin Reg", SDColor2, SDStyle2 );
Plot( SDL2 , "Lower Lin Reg", SDColor2, SDStyle2 );
_SECTION_END();
}
if ( NICK_MA == 1 )
{
_SECTION_BEGIN( "NICK_MA" );
SetBarsRequired( 200, 0 );
GraphXSpace = 5;
k = Optimize( "K", Param( "K", 1, 0.01, 5, 0.25 ), 0.01, 5, 0.25 ) ;
Per = Optimize( "atr", Param( "atr", 4, 3, 20, 1 ), 3, 20, 1 );
HACLOSE = ( O + H + L + C ) / 4;
HaOpen = AMA( Ref( HaClose, -1 ), 0.5 );
HaHigh = Max( H, Max( HaClose, HaOpen ) );
HaLow = Min( L, Min( HaClose, HaOpen ) );
j = Haclose;
f = ATR( 14 );
rfsctor = WMA( H - L, Per );
revers = k * rfsctor;
Trend = 1;
NW[0] = 0;
for ( i = 1; i < BarCount; i++ )
{
if ( Trend[i-1] == 1 )
{
if ( j[i] < NW[i-1] )
{
Trend[i] = -1;
NW[i] = j[i] + Revers[i];
}
else
{
Trend[i] = 1;
if ( ( j[i] - Revers[i] ) > NW[i-1] )
{
NW[i] = j[i] - Revers[i];
}
else
{
NW[i] = NW[i-1];
}
}
}
if ( Trend[i-1] == -1 )
{
if ( j[i] > NW[i-1] )
{
Trend[i] = 1;
NW[i] = j[i] - Revers[i];
}
else
{
Trend[i] = -1;
if ( ( j[i] + Revers[i] ) < NW[i-1] )
{
NW[i] = j[i] + Revers[i];
}
else
{
NW[i] = NW[i-1];
}
}
}
}
JSB_InitLib();
Length = Param( "Length ", 1, 1, 500, 1 );
Phase = Param( "Phase", 1, 1, 1000, 1 );
Color = IIf( Trend == 1, colorYellow, colorBrown );
JSB_NW = JSB_JMA( NW, Length, Phase );
Color_NW = IIf( C >= JSB_NW, colorWhite, colorRed );
PlotOHLC( HaOpen, HaHigh, HaLow, HaClose, "" + Name(), Color, styleBar | styleThick );
Color = IIf( Trend == 1, 27, 4 );
Plot( JSB_NW, "", Color_NW, styleLine | styleThick );
Buy = Cover = Cross( j, JSB_NW );
Sell = Short = Cross( JSB_NW, j );
SellPrice = ValueWhen( Sell, C, 1 );
BuyPrice = ValueWhen( Buy, C, 1 );
Long = Flip( Buy, Sell );
Shrt = Flip( Sell, Buy );
_SECTION_END();
acc = Param( "Acceleration", 0.02, 0, 1, 0.001 );
accm = Param( "Max. acceleration", 0.2, 0, 1, 0.001 );
Plot( SAR( acc, accm ), _DEFAULT_NAME(), ParamColor( "Color", colorYellow ), ParamStyle( "Style", styleDots | styleNoLine, maskDefault | styleDots | styleNoLine ) );
_SECTION_BEGIN( "Title" );
if ( Status( "action" ) == actionIndicator )
(
Title = EncodeColor( colorWhite ) + "NICK MA Swing System" + " - " + Name() + " - " + EncodeColor( colorRed ) + Interval( 2 ) + EncodeColor( colorWhite ) +
" - " + Date() + " - " + "\n" + EncodeColor( colorYellow ) + "Op-" + O + " " + "Hi-" + H + " " + "Lo-" + L + " " +
"Cl-" + C + " " + "Vol= " + WriteVal( V ) + "\n" +
EncodeColor( colorLime ) +
WriteIf ( Buy , " ALI?A GIDIYOR / SINYALLE TERS " + C + " ", "" ) + EncodeColor( colorRed ) +
WriteIf ( Sell , " SATI? S?NYAL? / SINYALLE TERS " + C + " ", "" ) + "\n" + EncodeColor( colorWhite ) +
WriteIf( Sell , "SON TRADEDE TOPLAM KAR/ZARAR" + ( C - BuyPrice ) + "", "" ) +
WriteIf( Buy , "SON TRADEDE TOPLAM KAR/ZARAR" + ( SellPrice - C ) + "", "" ) +
WriteIf( Long AND NOT Buy, "Trade : UZUN G?R?? F?YAT" + ( BuyPrice ), "" ) +
WriteIf( shrt AND NOT Sell, "Trade : KISA G?R?? F?YAT" + ( SellPrice ), "" ) + "\n" +
WriteIf( Long AND NOT Buy, "GEÇERL? KAR/ZARAR." + ( C - BuyPrice ) + "", "" ) +
WriteIf( shrt AND NOT Sell, "GEÇERL? KAR/ZARAR." + ( SellPrice - C ) + "", "" ) );
PlotShapes( IIf( Buy, shapeSquare, shapeNone ), colorGreen, 0, L, Offset = -40 );
PlotShapes( IIf( Buy, shapeSquare, shapeNone ), colorLime, 0, L, Offset = -50 );
PlotShapes( IIf( Buy, shapeUpArrow, shapeNone ), colorWhite, 0, L, Offset = -45 );
PlotShapes( IIf( Sell, shapeSquare, shapeNone ), colorRed, 0, H, Offset = 40 );
PlotShapes( IIf( Sell, shapeSquare, shapeNone ), colorOrange, 0, H, Offset = 50 );
PlotShapes( IIf( Sell, shapeDownArrow, shapeNone ), colorWhite, 0, H, Offset = -45 );
}
_SECTION_END();
if ( ZIGZAG == 1 )
{
_SECTION_BEGIN( "ZIGZAG" );
zz0 = Zig( Close, 7 );
zz1 = Ref( zz0, -1 );
zz2 = Ref( zz0, -2 );
tr = ValueWhen( zz0 > zz1 AND zz1 < zz2, zz1 );
pk = ValueWhen( zz0 < zz1 AND zz1 > zz2, zz1 );
PU = tr + abs( tr ) * 0.05;
PD = pk - abs( pk ) * 0.05;
res = IIf( Close >= PU AND zz0 > zz1, 1,
IIf( Close <= PD AND zz0 < zz1, -1, 0 ) );
res = ValueWhen( res != 0, res );
Buy = res == 1 AND Ref( res, -1 ) == -1;
Sell = res == -1 AND Ref( res, -1 ) == 1;
Short = Sell;
Cover = Buy;
Plot( zz0, "ZigZag", colorYellow, styleThick );
Plot( Close, "Price", colorBrightGreen, styleCandle | styleThick );
PlotShapes( Buy * shapeUpArrow, colorGreen );
PlotShapes( Sell * shapeDownArrow, colorRed );
Plot( Flip( Buy, Sell ), "Trade", 12, styleArea | styleOwnScale, 0, 1 );
_SECTION_END();
}
if ( STREND == 1 )
{
_SECTION_BEGIN( "STREND" );
ZAMAN = Param( "ZAMAN", 20, 1, 2000, 1 );
mtOpen = LinearReg( Open, ZAMAN ); // calculate moving trend from open
mtHigh = LinearReg( High, ZAMAN ); // calculate moving trend from open
mtLow = LinearReg( Low, ZAMAN ); // calculate moving trend from open
mtClose = LinearReg( Close, ZAMAN ); // calculate moving trend from open
// plot surrogate chart
PlotOHLC( mtOpen, mtHigh, mtLow, mtClose, "Surrogate", colorWhite, styleCandle );
_SECTION_END();
_SECTION_BEGIN( "DESTEK D?RENÇ " );
SetBarsRequired( sbrAll, sbrAll );
xx = Cum( 1 );
nbar = Param( "nbar", 5, 2, 50, 1 );
PHigh = mtHigh > Ref( HHV( mtHigh, nbar ), -1 ) AND Ref( HHV( mtHigh, nbar ), nbar ) <= mtHigh;
PHighPrice = ValueWhen( PHigh, mtHigh );
PLow = mtLow < Ref( LLV( mtLow, nbar ), -1 ) AND Ref( LLV( mtLow, nbar ), nbar ) >= mtLow;
PLowPrice = ValueWhen( PLow, mtLow );
startval_L = ValueWhen( PLow, mtLow, 1 );
endval_L = ValueWhen( PLow, mtLow, 0 );
startbar_L = ValueWhen( PLow, xx, 1 );
endbar_L = ValueWhen( PLow, xx, 0 );
aa_L = ( endval_L - startval_L ) / ( endbar_L - startbar_L );
bb_L = startval_L;
trendline_L = aa_L * ( xx - startbar_L ) + bb_L;
dtrendline_L = trendline_L - Ref( trendline_L, -1 );
startval_L_extend = ValueWhen( PLow, mtLow, 2 );
endval_L_extend = ValueWhen( PLow, mtLow, 1 );
startbar_L_extend = ValueWhen( PLow, xx, 2 );
endbar_L_extend = ValueWhen( PLow, xx, 1 );
aa_L_extend = ( endval_L_extend - startval_L_extend ) / ( endbar_L_extend - startbar_L_extend );
bb_L_extend = startval_L;
trendline_L_extend = aa_L_extend * ( xx - startbar_L ) + endval_L_extend;
dtrendline_L_extend = trendline_L_extend - Ref( trendline_L_extend, -1 );
dtrendline_L_extend = IIf( PLow, Ref( dtrendline_L, -1 ), dtrendline_L_extend );
startval_L_extend2 = ValueWhen( PLow, mtLow, 3 );
endval_L_extend2 = ValueWhen( PLow, mtLow, 2 );
startbar_L_extend2 = ValueWhen( PLow, xx, 3 );
endbar_L_extend2 = ValueWhen( PLow, xx, 2 );
aa_L_extend2 = ( endval_L_extend2 - startval_L_extend2 ) / ( endbar_L_extend2 - startbar_L_extend2 );
bb_L_extend2 = endval_L_extend2;
trendline_L_extend2 = aa_L_extend2 * ( xx - endbar_L_extend2 ) + endval_L_extend2;
dtrendline_L_extend2 = trendline_L_extend2 - Ref( trendline_L_extend2, -1 );
dtrendline_L_extend2 = IIf( PLow, Ref( dtrendline_L_extend, -1 ), dtrendline_L_extend2 );
startval_H = ValueWhen( PHigh, mtHigh, 1 );
endval_H = ValueWhen( PHigh, mtHigh, 0 );
startbar_H = ValueWhen( PHigh, xx, 1 );
endbar_H = ValueWhen( PHigh, xx, 0 );
aa_H = ( endval_H - startval_H ) / ( endbar_H - startbar_H );
bb_H = startval_H;
trendline_H = aa_H * ( xx - startbar_H ) + bb_H;
dtrendline_H = trendline_H - Ref( trendline_H, -1 );
startval_H_extend = ValueWhen( PHigh, mtHigh, 2 );
endval_H_extend = ValueWhen( PHigh, mtHigh, 1 );
startbar_H_extend = ValueWhen( PHigh, xx, 2 );
endbar_H_extend = ValueWhen( PHigh, xx, 1 );
aa_H_extend = ( endval_H_extend - startval_H_extend ) / ( endbar_H_extend - startbar_H_extend );
bb_H_extend = startval_H;
trendline_H_extend = aa_H_extend * ( xx - startbar_H ) + endval_H_extend;
dtrendline_H_extend = trendline_H_extend - Ref( trendline_H_extend, -1 );
dtrendline_H_extend = IIf( PHigh, Ref( dtrendline_H, -1 ), dtrendline_H_extend );
startval_H_extend2 = ValueWhen( PHigh, mtHigh, 3 );
endval_H_extend2 = ValueWhen( PHigh, mtHigh, 2 );
startbar_H_extend2 = ValueWhen( PHigh, xx, 3 );
endbar_H_extend2 = ValueWhen( PHigh, xx, 2 );
aa_H_extend2 = ( endval_H_extend2 - startval_H_extend2 ) / ( endbar_H_extend2 - startbar_H_extend2 );
bb_H_extend2 = endval_H_extend2;
trendline_H_extend2 = aa_H_extend2 * ( xx - endbar_H_extend2 ) + endval_H_extend2;
dtrendline_H_extend2 = trendline_H_extend2 - Ref( trendline_H_extend2, -1 );
dtrendline_H_extend2 = IIf( PHigh, Ref( dtrendline_H_extend, -1 ), dtrendline_H_extend2 );
tld = ParamToggle( "All trendlines", "Show|Hide", 1 );
if ( tld )
{
trendline_L = IIf( dtrendline_L > 0, trendline_L, Null );
trendline_L_extend = IIf( dtrendline_L_extend > 0, trendline_L_extend, Null );
trendline_L_extend2 = IIf( dtrendline_L_extend2 > 0, trendline_L_extend2, Null );
trendline_H = IIf( dtrendline_H < 0, trendline_H, Null );
trendline_H_extend = IIf( dtrendline_H_extend < 0, trendline_H_extend, Null );
trendline_H_extend2 = IIf( dtrendline_H_extend2 < 0, trendline_H_extend2, Null );
}
trendline_L_extend2 = IIf( BarsSince( Plow ) <= nbar, trendline_L_extend2, Null );
trendline_H_extend2 = IIf( BarsSince( PHigh ) <= nbar, trendline_H_extend2, Null );
GraphXSpace = 5;
SetChartOptions( 0, chartShowDates );
chartflag = ParamToggle( "Heikin Ashi", "show|hide", 1 );
if ( chartFlag )
{
}
else
{
HaClose = ( O + H + L + C ) / 4;
HaOpen = AMA( Ref( HaClose, -1 ), 0.5 );
HaHigh = Max( mtHigh, Max( HaClose, HaOpen ) );
HaLow = Min( mtLow, Min( HaClose, HaOpen ) );
PlotOHLC( HaOpen, HaHigh, HaLow, HaClose, "Modified " + Name(), colorWhite, styleBar );
}
PlotShapes( shapeHollowStar*PLow, colorYellow, 0, mtLow, -10 );
PlotShapes( shapeHollowStar*PHigh, colorRed, 0, mtHigh , 10 );
Plot( trendline_L, "", colorBrightGreen, styleLine );
Plot( IIf( BarsSince( Plow ) <= nbar, trendline_L_extend, Null ), "", colorLightGrey, styleNoLine | styleDots | styleThick );
Plot( IIf( BarsSince( Plow ) > nbar, trendline_L_extend, Null ), "", colorBrightGreen, styleNoLine | styleDots | styleThick );
Plot( IIf( BarsSince( Plow ) <= nbar, trendline_L_extend2, Null ), "", colorDarkGreen, styleNoLine | styleDots | styleThick );
Plot( trendline_H, "", colorRed, styleLine );
Plot( IIf( BarsSince( PHigh ) <= nbar, trendline_H_extend, Null ), "", colorLightGrey, styleNoLine | styleDots | styleThick );
Plot( IIf( BarsSince( PHigh ) > nbar, trendline_H_extend, Null ), "", colorOrange, styleNoLine | styleDots | styleThick );
Plot( IIf( BarsSince( PHigh ) <= nbar, trendline_H_extend2, Null ), "", colorOrange, styleNoLine | styleDots | styleThick );
signalFlag = ParamToggle( "Possible Signals", "show|hide", 1 );
if ( signalFlag )
{
Buy = ( !IsEmpty( trendline_H_extend ) AND Cross( mtClose, trendline_H_extend ) AND BarsSince( PHigh ) > nbar ) OR
( !IsEmpty( trendline_H_extend2 ) AND Cross( mtClose, trendline_H_extend2 ) AND !PHigh ) OR
( PHigh AND mtClose > trendline_H_extend2 AND Ref( mtClose, -1 ) < Ref( trendline_H_extend, -1 ) AND !IsEmpty( trendline_H_extend ) AND !IsEmpty( trendline_H_extend2 ) );
BuyPrice = mtClose;
Short = ( !IsEmpty( trendline_L_extend ) AND Cross( trendline_L_extend, mtClose ) AND BarsSince( PLow ) > nbar ) OR
( !IsEmpty( trendline_L_extend2 ) AND Cross( trendline_L_extend2, C ) AND !PLow ) OR
( PLow AND mtClose < trendline_L_extend2 AND Ref( mtClose, -1 ) > Ref( trendline_L_extend, -1 ) AND !IsEmpty( trendline_L_extend ) AND !IsEmpty( trendline_L_extend2 ) );
ShortPrice = mtClose;
Sell = 0;
Cover = 0;
_SECTION_BEGIN( "VAP" );
PlotVAPOverlayA( Buy , Param( "Lines", 300, 100, 1000, 1 ), Param( "Width", 100, 1, 100, 1 ), ParamColor( "Color", colorGold ), ParamToggle( "Side", "Left|Right" ) | 2 * ParamToggle( "Style", "Fill|Lines", 0 ) | 4*ParamToggle( "Z-order", "On top|Behind", 1 ) );
Plot( plow, "", colorLime, styleHistogram | styleDashed | styleOwnScale );
Plot( phigh, "", colorRed, styleHistogram | styleDashed | styleOwnScale );
_SECTION_END();
_SECTION_BEGIN( " EXPLORE" );
AL = ( !IsEmpty( trendline_H_extend ) AND Cross( mtClose, trendline_H_extend ) AND BarsSince( PHigh ) > nbar ) OR
( !IsEmpty( trendline_H_extend2 ) AND Cross( mtClose, trendline_H_extend2 ) AND !PHigh ) OR
( PHigh AND mtClose > trendline_H_extend2 AND Ref( mtClose, -1 ) < Ref( trendline_H_extend, -1 ) AND !IsEmpty( trendline_H_extend ) AND !IsEmpty( trendline_H_extend2 ) );
BuyPrice = mtClose;
SAT = ( !IsEmpty( trendline_L_extend ) AND Cross( trendline_L_extend, mtClose ) AND BarsSince( PLow ) > nbar ) OR
( !IsEmpty( trendline_L_extend2 ) AND Cross( trendline_L_extend2, C ) AND !PLow ) OR
( PLow AND mtClose < trendline_L_extend2 AND Ref( mtClose, -1 ) > Ref( trendline_L_extend, -1 ) AND !IsEmpty( trendline_L_extend ) AND !IsEmpty( trendline_L_extend2 ) );
ShortPrice = mtClose;
AL_status = WriteIf( AL, "Al?? Yap", " " );
SAT_status = WriteIf( SAT, "Sat?? Yap", " " );
AL_col = IIf( AL, colorDarkGreen , colorWhite );
SAT_col = IIf( SAT, colorRed, colorWhite );
}
Filter = AL OR SAT;
AddColumn( C, "KAPANI?", 1.2, IIf( C > Ref( C, -1 ), colorBlue, colorRed ) );
AddTextColumn( AL_status, "ALI?", 1.2, colorWhite, Al_col );
AddTextColumn( SAT_status, "SATI?", 1.2, colorWhite, SAT_col );
_SECTION_END();
}
Kisa = Param( "KISA GÜN", 12, 1, 500, 1 );
Uzun = Param( "UZUN GÜN", 43, 1, 1000, 1 );
Tetik = Param( "TETIK GÜN", 21, 1, 50, 1 );
function KisaPeriodTopla( Kisa )
{
ka = Kisa;
for ( i = 1; i < Kisa; i++ )
{
ka = ka + i;
}
return ka;
}
function UzunPeriodTopla( Uzun )
{
au = Uzun;
for ( iu = 0; iu < Uzun; iu++ )
{
au = au + iu;
}
return au;
}
function TetikPeriodTopla( Tetik )
{
a = Tetik;
for ( i = 0; i < Tetik; i++ )
{
a = a + i;
}
return a;
}
function KisaGunTopla( Kisa )
{
a = Kisa;
kd = a * C;
for ( i = 0;i < Kisa;i++ )
{
b = Ref( C, -i );
if ( a > 0 )
a--;
kd = kd + ( a * b );
}
return kd;
}
function UzunGunTopla( Uzun )
{
au = Uzun;
ku = au * C;
for ( iu = 0;iu < Uzun;iu++ )
{
bu = Ref( C, -iu );
if ( au > 0 )
au--;
ku = ku + ( au * bu );
}
return ku;
}
Period12Toplam = KisaPeriodTopla( Kisa );
Day12Toplam = KisaGunTopla( Kisa );
LWMA12 = Day12Toplam / Period12Toplam;
Period43Toplam = UzunPeriodTopla( Uzun );
Day43Toplam = UzunGunTopla( Uzun );
LWMA43 = Day43Toplam / Period43Toplam;
function XDAY( Tetik )
{
X = ( ( 2 * LWMA12 ) - LWMA43 );
aX = Tetik;
kX = AX * X;
for ( iX = 0;iX < Tetik;iX++ )
{
bX = Ref( X, -iX );
if ( aX > 0 )
aX--;
kX = kX + ( aX * bX );
}
return kX;
}
if ( TSR == 1 )
{
XDayToplam = XDAY( Tetik );
XPeriodToplam = TetikPeriodTopla( Tetik );
TSR = ( XDayToplam / XPeriodToplam );
Plot( C, "Kapanis", colorGrey50, styleCandle );
tsrcolor = IIf( TSR > Ref( TSR, -1 ), colorLime, colorRed );
Plot( TSR, "TSR", tsrcolor, styleLine | styleThick );
_SECTION_END();
}
if ( BOLLINGER == 0 )
{
_SECTION_BEGIN( "BOLLINGER" );
DisplayBBColor = ParamToggle( "Display BB Color", "No,Yes", 1 );
BollPeriods = Param( "Periode", 20, 0, 200, 1 );
Width = Param( "Std. Dev.", 2, 0, 10, 0.05 );
ColorBB = ParamColor( "BB color", ColorRGB( 64, 0, 0 ) );
TOP = BBandTop( C, BollPeriods, Width );
BOTTOM = BBandBot( C, BollPeriods, Width );
ORT = ( TOP + BOTTOM ) / 2;
Plot( C, "", colorWhite, styleCandle | styleThick );
Plot( IIf( Bollinger, Null, BBandTop( C, BollPeriods, Width ) ), "BBTop" + _PARAM_VALUES(), ParamColor( "Color", colorDarkRed ), styleThick + styleNoLabel );
Plot( IIf( Bollinger, Null, BBandBot( C, BollPeriods, Width ) ), "BBBot" + _PARAM_VALUES(), ParamColor( "Color", colorDarkRed ), styleThick + styleNoLabel );
Plot( ORT, "", colorBrightGreen, styleThick + styleDots );
if ( Bollinger == 0 AND DisplayBBColor == 1 )
{
PlotOHLC( Null, BBandTop( C, BollPeriods, Width ), BBandBot( C, BollPeriods, Width ), Null, "", ColorBB, styleCloud + styleNoLabel );
}
_SECTION_END();
}
if ( CHALOKE == 1 )
{
_SECTION_BEGIN( "CHALOKE" );
Plot( C, "", colorWhite, styleCandle | styleThick );
GraphXSpace = 1;
P1 = Param( "ShortTerm Period", 9, 3, 15, 1 );
P2 = Param( "MidTerm Period", 15, 9, 24, 1 );
P3 = Param( "LongTerm Period", 24, 15, 50, 1 );
P4 = Param( "Invesment Term", 5, 1, 12, 1 );
P5 = Param( "ATR Period", 5, 1, 25, 1 );
Sm = 2 * P5 / 10;
ATRX = Sm * ATR( P4 );
S = EMA( C, P1 ) - ATRX;
M = EMA( C, P2 ) - ATRX;
lg = EMA( C, P3 ) - ATRX;
Sht = IIf( C == HHV( C, 3 ), S, Ref( EMA( C, 9 ), -1 ) - ATRX );
Mid = IIf( C == HHV( C, 3 ), M, Ref( EMA( C, 15 ), -1 ) - ATRX );
Lng = IIf( C == HHV( C, 3 ), Lg, Ref( EMA( C, 24 ), -1 ) - ATRX );
ColorSys3 = IIf( Sht > Mid AND C > Sht , colorBrightGreen , IIf( C < lng OR Sht < lng , colorRed,
IIf( BarsSince( Sht > Mid AND C > Sht ) < BarsSince( C < lng OR Sht < lng ) , colorBrightGreen , colorRed ) ) );
BuySys3 = ColorSys3 == colorBrightGreen AND Ref( ColorSys3, -1 ) != colorBrightGreen ;
SellSys3 = ColorSys3 == colorRed AND Ref( ColorSys3, -1 ) != colorRed ;
Tghlow = Trough( C, 1.5 );
PKHg = Peak( C, 1.5 );
Heading = "AUTO SEC Version 1.2";
SECUpColor = ParamColor( "SEC-UpColor", colorBrightGreen );
SECDnColor = ParamColor( "SEC-DownColor", colorRed );
SECLastColor = ParamColor( "SEC-LastColor", 10 );
BckGndColor = ParamColor( "BackGroundColor", colorYellow );
ZZSwitch = Param( "ZZSwitch", 0, 0, 1, 1 );
Sens = Param( "Sens", 5, 0.5, 15, 0.5 );
SECSwitch = Param( "SECSwitch", 1, 0, 1, 1 );
BarPK = BarsSince( Zig( C, Sens ) == Peak( C, Sens ) );
BarTGH = BarsSince( Zig( C, Sens ) == Trough( C, Sens ) );
Turnpoint = Min( BarPK, BarTGH );
x = Cum( 1 );
lastxL = LastValue( x );
DaysbackL = LastValue( Min( PeakBars( C, Sens, 1 ), TroughBars( C, Sens , 1 ) ) ) + 1;
Endbars = IIf( PeakBars( C, Sens, 1 ) < TroughBars( C, Sens, 1 ), LastValue( ValueWhen( C == LLV( C, DaysbackL ), X ) ), LastValue( ValueWhen( C == HHV( C, DaysbackL ), X ) ) );
BarsL = Min( PeakBars( C, Sens, 1 ), TroughBars( C, Sens, 1 ) ) ;
aaL = ValueWhen( Ref( Endbars, -1 ) != Ref( x, -1 ) AND Endbars == x , LinRegIntercept( Close, DaysbackL - ( LastValue( x ) - Endbars ) ) );
bbL = ValueWhen( Ref( Endbars, -1 ) != Ref( x, -1 ) AND Endbars == x , LinRegSlope( Close, DaysbackL - ( LastValue( x ) - Endbars ) ) );
eL = ValueWhen( Ref( Endbars, -1 ) != Ref( x, -1 ) AND Endbars == x , StdErr( C, DaysbackL - ( LastValue( x ) - Endbars ) ) );
SlopeL = LastValue( bbL );
LevelL = LastValue( aaL );
ErrL = LastValue( eL );
MbackL = LevelL + slopeL * ( BarsL ) ;
UbackL = MBackL + 2 * ErrL;
LbackL = MBackL - 2 * ErrL;
WL = ( UbackL - LbackL ) / sqrt( ( SlopeL * SlopeL ) + 1 );
AA = IIf( X > ( LastValue( x ) - DaysbackL ) AND MbackL != 0, MbackL, Null );
AA1 = IIf( X > ( LastValue( x ) - DaysbackL ) AND MbackL != 0, UbackL, Null );
AA2 = IIf( X > ( LastValue( x ) - DaysbackL ) AND MbackL != 0, LbackL, Null );
Plot( IIf( X > ( LastValue( x ) - DaysbackL ) AND MbackL != 0, MbackL, Null ) , "", SECLastColor, styleNoLabel );
Plot( IIf( X > ( LastValue( x ) - DaysbackL ) AND MbackL != 0, UbackL, Null ) , "", SECLastColor, styleNoLabel );
Plot( IIf( X > ( LastValue( x ) - DaysbackL ) AND MbackL != 0, LbackL, Null ) , "", SECLastColor, styleNoLabel );
PlotOHLC( AA1, AA2, AA1, AA2, "", 12, styleNoLabel | styleCloud, 0 );
_SECTION_END();
}
if ( INTRA_TREND == 1 )
{
_SECTION_BEGIN( "INTRA_TREND" );
SetChartOptions( 0, chartShowArrows | chartShowDates );
ScanLookBack = Param( "Scan Lookback", 2, 1, 25 );
fraction = IIf( StrRight( Name(), 3 ) == "", 3.2, 3.2 );
_SECTION_BEGIN( "Price" );
SetChartOptions( 0, chartShowArrows | chartShowDates );
_N( Title = StrFormat( "{{NAME}} - {{INTERVAL}} {{DATE}} Open %g, Hi %g, Lo %g, Close %g (%.1f%%) Vol " + WriteVal( V, 1.0 ) + " {{VALUES}}", O, H, L, C, SelectedValue( ROC( C, 1 ) ) ) );
Plot( C, _DEFAULT_NAME(), colorWhite , styleNoTitle | ParamStyle( "Style" ) | GetPriceStyle() );
_SECTION_END();
_SECTION_BEGIN( "Up Trend Line" );
UTValue1 = LastValue( Trough( L, 0.5, 2 ) );
UTValue2 = LastValue( Trough( L, 0.5, 1 ) );
UTBar1 = BarCount - 1 - LastValue( TroughBars( L, 0.5 , 2 ) );
UTBar2 = BarCount - 1 - LastValue( TroughBars( L, 0.5 , 1 ) );
UpTrendLine = LineArray( UTBar1, UTValue1, UTBar2, UTValue2, 1 );
UTLine = LineArray( UTBar1, UTValue1, UTBar2, UTValue2, 0 );
Plot( UpTrendLine , _DEFAULT_NAME(), colorGreen, styleLine | styleNoTitle | styleNoLabel );
Plot( UTLine , _DEFAULT_NAME(), colorGreen, styleLine | styleNoTitle | styleNoLabel );
_SECTION_END();
_SECTION_BEGIN( "Down Trend Line" );
DTValue1 = LastValue( Peak( H, 0.5 , 2 ) );
DTValue2 = LastValue( Peak( H, 0.5 , 1 ) );
DTBar1 = BarCount - 1 - LastValue( PeakBars( H, 0.5 , 2 ) );
DTBar2 = BarCount - 1 - LastValue( PeakBars( H, 0.5 , 1 ) );
DownTrendLine = LineArray( DTBar1, DTValue1, DTBar2, DTValue2, 1 );
DTLine = LineArray( DTBar1, DTValue1, DTBar2, DTValue2, 0 );
Plot( DownTrendLine , _DEFAULT_NAME(), colorRed, styleLine | styleNoTitle | styleNoLabel );
Plot( DTLine , _DEFAULT_NAME(), colorRed, styleLine | styleNoTitle | styleNoLabel );
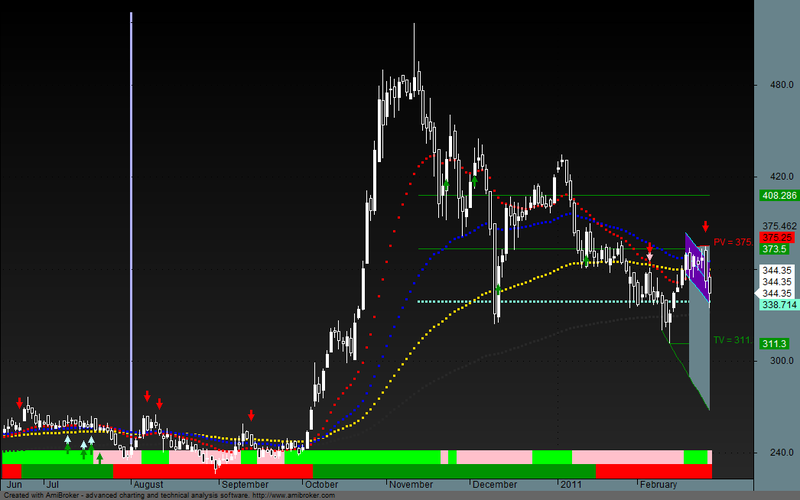
PlotText( "PV = " + WriteVal( DTValue2 , fraction ), LastValue( BarIndex() ) + 2, ( DTValue2 ), colorRed );
PlotText( "TV = " + WriteVal( UTValue2, fraction ), LastValue( BarIndex() ) + 2, UTValue2, colorGreen );
PlotOHLC( UpTrendLine , UpTrendLine , DownTrendLine , DownTrendLine , "", colorPaleBlue, styleCloud | styleNoRescale );
Plot( LineArray( DTBar2, DTValue2, BarCount, DTValue2, 0 ), "", colorRed );
Plot( LineArray( UTBar2, UTValue2, BarCount, UTValue2, 0 ), "", colorGreen );
_SECTION_END();
_SECTION_BEGIN( "Pivot" );
YH = TimeFrameGetPrice( "H", inDaily, -1 ); // yesterdays high
YL = TimeFrameGetPrice( "L", inDaily, -1 ); // low
YC = TimeFrameGetPrice( "C", inDaily, -1 ); // close
TO = TimeFrameGetPrice( "O", inDaily ); // current day open
//Normal Pivot
PP = ( YH + YL + YC ) / 3;
R1 = ( 2 * PP ) - YL;
R2 = PP + ( YH - YL );
R3 = YH + 2 * ( PP - YL );
S1 = ( 2 * PP ) - YH;
S2 = PP - ( YH - YL );
S3 = YL - 2 * ( YH - PP ) ;
_SECTION_END();
_SECTION_BEGIN( "Title" );
Title = EncodeColor( colorWhite ) + Date() + " Close = " + EncodeColor( colorRed ) + Close +
EncodeColor( colorWhite ) + " Open = " + EncodeColor( colorWhite ) + O +
EncodeColor( colorWhite ) + " High = " + EncodeColor( 5 ) + H +
EncodeColor( colorWhite ) + " Low = " + EncodeColor( colorRed ) + L +
EncodeColor( colorWhite ) + " Volume = " + EncodeColor( colorWhite ) + V + "\n\n" +
EncodeColor( colorWhite ) + "Pivot Point= " + EncodeColor( colorWhite ) + PP +
EncodeColor( colorWhite ) + " Day's Open= " + EncodeColor( colorWhite ) + TO + "\n\n" +
EncodeColor( colorGreen ) + "If days open is greater than Pivot Point, market is in uptrend and \n" + EncodeColor( colorGreen ) + "if days Open is less than Pivot Point, market is in downtrend" + "\n\n" +
EncodeColor( colorRed ) + "R1= " + EncodeColor( colorWhite ) + R1 +
EncodeColor( colorRed ) + " R2= " + EncodeColor( colorWhite ) + R2 +
EncodeColor( colorRed ) + " R3= " + EncodeColor( colorWhite ) + R3 + "\n" +
EncodeColor( colorGreen ) + "S1= " + EncodeColor( colorWhite ) + S1 +
EncodeColor( colorGreen ) + " S2= " + EncodeColor( colorWhite ) + S2 +
EncodeColor( colorGreen ) + " S3= " + EncodeColor( colorWhite ) + S3 + "\n" +
EncodeColor( colorWhite ) + "____ _____ _______ _______ _______" + "\n";
_SECTION_END();
_SECTION_BEGIN( "Target" );
CBuy = Cross( C, DownTrendLine );
CSell = Cross( UpTrendLine , C );
baratbuy = ValueWhen( CBuy , BarIndex() ) ;
baratsell = ValueWhen( CSell , BarIndex() ) ;
PlotShapes( shapeUpTriangle* CBuy , colorBlue, O, L );
PlotShapes( shapeDownTriangle * CSell , colorRed, O, H );
_SECTION_END();
_SECTION_BEGIN( "Auto" );
Buy = ( CBuy ) AND ( ( BarCount - baratbuy ) <= ScanLookBack );
Sell = ( CSell ) AND ( ( BarCount - baratsell ) <= ScanLookBack ) ;
price = C[BarCount-1];
AlertIf( Buy, "", "Buy @" + C + " Price @ Trigger=" + price, 1 );
AlertIf( Sell, "", "Sell @" + C + " Price @ Trigger=" + price, 2 );
Filter = Buy OR Sell ;
Var = WriteIf( Buy, "BUY", WriteIf( Sell, "SELL", "" ) );
AddTextColumn( Var , "Buy/Sell", 1.2 , colorWhite, IIf( Buy, colorLime, IIf( Sell, colorOrange, colorWhite ) ) );
AddColumn( price , "Price", 1.2, colorWhite, IIf( Buy, colorLime, IIf( Sell, colorOrange, colorWhite ) ) );
AddColumn( C , "Price @ Trigger", 1.2, colorWhite, IIf( Buy, colorLime, IIf( Sell, colorOrange, colorWhite ) ) );
stoploss = IIf( Buy, ( price * ( 1 - 0.01 ) ) , IIf( Sell, ( price * ( 1 + 0.01 ) ), 0 ) );
target1per = IIf( Buy, ( price * ( 1 + 0.01 ) ) , IIf( Sell, ( price * ( 1 - 0.01 ) ), 0 ) );
target15per = IIf( Buy, ( price * ( 1 + 0.015 ) ) , IIf( Sell, ( price * ( 1 - 0.015 ) ), 0 ) );
target2per = IIf( Buy, ( price * ( 1 + 0.02 ) ) , IIf( Sell, ( price * ( 1 - 0.02 ) ), 0 ) );
AddColumn( stoploss , "Stop Loss", 1.2, colorWhite, IIf( Buy, colorLime, IIf( Sell, colorOrange, colorWhite ) ) );
AddColumn( target1per , "1% Target", 1.2, colorWhite, IIf( Buy, colorLime, IIf( Sell, colorOrange, colorWhite ) ) );
AddColumn( target15per , "1.5% Target", 1.2, colorWhite, IIf( Buy, colorLime, IIf( Sell, colorOrange, colorWhite ) ) );
AddColumn( target2per , "2% Target", 1.2, colorWhite, IIf( Buy, colorLime, IIf( Sell, colorOrange, colorWhite ) ) );
AddColumn( V , "Volume", 1.2, colorWhite, IIf( Buy, colorLime, IIf( Sell, colorOrange, colorWhite ) ) );
bardiff = BarCount - IIf( Buy, baratbuy, IIf( Sell, baratsell, 0 ) );
AddColumn( bardiff , "Bar Diff", 1.2, colorWhite, IIf( Buy, colorLime, IIf( Sell, colorOrange, colorWhite ) ) );
_SECTION_END();
_SECTION_END();
}
if ( EKEKO == 1 )
{
_SECTION_BEGIN( "EKEKO" );
//------------------------------------------------------------------------------
//
// price chart with trade calls for aroon + sar signs
//
//------------------------------------------------------------------------------
ScriptVersion = " explorativo del Main al 12 de set 2005";
//////////////////// PRECIO //////////////////////////////////////////////
Plot( C, "", colorWhite, styleCandle | styleNoLabel );
Filter = Close > 10;
AddColumn( Close, "Close" );
PositionSize = 100;
/////////////////////// MEDIAS MOVILES///////////////////
slope = Param( "slope", 2, 2, 100, 1 );
Color20 = IIf( LinRegSlope( MA( C, 20 ), slope ) < 0, colorRed, colorBrightGreen );
event1 = LinRegSlope( MA( C, 20 ), slope ) < 0;
Plot( MA( C, 20 ), "", Color20 , styleLine );
//Plot( event1, "", colorRose, styleArea|styleOwnScale);
Color50 = IIf( LinRegSlope( MA( C, 50 ), slope ) < 0, colorRed, colorBrightGreen );
Plot( MA( C, 50 ), "", Color50 , styleLine );
Color100 = IIf( LinRegSlope( MA( C, 100 ), slope ) < 0, colorRed, colorYellow );
Plot( MA( C, 100 ), "", Color100 , styleLine );
Color150 = IIf( LinRegSlope( MA( C, 150 ), slope ) < 0, colorRed, 10 );
Plot( MA( C, 150 ), "", Color150 , styleLine );
event1 = Cross( MA( C, 20 ), MA( C, 50 ) );
PlotShapes( IIf( event1 , shapeDigit1, 0 ) , 5, 0, L, -30 );
event2 = Cross( MA( C, 50 ), MA( C, 100 ) );
PlotShapes( IIf( event2 , shapeDigit2, 0 ) , 6, 0, L, -30 );
event3 = Cross( MA( C, 100 ), MA( C, 150 ) );
PlotShapes( IIf( event3 , shapeDigit3, 0 ) , 7, 0, L, -30 );
event4 = Cross( MA( C, 50 ), MA( C, 20 ) );
PlotShapes( IIf( event4 , shapeDigit4, 0 ) , 5, 0, H, 30 );
event5 = Cross( MA( C, 100 ), MA( C, 50 ) );
PlotShapes( IIf( event5 , shapeDigit5, 0 ) , 6, 0, H, 30 );
event6 = Cross( MA( C, 150 ), MA( C, 100 ) );
PlotShapes( IIf( event6 , shapeDigit6, 0 ) , 7, 0, H, 30 );
event7 = Cross( MA( C, 5 ), MA( C, 20 ) );
PlotShapes( IIf( event7 , shapeDigit7, 0 ) , 9, 0, L, -30 );
//////////////////////////////////MACD///////////////////////////////////
MACDRequired = 1;
FAST = Param( "FAST", 12, 0, 100, 1 );
SLOW = Param( "SLOW", 26, 0, 100, 1 );
SIG = Param( "SIG", 9, 0, 100, 1 );
MACDLine = MACD( FAST, SLOW );
MACDSignal = Signal( FAST, SLOW, SIG );
MACDHisto = MACDLine - MACDSignal;
MIN10 = Param( "X MACD10", 5, 1, 30, step = 0.1 );
MIN60 = Param( "X MACD60", 10, 1, 30, step = 0.1 );
MACDBACKBARS = Param( "Lookback MACD", 1, 1, 30, step = 1 );
MinDir = Param( "DirChange", 0.6, -5, 5, step = 0.01 );
NOEXCESS = Param( "Remove Excess Signals", 1, 0, 1, step = 1 );
if ( Interval() <= 600 )
MACDRequired = MIN10; // 10 minute +/-5 extreme
if ( Interval() >= 3600 )
MACDRequired = MIN60; // 60 minute +/- 10
/////////////////// HISTOGRAMA ////////////////////////////////
MACDHisto = MACDLine - MACDSignal;
HistDivUp = Cross( LinRegSlope( MACDHisto, 3 ), 0 );
HistDivDn = Cross( 0, LinRegSlope( MACDHisto, 3 ) );
HBuy = HistDivUp ;
HSell = HistDivDn ;
PlotShapes( IIf( HBuy , 3, 0 ) , colorBrightGreen, 0, L, -22 );
PlotShapes( IIf( HSell, 4, 0 ) , colorYellow, 0, H, -22 );
////////////////////// AROON //////////////////////////////////
Period = Param( "Aroon Period", 14, 1, 100, 1 );
LLVBarsSince = LLVBars( L, Period ) + 1;
HHVBarsSince = HHVBars( H, Period ) + 1;
AD = 100 * ( Period - LLVBarsSince ) / ( Period - 1 );
AU = 100 * ( Period - HHVBarsSince ) / ( Period - 1 );
AO = AU - AD;
MINAROONOSC = Param( "AO ", 45, 0, 100, step = 0.1 );
MINAROONSIG = Param( "AV ", 99.9, 0, 100, step = 0.1 );
MINAROONOSC = Optimize( "Aroon Osc ", MINAROONOSC, 0, 100, step = 1 );
MINAROONSIG = Optimize( "Aroon Value", MINAROONSIG, 0, 100, step = 1 );
event1 = Cross( MINAROONSIG, AD ) AND AO <= -MINAROONOSC;
event2 = Cross( MINAROONSIG, AU ) AND AO >= MINAROONOSC;
// Include MACD / Signal Cross
AroonMACD = MACD() >= Signal();
event3 = Cross( MINAROONSIG, AU ) AND AO >= MINAROONOSC AND AroonMACD > 0;
event4 = Cross( MINAROONSIG, AD ) AND AO <= -MINAROONOSC ;
//if(AroonBuy[BarCount-1]) PlotShapes( ( AroonBuy OR AroonSell )+5 ,IIf( AroonBuy, colorPaleGreen, colorPink ), 0 );
event5 = Cross( AO, 0 );
event6 = Cross( 0, AO );
event7 = Cross( AO, -50 );
event8 = Cross( 0, AO );
event9 = Cross( AU, AD );
event10 = Cross( AD, AU );
//Plot(AU ,"AU" ,colorBrightGreen,styleLine);
//Plot(AD,"AD" ,colorRed ,styleLine);
//Plot(AO ,"Osc",Coloryellow,styleLine+styleOwnScale);
AroonBuy = event9;
AroonSell = event10;
PlotShapes( IIf( AroonBuy , 5, 0 ) , colorBrightGreen, 0, L );
PlotShapes( IIf( AroonSell, 6, 0 ) , colorYellow, 0, H );
//////////////////////////////// DMI //////////////////////////////////
MACDLine = MACD( FAST, SLOW );
range = Param( "R ADX ", 14, 1, 50, step = 1 );
//Prefs(49);
MINADX = Param( "X ADX ", 30, 1, 50, step = 0.1 );
ADXBACKBARS = Param( "LB ADX", 3, 1, 30, step = 1 );
// Find the direction of ADX
ADXTipDirA = LinRegSlope( ADX( range ), 2 ); // Short term direction change
ADXTipDir = LinRegSlope( ADXTipDirA * 4, 3 ); // Short term direction change
ADXFastDir = LinRegSlope( ADX( range ), 3 ); // Medium
ADXSlowDir = LinRegSlope( ADX( range ), 6 ); // Longer
// Direction *CHANGE* of ADX at the 'extremes'
ADXSlopeUp = Cross( ADXTipDir, 0 ) AND ADX( range ) < 20;
ADXSlopeDn = Cross( 0, ADXTipDir ) AND ADX( range ) > MINADX;
ADXHistory = ADX( range );
ADXBuy1 = ADXFastDir > 0 AND ADX( range ) > 20 AND ( PDI( range ) > MDI( range ) ) AND MACDLine > 0;//TrendUp
ADXSell2 = ADXFastDir > 0 AND ADX( range ) > 20 AND ( MDI( range ) > PDI( range ) ) AND MACDLine < 0; //TrendDown
ADXBuy3 = ADXSlowDir > 0; //AND ADX(range)< 20 AND ( PDI(range)>MDI(range));//WarnUp
ADXSell4 = ADXSlowDir > 0; //AND ADX(range)< 20 AND ( MDI(range)>PDI(range));//WarnDn
ADXBuy5 = ADX( range ) > MDI( range ) AND MDI( range ) > 30;//MDIX
ADXSell6 = ADX( range ) > PDI( range ) AND PDI( range ) > 30;//PDIX
ADXBuy7 = BarsSince( ADXTipDir < MinDIR ) < BarsSince( ADXBuy1 ) + ADXBACKBARS AND ADX( range ) > MINADX;
ADXSell8 = BarsSince( ADXTipDir < MinDIR ) < BarsSince( ADXSell6 ) + ADXBACKBARS AND ADX( range ) > MINADX;
ADXBuy9 = BarsSince( MACDLine < -MACDRequired ) < MACDBACKBARS ; // AND HistDivUp;
ADXSell10 = BarsSince( MACDLine > MACDRequired ) < MACDBACKBARS; // AND HistDivDn;
ADXBuy11 = ADXBuy5 AND ADXSlopeDn;
ADXSell12 = ADXSell6 AND ADXSlopeDn;
ADXBuy13 = ADXBuy5 AND ADXTipDir < 0 AND Peak( ADXHistory, 0.5, 1 ) > ADX( range ); //AND ADXSlopeDn;
ADXSell14 = ADXSell6 AND ADXTipDir < 0 AND Peak( ADXHistory, 0.5, 1 ) > ADX( range ); //AND ADXSlopeDn;
ADXBuy15 = ADXBuy5 AND ADXTipDir < 0 AND ADXHistory[BarCount-10] < ADX( range ); //AND ADXSlopeDn;
ADXSell16 = ADXSell6 AND ADXTipDir < 0 AND ADXHistory[BarCount-10] < ADX( range ); //AND ADXSlopeDn;
ADXBuy17 = ADXBuy5 AND ADXSlopeDn;
ADXBuy18 = Cross( PDI( range ), MDI( range ) );
ADXSell19 = Cross( MDI( range ), PDI( range ) );
ADXBuy = ADXBuy18;
ADXSell = ADXSell19;
// Remove excess Buy/Sell Signals from ADX Based Signals
if ( NOEXCESS )
ADXBuy = ExRemSpan( ADXBuy, 5 );
if ( NOEXCESS )
ADXSell = ExRemSpan( ADXSell, 5 );
PlotShapes( IIf( ADXBuy , 5, 0 ) , colorYellow, 0 );
PlotShapes( IIf( ADXSell, 6, 0 ) , colorWhite, 0 );
////////////////////// BOLLINGER BANDS ///////////////////////
TopBand = BBandTop( Close, 20, 2 );
LowBand = BBandBot( Close, 20, 2 );
dirup = ( BarsSince( Low < LowBand ) < 5 );
dirdn = ( BarsSince( High > TopBand ) < 5 );
BBBuy = 0;
BBSell = 0;
///////////////////// ORDEN DE COMPRA ////////////////////////////////////
//Buy = AroonBuy;
//Sell = AroonSell;
// Remove excess Buy/Sell Signals
//Short = Sell;
//Cover = Buy;
//if(NOEXCESS) Buy = ExRemSpan( Buy, 1 );
//if(NOEXCESS) Sell = ExRemSpan( Sell, 1 );
//PlotShapes( IIf(Buy ,1,0) ,colorBlue, 0,Graph0,-18 );
//PlotShapes( IIf(Sell,2,0) ,colorYellow, 0,Graph0,-18 );
//////////////////REGRESION LINEAL ///////////////////////////////////
LookBack = Param( "Lookback (RegressionChannel)", 72, 1, 300 );
NH = LastValue( HHVBars( High, LookBack ) ); // lookback period - can be set by the user if necessary
NL = LastValue( LLVBars( Low , LookBack ) ); // lookback period - can be set by the user if necessary
N = 0;
if ( NL > NH )
{
N = NL;
}
else
{
N = NH;
}
Start = 1;
X = Cum( Start ); // Set up the x cordinate array of the Linear Regression Line
Y = Close; // Set the y co-ordinate of the Linear Regression line
/* Calculate the slope (bconst) and the y intercept (aconst) of the line */
SUMX = LastValue( Sum( X, N ) );
SUMY = LastValue( Sum( Y, N ) );
SUMXY = LastValue( Sum( X * Y, N ) );
SUMXSqd = LastValue( Sum( X * X, N ) );
SUMSqdX = LastValue( SUMX * SUMX );
bconst = ( N * SUMXY - SUMX * SUMY ) / ( N * SUMXSqd - SUMSqdX );
aconst = ( SUMY - bconst * ( SUMX ) ) / N;
/* Force the x value to be very negative so the graph does not apear before the
lookback period */
Domain = IIf ( X > LastValue( X ) - N, 1 , -1e10 );
Xvar = X * Domain;
/* Linear Regression Line */
Yvar = aconst + bconst * Xvar;
Plot( Yvar + LastValue( HHV( High - Yvar, N ) ), "Upper Channel", colorWhite, styleLine | styleNoLabel );
Plot( Yvar, "Middle Channel", colorWhite, styleLine | styleNoLabel );
Plot( Yvar - LastValue( HHV( Yvar - Low , N ) ), "Lower Channel", colorWhite, styleLine | styleNoLabel );
///////////////// SAR ////////////////////////////////////////////////
IAF = 0.02; // acceleration factor
MaxAF = 0.2; // max acceleration
psar = Close; // initialize
long = 1; // assume long for initial conditions
af = IAF; // init acelleration factor
ep = Low[ 0 ]; // init extreme point
hp = High [ 0 ];
lp = Low [ 0 ];
for ( i = 2; i < BarCount; i++ )
{
if ( long )
{
psar [ i ] = psar [ i-1 ] + af * ( hp - psar [ i-1 ] );
}
else
{
psar [ i ] = psar [ i-1 ] + af * ( lp - psar [ i-1 ] );
}
reverse = 0;
//check for reversal
if ( long )
{
if ( Low [ i ] < psar [ i ] )
{
long = 0;
reverse = 1; // reverse position to Short
psar [ i ] = hp; // SAR is High point in prev trade
lp = Low [ i ];
af = IAF;
}
}
else
{
if ( High [ i ] > psar [ i ] )
{
long = 1;
reverse = 1; //reverse position to long
psar [ i ] = lp;
hp = High [ i ];
af = IAF;
}
}
if ( reverse == 0 )
{
if ( long )
{
if ( High [ i ] > hp )
{
hp = High [ i ];
af = af + IAF;
if ( af > MaxAF )
af = MaxAF;
}
if ( Low[ i - 1 ] < psar[ i ] )
psar[ i ] = Low[ i - 1 ];
if ( Low[ i - 2 ] < psar[ i ] )
psar[ i ] = Low[ i - 2 ];
}
else
{
if ( Low [ i ] < lp )
{
lp = Low [ i ];
af = af + IAF;
if ( af > MaxAF )
af = MaxAF;
}
if ( High[ i - 1 ] > psar[ i ] )
psar[ i ] = High[ i - 1 ];
if ( High[ i - 2 ] > psar[ i ] )
psar[ i ] = High[ i - 2 ];
}
}
}
Plot( psar, "SAR", colorSkyblue, styleDots | styleNoLine | styleThick );
///////////// COMENTARIOS DE INTERPRETACION ///////////////////
if ( SelectedValue( ADXBuy1 ) OR SelectedValue( ADXSell2 ) )
{
if ( SelectedValue( ADXBuy1 ) )
{
printf( "We're in a uptrend." );
};
if ( SelectedValue( ADXSell2 ) )
{
printf( "We're in a downtrend." );
};
}
else
{
printf( "Falling ADX - watch for MACD Histogram Divergence" );
if ( SelectedValue( HistDivUp ) )
printf( "(currently UP)" );
if ( SelectedValue( HistDivDn ) )
printf( "(currently DOWN)" );
}
if ( SelectedValue( ADXFastDir ) > 0 )
{
if ( SelectedValue( ADXBuy5 ) )
printf( "Wait for retest of low, and then ADX turn down" );
if ( SelectedValue( ADXSell6 ) )
printf( "Wait for retest of high, and then ADX turn down" );
}
WriteIf( BBBuy , "Bollinger Buy Signal (usually good until 20EMA)", "" );
WriteIf( BBSell , "Bollinger Sell Signal (usually good until 20EMA)", "" );
WriteIf( ADXBuy3 , "Watch out - could be a beginning uptrend.", "" );
WriteIf( ADXSell4 , "Watch out - could be a beginning downtrend.", "" );
WriteIf( ADXBuy1 AND MACDLine < 1 AND HistDivDn, "*WARNING* Trend could fail to begin !", "" );
WriteIf( ADXSell2 AND MACDLine > -1 AND HistDivUp, "*WARNING* Trend could fail to begin !", "" );
WriteIf( ADX( range ) < 20 , "Trading range, weak direction - watch for Histogram Divergences", "" );
WriteIf( True , " ------- DEBUG -------", "" );
WriteIf( HistDivUp , "Histogram divergence up ", "Hup wait" );
WriteIf( HistDivDn , "Histogram divergence down", "Hdn wait" );
WriteIf( ADXSlopeUp , "ADX Up ", "Aup wait" );
WriteIf( ADXSlopeDn , "ADX Dn ", "Adn wait" );
WriteIf( MDI( range ) > 30 , "MDI", "DMI wait" );
WriteIf( PDI( range ) > 30 , "PDI", "DMI wait" );
WriteIf( ADXBuy5 , "MDI-X", "DMI wait" );
WriteIf( ADXSell6 , "PDI-X", "DMI wait" );
_SECTION_END();
}
if ( CANDLE_PIVOT_TRENDLINES == 1 )
{
_SECTION_BEGIN( "CANDLE_PIVOT_TRENDLINES" );
/////// advance trenlines with candle pivots ///////////////////
SetChartOptions( 0, chartShowArrows | chartShowDates );
_N( Title = StrFormat( "{{NAME}} - {{INTERVAL}} {{DATE}} ,{{VALUES}}", O, H, L, C, SelectedValue( ROC( C, 1 ) ) ) );
Plot( C, "", IIf( O >= C, colorOrange, colorGreen ), styleCandle );
SetChartBkGradientFill( ParamColor( "Inner panel upper", colorBlack ), ParamColor( "Inner panel lower", colorBlack ) );
_N( Title = EncodeColor( colorWhite ) + StrFormat( " {{NAME}} - {{INTERVAL}} {{DATE}} Open:%g,high:%g,low:%g, Close:%g ,{{VALUES}}", O, H, L, C ) );
/////////////////////////////////////////////////////////////////////////////////////////////
farback = Param( "How Far back to go", 100, 50, 5000, 10 );
nBars = Param( "Number of bars", 12, 5, 40 );
aHPivs = H - H;
aLPivs = L - L;
aHPivHighs = H - H;
aLPivLows = L - L;
aHPivIdxs = H - H;
aLPivIdxs = L - L;
nHPivs = 0;
nLPivs = 0;
lastHPIdx = 0;
lastLPIdx = 0;
lastHPH = 0;
lastLPL = 0;
curPivBarIdx = 0;
aHHVBars = HHVBars( H, nBars );
aLLVBars = LLVBars( L, nBars );
aHHV = HHV( H, nBars );
aLLV = LLV( L, nBars );
aVisBars = Status( "barvisible" );
nLastVisBar = LastValue( Highest( IIf( aVisBars, BarIndex(), 0 ) ) );
_TRACE( "Last visible bar: " + nLastVisBar );
curBar = ( BarCount - 1 );
curTrend = "";
if ( aLLVBars[curBar] < aHHVBars[curBar] )
{
curTrend = "D";
}
else
{
curTrend = "U";
}
for ( i = 0; i < farback; i++ )
{
curBar = ( BarCount - 1 ) - i;
if ( aLLVBars[curBar] < aHHVBars[curBar] )
{
if ( curTrend == "U" )
{
curTrend = "D";
curPivBarIdx = curBar - aLLVBars[curBar];
aLPivs[curPivBarIdx] = 1;
aLPivLows[nLPivs] = L[curPivBarIdx];
aLPivIdxs[nLPivs] = curPivBarIdx;
nLPivs++;
}
}
else
{
if ( curTrend == "D" )
{
curTrend = "U";
curPivBarIdx = curBar - aHHVBars[curBar];
aHPivs[curPivBarIdx] = 1;
aHPivHighs[nHPivs] = H[curPivBarIdx];
aHPivIdxs[nHPivs] = curPivBarIdx;
nHPivs++;
}
}
}
curBar = ( BarCount - 1 );
candIdx = 0;
candPrc = 0;
lastLPIdx = aLPivIdxs[0];
lastLPL = aLPivLows[0];
lastHPIdx = aHPivIdxs[0];
lastHPH = aHPivHighs[0];
if ( lastLPIdx > lastHPIdx )
{
candIdx = curBar - aHHVBars[curBar];
candPrc = aHHV[curBar];
if ( lastHPH < candPrc AND candIdx > lastLPIdx AND candIdx < curBar )
{
aHPivs[candIdx] = 1;
for ( j = 0; j < nHPivs; j++ )
{
aHPivHighs[nHPivs - j] = aHPivHighs[nHPivs - ( j + 1 )];
aHPivIdxs[nHPivs - j] = aHPivIdxs[nHPivs - ( j + 1 )];
}
aHPivHighs[0] = candPrc;
aHPivIdxs[0] = candIdx;
nHPivs++;
}
}
else
{
candIdx = curBar - aLLVBars[curBar];
candPrc = aLLV[curBar];
if ( lastLPL > candPrc AND candIdx > lastHPIdx AND candIdx < curBar )
{
aLPivs[candIdx] = 1;
for ( j = 0; j < nLPivs; j++ )
{
aLPivLows[nLPivs - j] = aLPivLows[nLPivs - ( j + 1 )];
aLPivIdxs[nLPivs - j] = aLPivIdxs[nLPivs - ( j + 1 )];
}
aLPivLows[0] = candPrc;
aLPivIdxs[0] = candIdx;
nLPivs++;
}
}
for ( k = 0; k < nHPivs; k++ )
{
_TRACE( "High pivot no. " + k + " at barindex: " + aHPivIdxs[k] + ", " + WriteVal( ValueWhen( BarIndex() == aHPivIdxs[k], DateTime(), 1 ), formatDateTime ) + ", " + aHPivHighs[k] );
}
a1 = ahpivs == 1;
a2 = alpivs == 1;
PlotShapes( a1 *shapeSmallCircle, colorRed, 0, H, Offset = 5 );
PlotShapes( a2 *shapeSmallCircle, colorGreen, 0, L, Offset = -5 );
//////////////////////////////////////////////////////
Para = ParamToggle( "Plot Parallel Lines", "Off,On" );
ColorS = ParamColor( "Support", colorLime );
ColorR = ParamColor( "Resistance", colorRed );
x = Cum( 1 );
s1 = L;
s11 = H;
pS = a2 == 1;
endt = LastValue( ValueWhen( ps, x, 1 ) );
startt = LastValue( ValueWhen( ps, x, 2 ) );
ends = LastValue( ValueWhen( ps, S1, 1 ) );
starts = LastValue( ValueWhen( ps, S1, 2 ) );
dtS = endt - startt;
aS = ( endS - startS ) / dtS;
bS = endS;
trendlineS = aS * ( x - endt ) + bS;
g3 = IIf( x > startt - 10, trendlineS, Null );
Plot( g3, "", colors, styleThick );
pR = a1 == 1;
endt1 = LastValue( ValueWhen( pr, x, 1 ) );
startt1 = LastValue( ValueWhen( pr, x, 2 ) );
endr = LastValue( ValueWhen( pr, S11, 1 ) );
startr = LastValue( ValueWhen( pr, S11, 2 ) );
dtR = endt1 - startt1;
aR = ( endR - startR ) / dtR;
bR = endR;
trendlineR = aR * ( x - endt1 ) + bR;
g4 = IIf( x > startT1 - 10, trendlineR, Null );
Plot( g4, "", colorr, styleThick );
acd = log( endr / startr ) / ( endt1 - startt1 );
res1 = exp( ( x - endt1 ) * acd ) * endr;
RRL = ROC( res1, 1 );
bcd = log( ends / starts ) / ( endt - startt );
sup1 = exp( ( x - endt ) * bcd ) * ends;
RSL = ROC( sup1, 1 );
Low_Value = LastValue( Ref( LLV( L, endt1 - startt1 ), -( x - endt1 ) ) );
x2 = LastValue( ValueWhen( L == Low_Value & x > startt1 & x < endt1, x ) );
PLL = IIf( LastValue( x ) - x2 > 5, exp( ( x - x2 ) * acd ) * Low_Value, Null );
Hi_Value = LastValue( Ref( HHV( H, endt - startt ), -( x - endt ) ) );
x3 = LastValue( ValueWhen( H == Hi_Value & x > startt & x < endt, x ) );
PHL = IIf( LastValue( x ) - x3 > 5, exp( ( x - x3 ) * bcd ) * Hi_Value, Null );
SLabs = sup1 - Ref( sup1, -1 );
RLabs = res1 - Ref( res1, -1 );
ROC2SL = ( SLabs / C ) * 100;
ROC2RL = ( RLabs / C ) * 100;
PLLd = abs( ( LastValue( C ) / LastValue( PLL ) ) - 1 ) < 0.01 * 100;
PHLd = abs( ( LastValue( C ) / LastValue( PHL ) ) - 1 ) < 0.01 * 100;
barvisible = Status( "barvisible" );
firstvisiblebar = barvisible & NOT
Ref( barvisible, -1 );
HHvisible = LastValue( HighestSince( firstvisiblebar, High ) );
LLvisible = LastValue( LowestSince( firstvisiblebar, Low ) );
RaH = HHvisible * 1.05;
RaL = LLVisible * 0.95;
AnZ = starts == 0 OR ends == 0 OR startr == 0 OR endr == 0;
PLplot = IIf( x - x2 >= 0 & abs( LastValue( L / PLL ) - 1 ) < abs( LastValue( ( 100 / 1000 ) * ATR( 14 ) ) ) & PLL > RaL & PLL < RaH & NOT AnZ, PLL, IIf( x - x2 >= 0 & RaL == 0 & PLLd & abs( LastValue( L / PLL ) - 1 ) < abs( LastValue( ( 100 / 1000 ) * ATR( 14 ) ) ) & NOT AnZ, PLL, Null ) );
PHplot = IIf( x - x3 >= 0 & abs( LastValue( H / PHL ) - 1 ) < abs( LastValue( ( 100 / 1000 ) * ATR( 14 ) ) ) & PHL > RaL & PHL < RaH & NOT AnZ, PHL, IIf( x - x3 >= 0 & RaL == 0 & PHLd & abs( LastValue( H / PHL ) - 1 ) < abs( LastValue( ( 100 / 1000 ) * ATR( 14 ) ) ) & NOT AnZ, PHL, Null ) );
Plot( IIf( Para, PLplot, Null ), " ", colorr, styleDashed, maskDefault + styleNoRescale );
Plot( IIf( Para, PHplot, Null ), " ", colors, styleDashed, maskDefault + styleNoRescale );
_SECTION_END();
}
if ( ISFANDI == 1 )
{
_SECTION_BEGIN( "ISFANDI" );
SRswitch = ParamToggle( "Sup / Res Lines", "On,Off" );
CHLswitch = ParamToggle( "Hi Low / Close", "Hi Low,Close" );
NoLines = Param( "No of Lines", 3, 1, 10, 1 );
Sen = Param( "Sensitivity", 5, 1, 100, 1 );
Rcolor = ParamColor( "Res Color", colorDarkGreen );
Rstyle = ParamStyle( "Res Style", styleLine );
Scolor = ParamColor( "Sup Color", colorBrown );
Sstyle = ParamStyle( "Sup Style", styleLine );
y = 0;
x = 0;
for ( i = 1; i < NoLines + 1 ; i++ )
{
Y[i] = LastValue( Peak( IIf( CHLswitch, C, H ), Sen, i ) );
x[i] = BarCount - 1 - LastValue( PeakBars( IIf( CHLswitch, C, H ), Sen, i ) );
Line = LineArray( x[i], y[i], Null, y[i], 1 );
Plot( IIf( SRswitch, Null, Line ), "", Rcolor, Rstyle );
Y[i] = LastValue( Trough( IIf( CHLswitch, C, L ), Sen, i ) );
x[i] = BarCount - 1 - LastValue( TroughBars( IIf( CHLswitch, C, L ), Sen, i ) );
Line = LineArray( x[i], y[i], Null, y[i], 1 );
Plot( IIf( SRswitch, Null, Line ), "", Scolor, Sstyle );
}
_SECTION_END();
_SECTION_BEGIN( "Detecting double tops and bottoms" );
/* Detecting double tops and bottoms*/
percdiff = 5; /* peak detection threshold */
fwdcheck = 5; /* forward validity check */
mindistance = 10;
validdiff = percdiff / 400;
PK = Peak( H, percdiff, 1 ) == High;
TR = Trough( L, percdiff, 1 ) == Low;
x = Cum( 1 );
XPK1 = ValueWhen( PK, x, 1 );
XPK2 = ValueWhen( PK, x, 2 );
xTR1 = ValueWhen( Tr, x, 1 );
xTr2 = ValueWhen( Tr, x, 2 );
peakdiff = ValueWhen( PK, H, 1 ) / ValueWhen( PK, H, 2 );
Troughdiff = ValueWhen( tr, L, 1 ) / ValueWhen( tr, L, 2 );
doubletop = PK AND abs( peakdiff - 1 ) < validdiff AND ( Xpk1 - Xpk2 ) > mindistance AND High > HHV( Ref( H, fwdcheck ), fwdcheck - 1 );
doubleBot = tr AND abs( troughdiff - 1 ) < validdiff AND ( Xtr1 - Xtr2 ) > mindistance AND Low < LLV( Ref( L, fwdcheck ), fwdcheck - 1 );
Buy = doubletop;
Sell = doublebot;
for ( i = 0; i < BarCount; i++ )
{
if ( Buy[i] )
PlotText( "Double TOP " , i, L[ i ], colorYellow );
if ( Sell[i] )
PlotText( "Double BOT" , i, H[ i ], colorWhite );
}
WriteIf( Highest( doubletop ) == 1, "AmiBroker has detected some possible
double top patterns for " + Name() + "\nLook for green arrows on the price
chart.", "There are no double top patterns for " + Name() );
WriteIf( Highest( doublebot ) == 1, "AmiBroker has detected some possible double
bottom patterns for " + Name() + "\nLook for red arrows on the price
chart.", "There are no double bottom patterns for " + Name() );
_SECTION_END();
_SECTION_BEGIN( "Isfandi Technical Viewer" );
//Plot(C,"",ParamColor( "Color", colorBlue ),ParamStyle("Style") );
//---- pivot points
GfxSetBkColor( colorBlack );
GfxSetTextColor( colorGrey50 );
GfxSelectFont( "Edwardian Script ITC", 25, 500, True );
GfxTextOut( "Isfandi Present ", 760 , 0 );
DayH = TimeFrameGetPrice( "H", inDaily, -1 );// yesterdays high
DayL = TimeFrameGetPrice( "L", inDaily, -1 );//low
DayC = TimeFrameGetPrice( "C", inDaily, -1 );//close
DayO = TimeFrameGetPrice( "O", inDaily );// current day open
HiDay = TimeFrameGetPrice( "H", inDaily );
LoDay = TimeFrameGetPrice( "L", inDaily );
PP = ( DayH + DayL + DayO + DayO ) / 4 ;
R1 = ( 2 * PP ) - DayL;
S1 = ( 2 * PP ) - DayH;
R2 = PP + R1 - S1;
S2 = PP + S1 - R1;
R3 = R2 + ( R1 - PP );
S3 = S2 - ( PP - S1 );
// OTHER INDICATOR
MOMETUM = RSI( 14 );
radius = 0.1 * Status( "pxheight" ); // get pixel height of the chart and use 45% for pie chart radius
textoffset = 0.1 * radius;
GfxSelectFont( "Arial", 9, 500, True );
GfxSetTextColor( colorGrey50 );
GfxTextOut( "-- PIVOT POINT --", textoffset , 86 );
GfxSetTextColor( colorGrey50 );
GfxTextOut( "-- SIGNAL --", textoffset , 188 );
GfxSetTextColor( colorGrey50 );
GfxTextOut( "-- TREND --", textoffset , 286 );
GfxSelectFont( "Arial", 9 );
GfxSetTextColor( colorGreen );
GfxTextOut( "R1 =" + R1, textoffset + 1, 120 );
GfxSetTextColor( colorLime );
GfxTextOut( "R2 = " + R2, textoffset + 1, 105 );
GfxSetTextColor( colorWhite );
GfxTextOut( "PP = " + PP, textoffset + 1, 135 );
GfxSetTextColor( colorOrange );
GfxTextOut( "S1 = " + S1, textoffset + 1, 150 );
GfxSetTextColor( colorRed );
GfxTextOut( "S2 = " + S2, textoffset + 1, 165 );
GfxSelectFont( "Arial", 9 );
_SECTION_END();
//////////////////////////////////////////////////////////////////////
_SECTION_BEGIN( "Elder Impulse" );
GfxSelectFont( "Arial", 9, 500, True );
///////////////////////////////////////////////////
SetChartOptions( 0, chartShowArrows | chartShowDates );
EnableTextOutput( False );
// User-defined parameter for EMA periods
EMA_Type = Param( "EMA-1, TEMA-2, JMA-3", 2, 1, 3, 1 );
EMA_prds = Param( "EMA_periods", 7, 1, 30, 1 );
Std_MACD = Param( "Standard MACD? No-0, Yes-1", 1, 0, 1, 1 );
Plot_fashion = Param( "Bar+Arrows-1, Impulse Bars-2", 2, 1, 2, 1 );
// Allow user to define Weekly and Monthly Ribbon Location and Height
WR_P1 = Param( "Weekly Ribbon Location", 5.2, -1000, 1000, 0.1 );
WR_P2 = Param( "Weekly Ribbon Height", 199, -0.001, 500, 0.1 );
//MR_P1 = Param("Monthly Ribbon Location", 5.2, -1000, 1000, 0.1);
//MR_P2 = Param("Monthly Ribbon Height", 199, -0.001, 500, 0.1);
// Compute EMA and MACD Histogram
if ( EMA_Type == 1 )
{
DayEMA = EMA( Close, EMA_prds );
}
if ( EMA_Type == 2 )
{
DayEMA = TEMA( Close, EMA_prds );
}
Histogram = MACD() - Signal();
// Determine if we have an Impulse UP, DOWN or None
Impulse_Up = DayEMA > Ref( DayEMA, -1 ) AND Histogram > Ref( Histogram, -1 );
Impulse_Down = DayEMA < Ref( DayEMA, -1 ) AND Histogram < Ref( Histogram, -1 );
Impulse_None = ( NOT Impulse_UP ) AND ( NOT Impulse_Down );
// Compute Weekly MACD and determine whether rising or falling
TimeFrameSet( inWeekly );
if ( Std_MACD == 0 )
{
MACD_val = MACD( 5, Cool );
Signal_val = Signal( 5, 8, 5 );
}
else
{
MACD_val = MACD( 12, 26 );
Signal_val = Signal( 12, 26, 9 );
}
Hist_in_w = MACD_val - Signal_val;
wh_rising = Hist_in_w > Ref( Hist_in_w, -1 );
wh_falling = Hist_in_w < Ref( Hist_in_w, -1 );
wh_none = ( NOT wh_rising ) AND ( NOT wh_falling );
TimeFrameRestore();
// Now get Monthly MACD Histogram....
TimeFrameSet( inMonthly );
MACD_val = MACD( 5, 8 );
Signal_val = Signal( 5, 8, 5 );
Hist_in_m = MACD_val - Signal_val;
mh_rising = Hist_in_m > Ref( Hist_in_m, -1 );
mh_falling = Hist_in_m < Ref( Hist_in_m, -1 );
TimeFrameRestore();
wh_rising = TimeFrameExpand( wh_rising, inWeekly, expandLast );
wh_falling = TimeFrameExpand( wh_falling, inWeekly, expandLast );
wh_none = TimeFrameExpand( wh_none, inWeekly, expandLast );
mh_rising = TimeFrameExpand( mh_rising, inMonthly, expandLast );
mh_falling = TimeFrameExpand( mh_falling, inMonthly, expandLast );
kol = IIf( wh_rising, colorBrightGreen, IIf( wh_falling, colorRed, IIf( wh_none, colorCustom11, colorLightGrey ) ) );
mkol = IIf( mh_rising, colorBlue, IIf( mh_falling, colorYellow, colorLightGrey ) );
if ( Plot_fashion == 1 )
{
}
else
{
bar_kol = IIf( impulse_UP, colorBrightGreen, IIf( impulse_Down, colorRed, colorCustom11 ) );
}
Impulse_State = WriteIf( Impulse_Up, "Bulllish", WriteIf( Impulse_Down, "Bearish", "Neutral" ) );
GfxSetTextColor( colorOrange );
GfxTextOut( "IMPULSE STATE = " + Impulse_State, textoffset + 1, 305 );
// Set the background color for Impulse Status Column
Impulse_Col = IIf( Impulse_Up, colorGreen, IIf( Impulse_Down, colorRed, colorGrey40 ) );
// Determine Weekly Trend. Display as Text Column
Weekly_Trend = WriteIf( wh_rising, "Rising", WriteIf( wh_falling, "Falling", "Flat!" ) );
Weekly_Col = IIf( wh_rising, colorGreen, IIf( wh_falling, colorRed, colorLightGrey ) );
GfxSetTextColor( colorRed );
GfxTextOut( "WEEKLT TREND = " + Weekly_Trend, textoffset + 1, 323 );
// Determine Monthly Trend. Display as Text Column
Monthly_Trend = WriteIf( mh_rising, "Rising", WriteIf( mh_falling, "Falling", "Flat!" ) );
Monthly_Col = IIf( mh_rising, colorGreen, IIf( mh_falling, colorRed, colorLightGrey ) );
GfxSetTextColor( colorBlue );
GfxTextOut( "MONTHLY TREND = " + Monthly_Trend, textoffset + 1, 340 );
// Determine how many bars has the current state existed
bars_in_bull = Min( BarsSince( impulse_none ), BarsSince( impulse_down ) );
bars_in_bear = Min( BarsSince( impulse_up ), BarsSince( impulse_none ) );
bars_in_neut = Min( BarsSince( impulse_down ), BarsSince( impulse_up ) );
// Set a single variable to show number of bars in current state depending upon
// actual Impulse Status - Bullish, Bearish or Neutral
bars_in_state = IIf( Impulse_Up, bars_in_bull, IIf( Impulse_down, bars_in_bear, bars_in_neut ) );
//weekly pivot
k1 = -1;
SetChartBkColor( 16 ) ;
k = IIf( ParamList( "select type", "daily|next day" ) == "daily", -1, 0 );
k1 = -1;
TimeFrameSet( inDaily );
day_h = LastValue( Ref( H, K ) );
day_l = LastValue( Ref( L, K ) );
day_c = LastValue( Ref( C, K ) );
TimeFrameRestore();
// day
DH = Day_h;
DL = Day_L;
DC = Day_C;
// DAY PIVOT Calculation
pd = ( DH + DL + DC ) / 3;
sd1 = ( 2 * pd ) - DH;
sd2 = pd - ( DH - DL );
sd3 = Sd1 - ( DH - DL );
rd1 = ( 2 * pd ) - DL;
rd2 = pd + ( DH - DL );
rd3 = rd1 + ( DH - DL );
WriteVal( StochK( 39 ) - StochK( 12 ) );
GfxSelectFont( "Arial", 8 );
_SECTION_END();
_SECTION_BEGIN( "STOCHASTIC" );
GfxSelectFont( "Arial", 9, 500, True );
periods = Param( "Periods", 15, 1, 200, 1 );
Ksmooth = Param( "%K avg", 3, 1, 200, 1 );
a = StochK( periods , Ksmooth );
Dsmooth = Param( "%D avg", 3, 1, 200, 1 );
b = StochD( periods , Ksmooth, DSmooth );
Buy = Cross( a, b );
Sell = Cross( b, a );
STOCH = WriteIf( a > b , "Up", "Down" );
GfxSetTextColor( colorLightOrange );
GfxTextOut( "Stochastic = " + STOCH, textoffset + 1, 239 );
GfxSelectFont( "Arial", 8 );
_SECTION_BEGIN( "Van K Tharp Efficient Stocks" );
// Mark Keitel 12-05
// Van K Tharp Efficient Stocks
GfxSelectFont( "Arial", 9, 500, True );
ATRD180 = ATR( 180 );
ATRD90 = ATR( 90 );
ATRD45 = ATR( 45 );
ATRD20 = ATR( 20 );
ATRD5 = ATR( 5 );
DifferenceD180 = Close - Ref( Close, -180 );
DifferenceD90 = Close - Ref( Close, -90 );
DifferenceD45 = Close - Ref( Close, -45 );
DifferenceD20 = Close - Ref( Close, -20 );
DifferenceD5 = Close - Ref( Close, -5 );
EfficiencyD180 = IIf( ATRD180 != 0, DifferenceD180 / ATRD180, 1 );
EfficiencyD90 = IIf( ATRD90 != 0, DifferenceD90 / ATRD90, 1 );
EfficiencyD45 = IIf( ATRD45 != 0, DifferenceD45 / ATRD45, 1 );
EfficiencyD20 = IIf( ATRD20 != 0, DifferenceD20 / ATRD20, 1 );
EfficiencyD5 = IIf( ATRD5 != 0, DifferenceD5 / ATRD5, 1 );
Averageeff = ( EfficiencyD180 + EfficiencyD90 + EfficiencyD45 +
EfficiencyD20 ) / 4;
//Plot( averageeff, "AvgEff", colorLightBlue, styleLine );
x = Param ( "Add Results to a Watchlist? Yes = 1, No = 2" , 2 , 1 , 2 , 1 ) ; // select whether to add results to watchlist or not
y = Param( "Set Watchlist Number", 25, 2, 60, 1 ); // sets the watchlist number, but reserves the first 2 and last 4 watchlists
// -------- Parameter Variables for Exploration --------------------------------
TCH = Param( "High close value ", 20, 5, 300, 0.5 );
TCL = Param( "Low close value " , 5, 1, 10, 0.25 );
AVP = Param( "Period for Avg Vol " , 21, 10, 240, 1 );
SV = Param( "Stock minimum Avg Vol " , 125000, 50000, 1000000, 500000 );
// -------------- Organize the exploration results ------------------------------------
P = Param( "Period for Price Delta Comparisons", 1, 1, 120, 1 );
P1 = Param( "Period for Other Delta Comparisons", 3, 1, 120, 1 );
PATR = Param( "Period for ATR", 5, 1, 21, 1 );
PADX = Param( "Period for ADX", 14, 3, 34, 1 );
PRSI = Param( "Period for RSI", 13, 3, 34, 1 );
ADX_TREND = WriteIf( PDI( PADX ) > MDI( PADX ), "_ TREND UP", "_TREND DOWN" );
GfxSetTextColor( colorRed );
GfxTextOut( "RSI(14) = " + MOMETUM + ADX_TREND , textoffset + 1, 223 );
ADX_14 = ADX( 14 );
GfxSetTextColor( colorLightBlue );
GfxTextOut( "ADX_TREND = " + ADX_14 + ADX_TREND, textoffset + 1, 207 );
_SECTION_END();
_SECTION_BEGIN( "SmoothHeikin MA Swing" );
SetBarsRequired( 200, 0 );
GraphXSpace = 1;
SetChartOptions( 0, chartShowArrows | chartShowDates );
k = Param( "K", 1.5, 1, 5, 0.1 );
Per = Param( "ATR", 3, 1, 30, 0.50 );
k1 = Optimize( "K", 1, 0.1, 5, 0.1 );
Per1 = Optimize( "ATR", 3, 1, 30, 0.50 );
HACLOSE = ( O + H + L + C ) / 4;
HaOpen = AMA( Ref( HaClose, -1 ), 0.5 );
HaHigh = Max( H, Max( HaClose, HaOpen ) );
HaLow = Min( L, Min( HaClose, HaOpen ) );
//PlotOHLC( HaOpen, HaHigh, HaLow, HaClose, "" + Name(), colorBlack, styleCandle | styleNoLabel );
j = Haclose;
//================================================== ================================================== ===================
//=========================Indicator================ ================================================== ============================
f = ATR( 14 );
rfsctor = WMA( H - L, Per );
revers = k * rfsctor;
Trend = 1;
NW[0] = 0;
for ( i = 1; i < BarCount; i++ )
{
if ( Trend[i-1] == 1 )
{
if ( j[i] < NW[i-1] )
{
Trend[i] = -1;
NW[i] = j[i] + Revers[i];
}
else
{
Trend[i] = 1;
if ( ( j[i] - Revers[i] ) > NW[i-1] )
{
NW[i] = j[i] - Revers[i];
}
else
{
NW[i] = NW[i-1];
}
}
}
if ( Trend[i-1] == -1 )
{
if ( j[i] > NW[i-1] )
{
Trend[i] = 1;
NW[i] = j[i] - Revers[i];
}
else
{
Trend[i] = -1;
if ( ( j[i] + Revers[i] ) < NW[i-1] )
{
NW[i] = j[i] + Revers[i];
}
else
{
NW[i] = NW[i-1];
}
}
}
}
//===============system================
Plot( NW, "", IIf( Trend == 1, 27, 4 ), 4 );
Buy = Cover = Cross( j, nw );
Sell = Short = Cross( nw, j );
SWING = WriteIf( j > nw, "UPTREND", "DOWNTREND" );
GfxSetTextColor( colorGreen );
GfxTextOut( "SWING = " + SWING, textoffset + 1, 256 );
GfxSelectFont( "Arial", 8 );
shape = Buy * shapeCircle + Sell * shapeCircle;
//PlotShapes( shape, IIf( Buy, colorGreen, colorOrange ), 0, IIf( Buy, Low-f, High+f));
_SECTION_END();
_SECTION_BEGIN( "Intraday MA Oprekan Isfandi" );
Periods = Param( "Periods", 15, 2, 200, 1, 10 );
CG = MA( C, Periods );
Plot( CG, "MA", IIf( CG <= Low, ParamColor( "Color_U", colorRed ), ParamColor( "Color_D", colorOrange ) ), styleThick = 13 );
amv0 = Volume * ( O + C ) / 2;
Life_line = Sum( amv0, 88 ) / Sum( Volume, 88 );
Plot( Life_line, "Life_line", ParamColor( "Color", colorBlack ), ParamStyle( "Style" ) );
FL = HHV( CG, 2 );
support = HHV( CG, 2 );
FS = CG - ( FL - CG );
Plot( support, "support_line", colorRed, styleThick = 12 );
Plot( FS, "", colorDarkGreen, styleThick = 12 );
_SECTION_END();
_SECTION_BEGIN
( "BW Fractal" );
CondUpFractal =
(
Ref( H, -2 ) < H AND Ref( H, -1 ) < H AND Ref( H, 1 ) < H AND Ref( H, 2 ) < H ) OR
(
Ref( H, -3 ) < H AND Ref( H, -2 ) < H AND Ref( H, -1 ) == H AND Ref( H, 1 ) < H AND Ref( H, 2 ) < H ) OR
(
Ref( H, -4 ) < H AND Ref( H, -3 ) < H AND Ref( H, -2 ) == H AND Ref( H, -1 ) == H AND Ref( H, 1 ) < H AND Ref( H, 2 ) < H ) OR
(
Ref( H, -4 ) < H AND Ref( H, -3 ) < H AND Ref( H, -2 ) == H AND Ref( H, -1 ) == H AND Ref( H, 1 ) < H AND Ref( H, 2 ) < H ) OR
(
Ref( H, -6 ) < H AND Ref( H, -5 ) < H AND Ref( H, -4 ) == H AND Ref( H, -3 ) < H AND Ref( H, -2 ) == H AND Ref( H, -1 ) < H AND Ref( H, 1 ) < H AND Ref( H, 2 ) < H );
UpFractal =
ValueWhen( CondUpFractal, H, 1 );
PlotShapes
( CondUpFractal*shapeHollowSmallCircle, colorYellow, Layer = 0, UpFractal, Offset = 0 );
CondDownFractal =
(
Ref( L, -2 ) > L AND Ref( L, -1 ) > L AND Ref( L, 1 ) > L AND Ref( L, 2 ) > L ) OR
(
Ref( L, -3 ) > L AND Ref( L, -2 ) > L AND Ref( L, -1 ) == L AND Ref( L, 1 ) > L AND Ref( L, 2 ) > L ) OR
(
Ref( L, -4 ) > L AND Ref( L, -3 ) > L AND Ref( L, -2 ) == L AND Ref( L, -1 ) == L AND Ref( L, 1 ) > L AND Ref( L, 2 ) > L ) OR
(
Ref( L, -4 ) > L AND Ref( L, -3 ) > L AND Ref( L, -2 ) == L AND Ref( L, -1 ) == L AND Ref( L, 1 ) > L AND Ref( L, 2 ) > L ) OR
(
Ref( L, -6 ) > L AND Ref( L, -5 ) > L AND Ref( L, -4 ) == L AND Ref( L, -3 ) > L AND Ref( L, -2 ) == L AND Ref( L, -1 ) > L AND Ref( L, 1 ) > L AND Ref( L, 2 ) > L );
DownFractal =
ValueWhen( CondDownFractal, L, 1 );
PlotShapes
( CondDownFractal*shapeHollowSmallCircle, colorYellow, Layer = 0, DownFractal, Offset = 0 );
PlotShapes
( Cross( C, UpFractal )*shapeUpArrow, colorRed, Layer = 0, L );
PlotShapes
( Cross( DownFractal, C )*shapeDownArrow, colorBlue, Layer = 0, H );
Plot
( Ref( UpFractal, 2 ), "Up Fractal", ParamColor( "Up Fractal Color", colorRed ),
ParamStyle
( "Up Fractal Style", styleDashed ) );
Plot
( Ref( DownFractal, 2 ), "Down Fractal", ParamColor( "Down Fractal Color", colorBlue ), ParamStyle( "Down Fractal Style", styleDashed ) );
Plot( Max( HHV( H, 3 ), Ref( UpFractal, 2 ) ), "Up Fractal", ParamColor( "Up Fractal Color", colorRed ), ParamStyle( "Up Fractal Style", styleDashed ) );
Plot( Max( HHV( H, 3 ), Ref( UpFractal, 2 ) ), "Down Fractal", ParamColor( "Down Fractal Color", colorBlue ), ParamStyle( "Down Fractal Style", styleDashed ) );
_SECTION_END
();
GraphZOrder = 1;
_SECTION_BEGIN( "Chart Settings" );
p_color_bkgnd = ParamColor( "Background color", colorLightGrey );
// for intraday, you probably don't want log... set default to be linear
p_logscale = ParamToggle( "Axis type (control with this)", "Linear|Logarithmic", 0 );
p_Colorbars = ParamToggle( "Price display color?", "Mono|Color", 0 );
p_PriceColor = ParamColor( "Price mono color", colorWhite );
p_PriceStyle = ParamStyle( "Price Style", styleThick );
SetChartBkColor( p_color_bkgnd );
StaticVarSet( "L_color_bkgnd", p_color_bkgnd );
L_color_mono = p_PriceColor;
// change this later
if ( IsNull( StaticVarGet( "L_color_bkgnd" ) ) )
{
L_color_bkgnd = p_color_bkgnd;
}
else
{
L_color_bkgnd = StaticVarGet( "L_color_bkgnd" );
}
// We need to know whether we are log scale or not
// so set it ourselves then change the toggle the chart for log/linear and
// use the it for trendline calculations etc.
// If we had used the log/linear parameter on the "Axis and Grid menu"
// then we have to remember to change the log/linear calculation.
SetChartOptions( 0, chartShowArrows | chartShowDates );
if ( p_logscale == 1 )
{
SetChartOptions( 2, chartLogarithmic, chartGridMiddle | chartGridMargins );
}
else
{
SetChartOptions( 3, chartLogarithmic, !( chartGridMiddle | chartGridMargins ) );
}
Visiblebars = Status( "barvisible" );
_N( Title = StrFormat( "{{NAME}} - {{INTERVAL}} {{DATE}} Open %g, Hi %g, Lo %g, Close %g (%.1f%%) Vol " +
WriteVal( V, 1.0 ) + "\n{{VALUES}}",
O, H, L, C, SelectedValue( ROC( C, 1 ) ) ) );
// Start of variables used to control color of bars/indicators
BullishBar = H > Ref( H, -1 ) AND L > Ref( L, -1 );
BearishBar = H < Ref( H, -1 ) AND L < Ref( L, -1 );
if ( p_Colorbars == 1 )
{
PriceColor = IIf( BullishBar, colorLime, IIf( BearishBar, colorRed, colorBlue ) );
}
else
{
PriceColor = L_color_mono;
}
_SECTION_END();
// for pricefield and set initial scaling
Plot( C, "", PriceColor, styleNoTitle | p_PriceStyle | GetPriceStyle() );
//================================================== ==================================
_SECTION_BEGIN( "Volume Price Analysis - V.1.2" );
SetChartOptions( 0, chartShowArrows | chartShowDates );
//================================================== =====================================
DTL = Param( "Linear regression period", 60, 10, 100, 10 );
wbf = Param( "WRB factor", 1.5, 1.3, 2.5, .1 );
nbf = Param( "NRB factor", 0.7, 0.3, 0.9, 0.1 );
TL = LinRegSlope( MA( C, DTL ), 2 );
Vlp = Param( "Volume lookback period", 30, 20, 300, 10 );
Vrg = MA( V, Vlp );
St = StDev( Vrg, Vlp );
Vp3 = Vrg + 3 * st;
Vp2 = Vrg + 2 * st;;
Vp1 = Vrg + 1 * st;;
Vn1 = Vrg - 1 * st;
Vn2 = Vrg - 2 * st;
rg = ( H - L );
arg = Wilders( rg, 30 );
wrb = rg > ( wbf * arg );
nrb = rg < ( nbf * arg );
Vl = V < Ref( V, -1 ) AND V < Ref( V, -2 );
upbar = C > Ref( C, -1 );
dnbar = C < Ref( C, -1 );
Vh = V > Ref( V, -1 ) AND Ref( V, -1 ) > Ref( V, -2 );
Cloc = C - L;
x = rg / Cloc;
x1 = IIf( Cloc == 0, arg, x );
Vb = V > Vrg OR V > Ref( V, -1 );
ucls = x1 < 2;
dcls = x1 > 2;
mcls = x1<2.2 AND x1>1.8 ;
Vlcls = x1 > 4;
Vhcls = x1 < 1.35;
j = MA( C, 5 );
TLL = LinRegSlope( j, 40 ) ;
Tlm = LinRegSlope( j, 15 ) ;
tls = LinRegSlope( j, 5 );
mp = ( H + L ) / 2;
_SECTION_END();
//================================================== ========================================
_SECTION_BEGIN( "VSA" );
utbar = wrb AND dcls AND tls > 0 ;
utcond1 = Ref( utbar, -1 ) AND dnbar ;
utcond2 = Ref( utbar, -1 ) AND dnbar AND V > Ref( V, -1 );
utcond3 = utbar AND V > 2 * Vrg;
trbar = Ref( V, -1 ) > Vrg AND Ref( upbar, -1 ) AND Ref( wrb, -1 ) AND dnbar AND dcls AND wrb AND tll > 0 AND H == HHV( H, 10 );
Hutbar = Ref( upbar, -1 ) AND Ref( V, -1 ) > 1.5 * Vrg AND dnbar AND dcls AND NOT wrb AND NOT utbar;
Hutcond = Ref( Hutbar, -1 ) AND dnbar AND dcls AND NOT utbar;
tcbar = Ref( upbar, -1 ) AND H == HHV( H, 5 )AND dnbar AND ( dcls OR mcls ) AND V > vrg AND NOT wrb AND NOT Hutbar ;
Scond1 = ( utcond1 OR utcond2 OR utcond3 ) ;
Scond2 = Ref( scond1, -1 ) == 0;
scond = scond1 AND scond2;
stdn0 = tll<0 AND V>Ref( V, -1 ) AND Ref( dnbar, -1 ) AND upbar AND ( ucls OR mcls ) AND tls < 0 AND tlm < 0;
stdn = V > Ref( V, -1 ) AND Ref( dnbar, -1 ) AND upbar AND ( ucls OR mcls ) AND tls < 0 AND tlm < 0;
stdn1 = tll<0 AND V>( vrg * 1.5 ) AND Ref( dnbar, -1 ) AND upbar AND ( ucls OR mcls )AND tls < 0 AND tlm < 0;
stdn2 = tls < 0 AND Ref( V, -1 )<Vrg AND upbar AND vhcls AND V>Vrg;
bycond1 = stdn OR stdn1;
bycond = upbar AND Ref( bycond1, -1 );
stvol = L == LLV( L, 5 ) AND ( ucls OR mcls ) AND V > 1.5 * Vrg AND tll < 0;
ndbar = upbar AND nrb AND Vl AND dcls ;
nsbar = dnbar AND nrb AND Vl AND dcls ;
nbbar = C > Ref( C, -1 ) AND Vl AND nrb AND x1 < 2;
nbbar = IIf( C > Ref( C, -1 ) AND V < Ref( V, -1 ) AND V < Ref( V, -2 ) AND x1 < 1.1, 1, 0 );
lvtbar = vl AND L < Ref( L, -1 ) AND ucls;
lvtbar1 = V < Vrg AND L < Ref( L, -1 ) AND ucls AND tll > 0 AND tlm > 0 AND wrb;
lvtbar2 = Ref( Lvtbar, -1 ) AND upbar AND ucls;
dbar = V > 2 * Vrg AND dcls AND upbar AND tls > 0 AND tlm > 0 AND NOT Scond1 AND NOT utbar;
eftup = H > Ref( H, -1 ) AND L > Ref( L, -1 ) AND C > Ref( C, -1 ) AND C >= ( ( H - L ) * 0.7 + L ) AND rg > arg AND V > Ref( V, -1 );
eftupfl = Ref( eftup, -1 ) AND ( utbar OR utcond1 OR utcond2 OR utcond3 );
eftdn = H < Ref( H, -1 ) AND L < Ref( L, -1 ) AND C < Ref( C, -1 ) AND C <= ( ( H - L ) * 0.25 + L ) AND rg > arg AND V > Ref( V, -1 );
_SECTION_END();
_SECTION_BEGIN( "Commentary" );
Vpc = utbar OR utcond1 OR utcond2 OR utcond3 OR stdn0 OR stdn1 OR stdn2 OR stdn OR lvtbar1 OR Lvtbar OR Lvtbar2 OR Hutbar OR Hutcond OR ndbar OR stvol OR tcbar;
if ( Status( "action" ) == actionCommentary )
(
printf ( "=========================" + "\n" ) );
printf ( "VOLUME PRICE ANALYSIS" + "\n" );
printf ( "" + "\n" );
printf ( "=========================" + "\n" );
printf ( Name() + " - " + Interval( 2 ) + " - " + Date() + " - " + "\n" + "High-" + H + "\n" + "Low-" + L + "\n" + "Open-" + O + "\n" +
"Close-" + C + "\n" + "Volume= " + WriteVal( V ) + "\n" );
WriteIf( Vpc, "=======================", "" );
WriteIf( Vpc, "VOLUME ANALYSIS COMMENTARY:\n", "" );
WriteIf( utbar , "Up-thrusts are designed to catch stops and to mislead as many traders as possible.
They are normally seen after there has been weakness in the background. The market makers know that the
market is weak, so the price is marked up to catch stops, encourage traders to go long in a weak market,
AND panic traders that are already Short into covering their very good position.", "" ) +
WriteIf( utcond3, "This upthrust bar is at high volume.This is a sure sign of weakness. One may even seriously
consider ending the Longs AND be ready to reverse", "" ) + WriteIf( utbar OR utcond3, " Also note that A wide spread
down-bar that appears immediately after any up-thrust, tends to confirm the weakness (the market makers are
locking in traders into poor positions).
With the appearance of an upthrust you should
certainly be paying attention to your trade AND your stops. On many upthrusts you will find that the market will
'test' almost immediately.", "" ) + WriteIf( utcond1 , "A wide spread down bar following a Upthrust Bar.
This confirms weakness. The Smart Money is locking in Traders into poor positions", "" );
WriteIf( utcond2 , "Also here the volume is high( Above Average).This is a sure sign of weakness. The Smart Money is
locking in Traders into poor positions", "" ) + WriteIf( stdn, "Strength Bar. The stock has been in a down Trend. An upbar
with higher Volume closing near the High is a sign of strength returning. The downtrend is likely to reverse soon. ", "" ) +
WriteIf( stdn1, "Here the volume is very much above average. This makes this indication more stronger. ", "" ) +
WriteIf( bycond, "The previous bar saw strength coming back. This upbar confirms strength. ", "" ) +
WriteIf( Hutbar, " A pseudo Upthrust. This normally appears after an Up Bar with above average volume. This looks like an upthrust bar
closing down near the Low. But the Volume is normally Lower than average. this is a sign of weakness.If the Volume is High then weakness
increases. Smart Money is trying to trap the retailers into bad position. ", "" ) +
WriteIf( Hutcond, "A downbar after a pseudo Upthrust Confirms weakness. If the volume is above average the weakness is increased. ", "" ) +
WriteIf( Lvtbar2, "The previous bar was a successful Test of supply. The current bar is a upbar with higher volume. This confirms strength", "" ) +
WriteIf( dbar, "A wide range, high volume bar in a up trend closing down is an indication the Distribution is in progress. The smart money
is Selling the stock to the late Comers rushing to Buy the stock NOT to be Left Out Of a Bullish move. ", "" ) +
WriteIf( Lvtbar2, "The previous bar was a successful Test of supply. The current bar is a upbar with higher volume. This confirms strength", "" ) +
WriteIf( tcbar, "The stock has been moving up on high volume. The current bar is a Downbar with high volume. Indicates weakness and probably end of the up move", "" ) +
WriteIf( eftup, "Effort to Rise bar. This normally found in the beginning of a Markup Phase and is bullish sign.These may be found at the top of an Upmove as the Smart money makes a
last effort to move the price to the maximum", "" ) +
WriteIf( eftdn, "Effort to Fall bar. This normally found in the beginning of a Markdown phase.", "" ) +
WriteIf( nsbar, "No Supply. A no supply bar indicates supply has been removed and the Smart money can markup the price. It is better to wait for confirmation", "" ) +
WriteIf( stvol, "Stopping Volume. This will be an downbar during a bearish period closing towards the Top accompanied by High volume.
A stopping Volume normally indicates that smart money is absorbing the supply which is a Indication that they are Bullishon the MArket.
Hence we Can expect a reversal in the down trend. ", "" ) +
WriteIf( ndbar, "No Demand
Brief Description:
Any up bar which closes in the middle OR Low, especially if the Volume has fallen off,
is a potential sign of weakness.
Things to Look Out for:
if the market is still strong, you will normally see signs of strength in the next few bars,
which will most probably show itself as a:
* Down bar with a narrow spread, closing in the middle OR High.
* Down bar on Low Volume.", "" );
_SECTION_END();
//================================================== ================================================== ================================================== ================================
//TITLE
_SECTION_BEGIN( "Title" );
if ( Status( "action" ) == actionIndicator )
(
Title = EncodeColor( colorWhite ) + "Volume Price Analysis" + " - " + Name() + " - " + EncodeColor( colorRed ) + Interval( 2 ) + EncodeColor( colorWhite ) +
" - " + Date() + " - " + EncodeColor( colorLime ) + "Volume= " + WriteVal( V ) + "--" + EncodeColor( colorYellow ) + "\n" +
WriteIf ( utbar, " An Upthrust Bar. A sign of weakness. ", "" ) +
WriteIf ( utcond1, " A downbar after an Upthrust. Confirm weakness. ", "" ) +
WriteIf ( utcond2 AND NOT utcond1, " A High Volume downbar after an Upthrust. Confirm weakness.", "" ) +
WriteIf ( utcond3, "This upthrust at very High Voume, Confirms weakness", "" ) +
WriteIf ( stdn1, "Strength seen returning after a down trend. High volume adds to strength. ", "" ) +
WriteIf ( stdn0 AND NOT stdn, "Strength seen returning after a down trend. ", "" ) +
WriteIf ( stdn AND NOT stdn1, "Strength seen returning after a long down trend. ", "" ) +
WriteIf ( Lvtbar, "Test for supply. ", "" ) +
WriteIf ( Lvtbar2, "An Upbar closing near High after a Test confirms strength. ", "" ) +
WriteIf ( bycond, "An Upbar closing near High. Confirms return of Strength. ", "" ) +
WriteIf ( dbar, "A High Volume Up Bar closing down in a uptrend shows Distribution. ", "" ) +
WriteIf ( Hutbar, "Psuedo UpThrust. A Sign of Weakness. ", "" ) +
WriteIf ( Hutcond, "A Down Bar closing down after a Pseudo Upthrust confirms weakness. ", "" ) +
WriteIf ( Lvtbar1, "Test for supply in a uptrend. Sign of Strength. ", "" ) +
WriteIf ( stdn2, "High volume upbar closing on the high indicates strength. ", "" ) +
WriteIf ( Tcbar, "High volume Downbar after an upmove on high volume indicates weakness. ", "" ) +
WriteIf ( ndbar, "No Demand. A sign of Weakness. ", "" ) +
WriteIf ( nsbar, "No Supply. A sign of Strength. ", "" ) +
WriteIf ( eftup, "Effort to Rise. Bullish sign ", "" ) +
WriteIf ( eftdn, "Effort to Fall. Bearish sign ", "" ) +
WriteIf ( eftupfl, "Effort to Move up has failed. Bearish sign ", "" ) +
WriteIf ( stvol, "Stopping volume. Normally indicates end of bearishness is nearing. ", "" ) +
( "\n Volume: " ) + WriteIf( V > Vp2, EncodeColor( colorLime ) + "Very High", WriteIf( V > Vp1, EncodeColor( colorLime ) + " High", WriteIf( V > Vrg, EncodeColor( colorLime ) + "Above Average",
WriteIf( V<Vrg AND V>Vn1, EncodeColor( colorRed ) + "Less than Average", WriteIf( V < Vn1, "Low", "" ) ) ) ) ) +
( EncodeColor( colorYellow ) + " Spread: " ) + WriteIf( rg > ( arg * 2 ), EncodeColor( colorLime ) + " Wide", WriteIf( rg > arg, EncodeColor( colorLime ) + " Above Average", EncodeColor( colorRed ) + " Narrow" ) ) +
( EncodeColor( colorYellow ) + " Close: " ) + WriteIf( Vhcls, EncodeColor( colorLime ) + "Very High", WriteIf( ucls, EncodeColor( colorLime ) + "High", WriteIf( mcls, EncodeColor( colorYellow ) + "Mid",
WriteIf( dcls, EncodeColor( colorRed ) + "Down", "Very Low" ) ) ) ) +
( "\n Trend: " ) + WriteIf( tls > 0, EncodeColor( colorLime ) + " Short Term-UP", EncodeColor( colorRed ) + " Short Term-Down" ) +
WriteIf( tlm > 0, EncodeColor( colorLime ) + " MID Term-UP", EncodeColor( colorRed ) + " Mid Term-Down" ) +
WriteIf( tll > 0, EncodeColor( colorLime ) + " Long Term-Up", EncodeColor( colorRed ) + " Long term-Down" ) );
_SECTION_END();
}
if ( PEAK_VALLEY == 1 )
{
_SECTION_BEGIN( "PEAK_VALLEY" );
// E.M.Pottasch 09/06/10
nbar = Param( "nbar", 2, 1, 5, 1 );
PHigh = H > Ref( HHV( H, nbar ), -1 ) AND Ref( HHV( H, nbar ), nbar ) < H;
PHighPrice0 = ValueWhen( PHigh, H );
PHighPrice1 = IIf( PHighPrice0 AND BarsSince( PHigh ) > nbar, PHighPrice0, Null );
PHighPrice2 = IIf( PHighPrice0 AND BarsSince( PHigh ) <= nbar, PHighPrice0, Null );
PLow = L < Ref( LLV( L, nbar ), -1 ) AND Ref( LLV( L, nbar ), nbar ) > L;
PLowPrice0 = ValueWhen( PLow, L );
PLowPrice1 = IIf( PLowPrice0 AND BarsSince( Plow ) > nbar, PLowPrice0, Null );
PLowPrice2 = IIf( PLowPrice0 AND BarsSince( Plow ) <= nbar, PLowPrice0, Null );
GraphXSpace = 5;
SetChartOptions( 0, chartShowDates );
Plot( C, "\nLast", colorWhite, styleCandle );
Plot( PHighPrice1, "\nPHighPrice", colorOrange, styleThick );
Plot( PHighPrice2, "", colorOrange, styleDots | styleNoLine );
Plot( PLowPrice1, "\nPLowPrice", colorBrightGreen, styleThick );
Plot( PLowPrice2, "", colorBrightGreen, styleDots | styleNoLine );
Buy = H > PHighPrice0;
Sell = L < PLowPrice0;
Buy = ExRem( Buy, Sell );
Sell = ExRem( Sell, Buy );
PlotShapes( IIf( Buy , shapeSmallUpTriangle, shapeNone ) , colorGreen, 0, L, -30 );
PlotShapes( IIf( Sell, shapeSmallDownTriangle, shapeNone ) , colorOrange, 0, H, -25 );
_SECTION_END();
}
if ( FLOWER == 1 )
{
_SECTION_BEGIN( "Flower" );
Title = StrFormat( "\\c02 {{NAME}} | {{DATE}} | Open : %g | High : %g | Low : %g | Close : %g | Change = %.1f%% | Volume = " + WriteVal( V, 1.0 ) + " {{VALUES}}", O, H, L, C, SelectedValue( ROC( C, 1 ) ) );
_SECTION_END();
_SECTION_BEGIN( "Sup/Res Detail" );
SupResPeriod = Param( "LookBack Period", 50, 0, 200, 1 );
SupResPercentage = Param( "Percentage", 100, 0, 200, 1 );
PricePeriod = Param( "Price Period", 16, 0, 200, 1 );
SupportLinecolor = ParamColor( "Support Color", colorGreen );
SupportLinestyle = ParamStyle( "Support Style", styleThick | 8 | styleNoLabel );
ResistanceLinecolor = ParamColor( "Resistance Color", colorRed );
Resistancestyle = ParamStyle( "Resistance Style", styleThick | 8 | styleNoLabel );
_SECTION_END();
_SECTION_BEGIN( "Line Detail" );
OverBought = Param( "OverBought Above", 200, 0, 400, 1 );
OverSold = Param( "OverSold Bellow", -200, -400, 0, 1 );
_SECTION_END();
_SECTION_BEGIN( "Trend Bought/Sold Detail" );
Smoother = Param( "Trend Smoother", 5, 5, 20 );
upcolor = ParamColor( "UpTrend Color", colorGreen );
Downcolor = ParamColor( "DownTrend Color", colorRed );
_SECTION_END();
_SECTION_BEGIN( "Circle Detail" );
Warningcolor = ParamColor( "Warning/Watch Signal", colorBlue );
WatchColor = ParamColor( "Accumulation Zone", colorWhite );
EntryColor = ParamColor( "Entry Signal", colorAqua );
ProfitTakeColor = ParamColor( "Distribution Zone", colorYellow );
ExitColor = ParamColor( "Exit Signal", colorRed );
_SECTION_END();
_SECTION_BEGIN( "Swing Sup/Res" );
Lookback = SupResPeriod;
PerCent = SupResPercentage;
Pds = PricePeriod;
Var = MACD();
Up = IIf( Var > Ref( Var, -1 ), abs( Var - Ref( Var, -1 ) ), 0 );
Dn = IIf( Var < Ref( Var, -1 ), abs( Var - Ref( Var, -1 ) ), 0 );
Ut = Wilders( Up, Pds );
Dt = Wilders( Dn, Pds );
RSIt = 100 * ( Ut / ( Ut + Dt ) );
A1 = RSIt;
B2 = RSI( pds );
C3 = CCI( pds );
D4 = StochK( pds );
E5 = StochD( pds );
F6 = MFI( pds );
G7 = Ultimate( pds );
H8 = ROC( C, pds );
Osc = C3;
Value1 = Osc;
Value2 = HHV( Value1, Lookback );
Value3 = LLV( Value1, Lookback );
Value4 = Value2 - Value3;
Value5 = Value4 * ( PerCent / 100 );
ResistanceLine = Value3 + Value5;
SupportLine = Value2 - Value5;
baseline = IIf( Osc < 100 AND Osc > 10 , 50 , IIf( Osc < 0 , 0, 0 ) );
Plot( ResistanceLine, "", SupportLinecolor, SupportLinestyle );
Plot( SupportLine, "", ResistanceLinecolor, Resistancestyle );
_SECTION_END();
_SECTION_BEGIN( "Entry/Exit Detail" );
n = Smoother;
ys1 = ( High + Low + Close * 2 ) / 4;
rk3 = EMA( ys1, n );
rk4 = StDev( ys1, n );
rk5 = ( ys1 - rk3 ) * 200 / rk4;
rk6 = EMA( rk5, n );
UP = EMA( rk6, n );
DOWN = EMA( up, n );
Oo = IIf( up < down, up, down );
Hh = Oo;
Ll = IIf( up < down, down, up );
Cc = Ll;
barcolor2 = IIf( Ref( oo, -1 ) < Oo AND Cc < Ref( Cc, -1 ), upcolor, IIf( up > down, upcolor, downcolor ) );
PlotOHLC( Oo, hh, ll, Cc, "Matrix - Accumulation or Bought/Distribution or Sold", barcolor2, styleCandle );
Buy = Cross( up, OverSold );
Sell = Cross( OverBought, up );
PlotShapes ( IIf( Buy, shapeSmallCircle, shapeNone ) , EntryColor, layer = 0, yposition = -220, offset = 1 );
PlotShapes ( IIf( Sell, shapeSmallCircle, shapeNone ) , ExitColor, layer = 0, yposition = 220, offset = 1 );
_SECTION_END();
_SECTION_BEGIN( "Overbought/Oversold/Warning Detail" );
n = Smoother;
ys1 = ( High + Low + Close * 2 ) / 4;
rk3 = EMA( ys1, n );
rk4 = StDev( ys1, n );
rk5 = ( ys1 - rk3 ) * 210 / rk4;
rk6 = EMA( rk5, n );
UP = EMA( rk6, n );
DOWN = EMA( up, n );
Oo = IIf( up < down, up, down );
Hh = Oo;
Ll = IIf( up < down, down, up );
Cc = Ll;
barcolor2 = IIf( Ref( oo, -1 ) < Oo AND Cc < Ref( Cc, -1 ), colorGreen, IIf( up > down, colorGreen, colorRed ) );
PlotOHLC( Oo, hh, ll, Cc, "", barcolor2, styleCandle | stylehidden );
UP = EMA( rk6, n );
UPshape = IIf( UP >= OverBought OR UP <= OverSold, shapeHollowSmallCircle, shapeNone );
UPColor = IIf( UP >= 210, ProfitTakeColor, IIf( UP <= -210, WatchColor, Warningcolor ) );
Plot( UP, "", colorGrey50, styleThick | stylehidden );
PlotShapes( UPShape, UPColor, 0, UP, 0 );
_SECTION_END();
_SECTION_BEGIN( "Plot Lines" );
Plot( OverBought, "", colorDarkGrey, styleLine | styleNoLabel );
Plot( 0, "", colorDarkGrey, styleDashed | styleNoLabel );
Plot( OverSold, "", colorDarkGrey, styleLine | styleNoLabel );
_SECTION_END();
}
if ( AUTO_FIBO == 1 )
{
_SECTION_BEGIN( "AUTO_FIBO" );
//SetChartBkGradientFill( ParamColor("BgTop", colorLightGrey),ParamColor("BgBottom", colorLightYellow));
//_SECTION_BEGIN("Price");
SetChartOptions( 0, chartShowDates | chartShowArrows | chartLogarithmic | chartWrapTitle );
_N( Title = StrFormat( "{{NAME}} - {{INTERVAL}} {{DATE}} Open %g, Hi %g, Lo %g, Close %g (%.1f%%) {{VALUES}}", O, H, L, C, SelectedValue( ROC( C, 1 ) ) ) );
Plot( C, "Close", ParamColor( "Color", colorWhite ), styleNoTitle | ParamStyle( "Style" ) | GetPriceStyle() );
if ( ParamToggle( "Tooltip shows", "All Values|Only Prices" ) )
{
ToolTip = StrFormat( "Open: %g\nHigh: %g\nLow: %g\nClose: %g (%.1f%%)\nVolume: " + NumToStr( V, 1 ), O, H, L, C, SelectedValue( ROC( C, 1 ) ) );
};
//Plot( C, "", IIf(Close > Open, colorGreen, colorRed), styleCandle + styleNoLabel);
_SECTION_END();
_SECTION_BEGIN( "Moving Average" );
x = Param( "EMA 1", 20, 1, 200, 1 );
y = Param( "EMA 2", 50, 1, 200, 1 );
z = Param( "EMA 3", 100, 1, 200, 1 );
zz = Param( "EMA 4", 200, 1, 200, 1 );
EMA20 = EMA( C, x );
EMA50 = EMA( C, y );
EMA100 = EMA( C, z );
EMA200 = EMA( C, zz );
Plot ( EMA ( C, x ), "EMA 20", ParamColor( "EMA20", colorRed ), styleDots + styleThick + styleNoLine + styleNoLabel, maskAll );
Plot ( EMA ( C, y ), "EMA 50", ParamColor( "EMA50", colorBlue ), styleDots + styleThick + styleNoLine + styleNoLabel, maskAll );
Plot ( EMA ( C, z ), "EMA 100", ParamColor( "EMA100", colorGold ), styleDots + styleThick + styleNoLine + styleNoLabel, maskAll );
Plot ( EMA ( C, zz ), "EMA 200", ParamColor( "EMA200", colorDarkGrey ), styleDots + styleThick + styleNoLine + styleNoLabel, maskAll );
SUT = EMA( C, 5 ) > EMA20;
SDT = EMA20 > EMA( C, 5 );
mut = EMA20 > EMA50;
mdt = EMA20 < EMA50;
_SECTION_END();
_SECTION_BEGIN( "Mid Term Price Trend" );
MPT = IIf( mut, colorGreen, IIf( mdt, colorRed, colorYellow ) );
Plot( 3, "", MPT, styleArea | styleOwnScale | styleNoLabel, 0, 100 );
_SECTION_END();
_SECTION_BEGIN( "Short Term Price Trend" );
SPT = IIf( EMA( C, 5 ) > EMA20, colorBrightGreen, IIf( EMA20 > EMA( C, 5 ), colorPink, colorYellow ) );
Plot( 6, "", SPT, styleArea | styleOwnScale | styleNoLabel, 0, 100 );
_SECTION_END();
//StochRSI Signal
R = 14;
S = 14;
Value1 = RSI( R );
SR = 100 * ( Value1 - LLV( Value1, S ) ) / ( HHV( Value1, S ) - LLV( Value1, S ) );
SR1 = Ref( SR, -1 );
sup = ( SR1 < 20 AND SR >= 20 AND sr < 80 ) AND SUT;
sdown = ( SR1 > 80 AND SR <= 80 AND sr > 20 ) AND SDT;
mup = ( SR1 < 20 AND SR >= 20 AND sr < 80 ) AND mut;
mdown = ( SR1 > 80 AND SR <= 80 AND sr > 20 ) AND mdt;
PlotShapes(
IIf( sup == 1, shapeUpArrow, shapeNone ),
colorSkyblue, 0, High, Offset = -35 );
PlotShapes(
IIf( sdown == 1, shapeDownArrow, shapeNone ),
colorPink, 0, High, Offset = -15 );
PlotShapes(
IIf( mup == 1, shapeUpArrow, shapeNone ),
colorGreen, 0, High, Offset = -45 );
PlotShapes(
IIf( mdown == 1, shapeDownArrow, shapeNone ),
colorRed, 0, High, Offset = -25 );
_SECTION_BEGIN( "Fib-R" );
// Get values for fib-R
StartBar = SelectedValue( BarIndex() );
FinishBar = EndValue( BarIndex() );
i = startbar;
period = FinishBar - StartBar;
Lo = LLV( L, period );
Hi = HHV( H, period );
Line0 = 0;
Line1 = 0;
Line2 = 0;
Line3 = 0;
Line4 = 0;
Line5 = 0;
Line100 = 0;
for ( i = startbar; i < finishbar; i++ )
{
if ( EndValue( C ) < SelectedValue( C ) )
{
Line0 = EndValue( Lo );
Line100 = EndValue( Hi );
Line1 = Line0 + abs( Line100 - Line0 ) * 0.236;
Line2 = Line0 + abs( Line100 - Line0 ) * 0.382;
Line3 = Line0 + abs( Line100 - Line0 ) * 0.5;
Line4 = Line0 + abs( Line100 - Line0 ) * 0.618;
Line5 = Line0 + abs( Line100 - Line0 ) * 0.768;
}
else
{
Line100 = EndValue( Lo );
Line0 = EndValue( Hi );
Line1 = Line0 - abs( Line100 - Line0 ) * 0.236;
Line2 = Line0 - abs( Line100 - Line0 ) * 0.382;
Line3 = Line0 - abs( Line100 - Line0 ) * 0.5;
Line4 = Line0 - abs( Line100 - Line0 ) * 0.618;
Line5 = Line0 - abs( Line100 - Line0 ) * 0.768;
}
}
// external fib lines begining fom selecetdbarindex()
fib0 = LineArray( startbar, Line0, finishbar, Line0, 0, 1 );
fib100 = LineArray( startbar, Line100, finishbar, Line100, 0, 1 );
// depth of middle lines
n = round( ( finishbar - startbar ) / 2 );
// middle lines
fib1 = LineArray( ( finishbar - n ), Line1, finishbar, Line1, 0, 1 );
fib2 = LineArray( ( finishbar - n ), Line2, finishbar, Line2, 0, 1 );
fib3 = LineArray( ( finishbar - n ), Line3, finishbar, Line3, 0, 1 );
fib4 = LineArray( ( finishbar - n ), Line4, finishbar, Line4, 0, 1 );
fib5 = LineArray( ( finishbar - n ), Line5, finishbar, Line5, 0, 1 );
Plot( fib0, "", colorBlack, styleNoLabel );
Plot( fib100, "", colorBlack, styleNoLabel );
//Plot(fib1,"23.6%", colorYellow+styleNoLine+styleDots);
Plot( fib2, "38.2%", ParamColor( "38.2% Color", colorGreen ), ParamStyle( "38.2% Style", styleLine + styleThick, maskAll ) );
Plot( fib3, "50%", ParamColor( "50% Color", colorGreen ), ParamStyle( "50% Style", styleLine + styleThick, maskAll ) );
Plot( fib4, "61.8%", ParamColor( "61.8% Color", colorAqua ), ParamStyle( "61.8% Style", styleThick + styleNoLine + styleDots, maskAll ) );
//Plot(fib5,"76.8%", colorGold,styleLine);
Title = Name() + " - " + FullName() + " - AUTO FIB-R " + " - RedLine = " + WriteVal( EMA20, 0.3 ) + " - BlueLine = " + WriteVal( EMA50, 0.3 ) + " - Yellowline = " + WriteVal( EMA100, 0.3 ) + " - BlackLine = " + WriteVal( EMA200, 0.3 );
_SECTION_END();
}
if ( NEED == 1 )
{
_SECTION_BEGIN( "NEED" );
_SECTION_BEGIN( "XAverage" );
Length = Param( "Length", 10, 1, 100, 1 );
AvgExp = AMA( C, 2 / ( Length + 1 ) );
ColMa = IIf( AvgExp > Ref( AvgExp, -3 ) , colorYellow, colorWhite );
Plot( AvgExp, "MA1", ColMa, styleThick, styleLine );
_SECTION_END();
_SECTION_BEGIN( "Heiken Ashi" );
Value1 = MA( C, 8 );
HaClose = ( O + H + L + C ) / 4;
HaOpen = AMA( Ref( HaClose, -1 ), 0.5 );
HaHigh = Max( H, Max( HaClose, HaOpen ) );
HaLow = Min( L, Min( HaClose, HaOpen ) );
xDiff = ( HaHigh - Halow ) * 10000;
SetBarFillColor( IIf( HaClose > HaOpen, colorBrightGreen, colorRed ) );
Cancolor = IIf( HaClose > Value1, colorBrightGreen, colorRed );
PlotOHLC( HaOpen, HaHigh, HaLow, HaClose, "", Cancolor, styleCandle );
_SECTION_END();
_SECTION_END();
}20 comments
Leave Comment
Please login here to leave a comment.
Back
Dear Admin ,
Its showing syntex error 30 . plz check at your end .
sorry
i forgot to mention this formula is based on juriklib.dll plugin
so plz get the plugin in ur amibroker/plugin folder
restart ur amibroker
n than apply this formula
it will definately work…….
the plugin n way to setup these can be found in this link
http://www.wisestocktrader.com/indicators/174-the-foundation-by-southwind-v-13-00-int
Dear Coder,
It is showing me Syntex error 30.I’ve downloaded the plug-ins & Includes from the site above.But not able to copy/paste in the Software.Would you please guide step-by-step?Thanks & Regards,
Mandar Datye.
sir
follow in this systematic manner -
1 download these codes n make it as an .afl extension from .txt
2 now go to this link
h t t p://www.4shared.com/file/GmOBEHXp/all_in_one.html(remove spaces in http)
and download jurilib.dll plus, all in one.afl n images
3 place juriklib.dll in directory drive(c: or d:or f: or any drive in which u installed ur amibroker)/amibroker/plugins
4 keep all in one.afl in directory drive(c: or d:or f: or any drive in which u installed ur amibroker)/amibroker/Formulas
5 now open the amibroker or if amibroker is already opened than restart it
6 go to charts columme n u will see all in one.afl there. click it.
7 now press ctrl+r for parameters n cick every indicators from hide to show n create the setup of indicators as u link
i have few snaps of setup of indicators here view it
h t t p://www.4shared.com/file/GmOBEHXp/all_in_one.html(remove spaces in http)
(included all in one.afl+juriklib.dll+images)
note – this indicator is tested n tried on 5.20 n above amibroker version
and as far i have tested it i would highlight that
this formula does not reference future quotes in layman terms "these codes doesnt changes direction or buy/sell signals as a new bar appears "
except ZIGZAG,SUPERTREND N SR since these are based on zig n form trendlines which can test by tool→codecheck or by bar reply in tool bar
Thanks a lot Ankit.
excellent job and nice idea
somebody need plugins pls visit : http://www.4shared.com/file/0eIUPRdZ/Plugins.html
Nice Work Brother
@ Ankit,
Once again thanks for your detail guidance.Now I’m able to see the parameters on the charts.But,would you please tell me the parameters for which,I should keep the option as Show.This is because,when I selected for all the options,the chart was totally clustered with all the parameters. Also ,I would like to know,even if,I select few parameters,then are arrows displayed based considering all the parameters? It would be of great help,If you can help me out in this matter.Thanks & Regards,
Mandar Datye.
9.Dick
Would it be possible for you to add “Exploration” to this excellent program?
Thanks
Dick Hoierman
email:areehoi@yahoo.com
@ mandar
every market has got its own dynamics n own way of trades thus this changes parametrs n show opions for many analyists
and being as an analyist the question for setting parameters n show options is can be answered by urself only by viewing that indicator visually on many charts u see
n i have given my options to show sets in parameters here in as images that i daily use
h t t p://www.4shared.com/file/GmOBEHXp/all_in_one.html(remove spaces in http)
but follow is few tips to make these charts good for u
1 luk for indicators that lag less (ie give indicatons of buy/sell soon )
2 luk that they dont overshoot on charts and dont make great noises on chart ie volatility changes must be less
3 try to do bar reply option in tools tab to see that they dont give false signals or take any future refernce
4 now set buy n sell and short n cover signals in code
4 when with above u get sattisfied that which options u wanna see on charts go for backtests n equity curve option later than optimize(go for exaustive optimizer(default one)) parameters to enhance profitability than seek for work forward testing
thus with these steps i am 80per sure u will get ur answers clean n solid with profits
thanks
ankit dargan
@hoierman
is have not attached the exploration as it would create a mess on charts n beside that it has many indicators n many people set dfferent combination
so to put exploration u just to put few line n enter that code which repesnts that formula n ur done ex like these
Filter = 1;
NumColumns = 4(can expand it to any number of colums u want);
Column0 = enter code u like; Column0Name = “desired name”; Column0Format = 1.0;
Column1 = enter code u like; Column1Name = “desired name”; Column1Format = 1.0;
Column2 = enter code u like; Column2Name = “desired name”; Column2Format = 1.0;
Column3 = enter code u like; Column3Name = “desired name”; Column3Format = 1.0;
thanks
ankit dargan
@ to all to found it intersting
plz due give votes to these codes if u found them really helpful
thank you
ankit dargan
Hi
I am using Amibroker 5.0 on Vista (Win7) and I am getting errors with this afl even after including the plugins. Please help.
Kaleem
@kaleem
well i use these codes on 5.34beta ami on vista n having no problem
plz make it sure u having placed juriklib.dll in plugin folder of that amibroker programm
or if still giving errors than try to update ur ami from amibroker site or alternatively u can also download 5.34beta from my folder-
h t t p://www.4shared.com/file/mR1Z31vw/ab5345beta_clean.html
and takes codes direct file from-
h t t p://www.4shared.com/file/GmOBEHXp/all_in_one.html
and if still error occurs in loading than plz post ur errors here i try to solve it
showing some sysntax error.please modify and place here. gangadhar
This one has two great trading system within – Flower ( I this it is great for swing trade after getting clear supply & demand indication ) & SILVER ( this is the one for trending MKT’s using GUPPY MA’s ).
Nice work Ankitji.
Thanks brother..
Excellent work
Is it possible to represent buy and sell signal in a table format for all the indicators used in “All in One” AFL? It should be in normal afl view mode i.e. not in auto analysis mode.
I mean, the “All in One” AFL should represent a table indicating buy/sell (instead of chart) for all the indicators used.
Syntax error, unexpected ‘}’. Is there semicolon missing at the end of the previous line ? (Ln: 1753, Col:1)
Sir,
This file is not available for download: juriklib.dll.
Help!
Thanking you,
Dr.Nagaraj
Mr.Ankit Dargan,
I followed every procedure you have advised, and the formula is now working excellently. Still, there are many things which I have to understand, of course it is a gradual process.
I could find the needed dll file with some difficulty. If any one needs it I am happy to share the details.
With regards,
Dr.Nagaraj