Stock Portfolio Organizer
The ultimate porfolio management solution.
Shares, Margin, CFD's, Futures and Forex
EOD and Realtime
Dividends and Trust Distributions
And Much More ....
WiseTrader Toolbox
#1 Selling Amibroker Plugin featuring:
Advanced Adaptive Indicators
Advanced Pattern Exploration
Neural Networks
And Much More ....
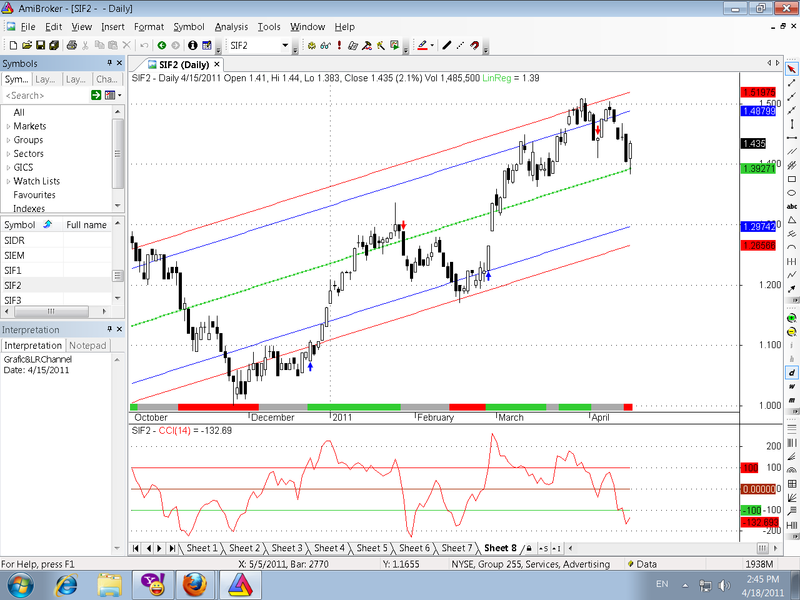
Grafic & Linear Regression Channel for Amibroker (AFL)
Rating:
3 / 5 (Votes 7)
Tags:
trading system, amibroker, support, resistance
With some improvements and buy/sell signals.
Screenshots
Similar Indicators / Formulas
FHB Advanced Trading System
Submitted
by vishyvishy about 14 years ago
Trading System by ISFANDI
Submitted
by sajid over 13 years ago
RAJASWAMY NIFTY CLINIC
Submitted
by rajaswamy almost 13 years ago
SUPPORT AND RESISTANCE WITH FIB
Submitted
by siva almost 14 years ago
Sharone System
Submitted
by panno over 13 years ago
Indicator / Formula
Copy & Paste Friendly
//CyberMan's Linear Regression Channel.

//Linear Regression Line with 2 Standard Deviation Channels Plotted Above and Below
//The original was written by Patrick Hargus, with critical hints from Marcin Gorzynski, Amibroker.com Technical Support
//Wysiwyg coded the angle in degrees part
//I modified the original Linear Regression code so that the line will change color based on the degree of the Linear Regression slope.
//I combine this with my trading system.
//When my system gives an entry signal I look at the Linear Regression Line and I will only take long positions
//if the Linear Regression line is green AND the entry price is below the LR line.
//When my system gives an entry signal I look at the Linear Regression Line and I will only take short positions
//if the Linear Regression line is red AND the entry price is above the LR line.
//It is usefull for filtering out lower probability trades.


//================================================Start Chart Configuration======================================================
SetChartOptions(0,chartShowArrows|chartShowDates);
_N(Title = StrFormat("{{NAME}} - {{INTERVAL}} {{DATE}} Open %g, Hi %g, Lo %g, Close %g (%.1f%%) Vol " +WriteVal( V, 1.0 ) +
           " {{VALUES}}", O, H, L, C, SelectedValue( ROC( C, 1 )) ));
//SetChartBkColor(colorBlack);

Plot( C, "", colorBlack, styleCandle, Zorder = 1);
SetChartOptions(0,chartShowArrows | chartShowDates);

//================================================End Chart Configuration========================================================


//====================================Start of Linear Regression Code============================================================

P = ParamField("Price field",-1);

Length = 150;

Daysback = Param("Period for Liner Regression Line",Length,1,240,1);
shift = Param("Look back period",0,0,240,1);

//=============================== Math Formula =================================================================================
x = Cum(1);
lastx = LastValue( x ) - shift;
aa = LastValue( Ref(LinRegIntercept( p, Daysback), -shift) );
bb = LastValue( Ref(LinRegSlope( p, Daysback ), -shift) );
y = Aa + bb * ( x - (Lastx - DaysBack +1 ) );

//==================Plot the Linear Regression Line ============================================================================

LRColor = ParamColor("LR Color", colorCycle );
LRStyle = ParamStyle("LR Style");

LRLine =  IIf( x > (lastx - Daysback) AND BarIndex() < Lastx, y, Null );

LRStyle = ParamStyle("LR Style");
Angle = Param("Angle", 0.05, 0, 1.5, 0.01);// A slope higher than 0.05 radians will turn green, less than -0.05 will turn red
                                           // AND anything in between will be white.

LRLine = IIf( x > (lastx - Daysback) AND BarIndex() < Lastx, y, Null );

Pi = 3.14159265 * atan(1); // Pi
SlopeAngle = atan(bb)*(180/Pi);

LineUp = SlopeAngle > Angle;
LineDn = SlopeAngle < - Angle;

if(LineUp)
{
//Plot(LRLine, "Lin. Reg. Line Up", IIf(LineUp, colorLime, colorWhite), LRStyle);
}
else
{
//Plot(LRLine, "Lin. Reg. Line Down", IIf(LineDn, colorRed, colorWhite), LRStyle);
}

//==========================  Plot 1st SD Channel =============================================================================

SDP = Param("Standard Deviation", 1.5, 0, 6, 0.1);
SD = SDP/2;

width = LastValue( Ref(SD*StDev(p, Daysback),-shift) ); //Set width of inside chanels here.
SDU = IIf( x > (lastx - Daysback) AND BarIndex() < Lastx, y+width , Null ) ;
SDL = IIf( x > (lastx - Daysback) AND BarIndex() < Lastx, y-width , Null ) ;

SDColor = ParamColor("SD Color", colorCycle );
SDStyle = ParamStyle("SD Style");

Plot( SDU , "", colorBlue,SDStyle ); //Inside Regression Lines
Plot( SDL , "", colorBlue,SDStyle ); //Inside Regression Lines

//==========================  Plot 2d SD Channel ===============================================================================

SDP2 = Param("2d Standard Deviation", 2.0, 0, 6, 0.1);
SD2 = SDP2/2;

width2 = LastValue( Ref(SD2*StDev(p, Daysback),-shift) ); //Set width of outside chanels here.
SDU2 = IIf( x > (lastx - Daysback) AND BarIndex() < Lastx, y+width2 , Null ) ;
SDL2 = IIf( x > (lastx - Daysback) AND BarIndex() < Lastx, y-width2 , Null ) ;

SDColor2 = ParamColor("2 SD Color", colorCycle );
SDStyle2 = ParamStyle("2 SD Style");

Plot( SDU2 , "", colorRed,SDStyle2 ); //OutSide Regression Lines
Plot( SDL2 , "", colorRed,SDStyle2 ); //OutSide Regression Lines

Trend = IIf(LRLine > Ref(LRLine,-1),colorLime,colorRed);//Changes LR line to green if sloping up and red if sloping down.

Plot( LRLine , "LinReg", Trend, styleDots );

//============================ End Indicator Code =======================================================================

//TRENDING RIBBON
// Paste the code below to your price chart somewhere and green ribbon means both
// both MACD and ADX trending up so if the red ribbon shows up the MACD and the ADX
// are both trending down.
_SECTION_BEGIN("trending ribbon");
uptrend=PDI()>MDI() AND MACD()>Signal();
downtrend=MDI()>PDI() AND Signal()>MACD();
Plot( 2, /* defines the height of the ribbon in percent of pane width */"",
IIf( uptrend, colorLime, IIf( downtrend, colorRed, 0 )), /* choose color */
styleOwnScale|styleArea|styleNoLabel, -0.5, 100 );
_SECTION_END();
//xxxxxxxxxxxxxxxxxxxxxxxxxxxxxxxxxxxxxxxxxxxxxxxxxxxxxxxxxxxxxxxxxxxxxxxxxxxxxxxxxxxxxxxxxxxxxxxxxxxxxxxxx

//FORMULE
P = ParamField("Price field",-1);
cuptop1= C>BBandTop(p,20,1) ;
bot1= BBandBot(p,20,1) ;
top2= BBandTop(p,20,2) ;
bot2= BBandBot(p,20,2) ;
stochup= StochK()>StochD() ;
MACDup= MACD()>Signal() ;
Hist= MACD()-Signal() ;
Histup= Hist>Ref(Hist,-1) ;
MFIupema5= MFI()>EMA(MFI(),5) ;
top1up= BBandTop(p,20,1)>Ref(BBandTop(p,20,1),-1) ;
band= BBandTop(p,20,2)-BBandBot(p,20,2) ;
Volatbuy= band>Ref(band,-1) ;
cupbot1= C>BBandBot(p,20,1) ;
bot1dn= BBandBot(p,20,1)<Ref(BBandBot(p,20,1),-1) ;
CCIup0= CCI()>0 ;
Cupma10= C>MA(C,10) ;
Cupma20= C>MA(C,20) ;
MA10up= MA(C,10)>Ref(MA(C,10),-1) ;
MA10upma20= MA(C,10)>MA(C,20) ;
MA20up= MA(C,20)>Ref(MA(C,20),-1) ;
Cupema50= C>EMA(C,50) ;
Vup= V>10000 AND C>O ;
trendup= LRLine>Ref(LRLine,-1) ;
Cdnlrl= C<LRLine ;
//xxxxxxxxxxxxxxxxxxxxxxxxxxxxxxxxxxxxxxxxxxxxxxxxxxxxxxxxxxxxxxxxxxxxxxxxxxxxxxxxxxxxxxxxxxxxxxxxxxxxxxx

myBuy   = Cross(PDI(),MDI()) AND MACD()>Signal() AND Hist>Ref(Hist,-1) AND LRLine>Ref(LRLine,-1) AND C<LRLine ;
myShort = Cross(0,CCI()) AND Signal()>MACD() ;

Buy = ExRem(myBuy, myShort);
Sell = ExRem(myShort, myBuy);

PlotShapes(IIf(Buy,shapeUpArrow,shapeNone),colorBlue,0,L,Offset=-10);
PlotShapes(IIf(Sell,shapeDownArrow,shapeNone),colorRed,0,H,Offset=-10);
//END OF xxxxxxxxxxxxxxxxxxxxxxxxxxxxxxxxxxxxxxxxxxxxxxxxxxxxxxxxxxxxxxxxxxxxxxxxxxxxxxxxxxxxxxxx
4 comments
Leave Comment
Please login here to leave a comment.
Back
No buy sell arrows coming in 5 min chart.
I think, it is for EOD investors only.
nice one
Very Nice.