Stock Portfolio Organizer
The ultimate porfolio management solution.
Shares, Margin, CFD's, Futures and Forex
EOD and Realtime
Dividends and Trust Distributions
And Much More ....
WiseTrader Toolbox
#1 Selling Amibroker Plugin featuring:
Advanced Adaptive Indicators
Advanced Pattern Exploration
Neural Networks
And Much More ....
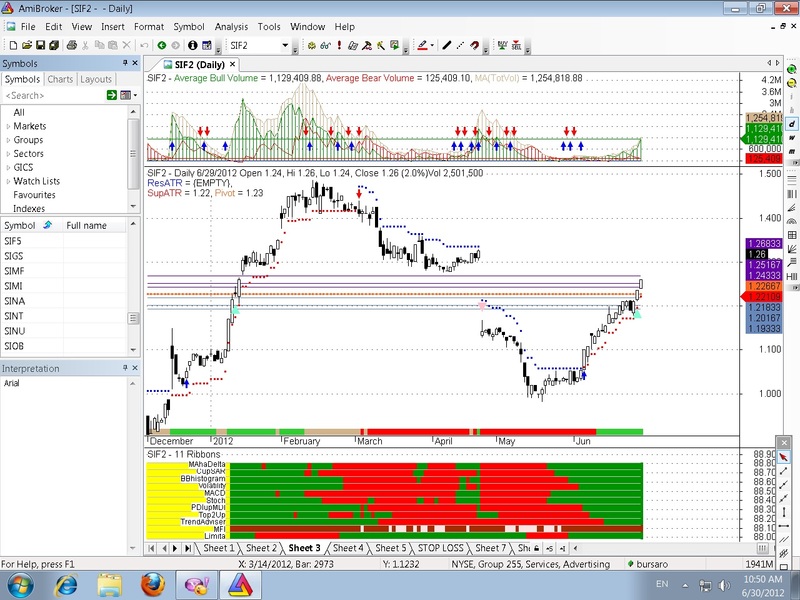
11 Ribbons for Amibroker (AFL)
Rating:
5 / 5 (Votes 2)
Tags:
amibroker, ribbon
My vision on k.raaja’s ribbons formula, with 11 indicators, in order to catch the trend.
Thank you, k.raaja!
Screenshots
Similar Indicators / Formulas
H-L Ribbon
Submitted
by halfman almost 13 years ago
VAR MA Ribbon
Submitted
by alliswell over 11 years ago
7 ribbons 3
Submitted
by k.raaja almost 14 years ago
Candle Ribbon
Submitted
by brevco about 14 years ago
ADX PDI MDI + ADX Ribbon
Submitted
by rattanasak over 10 years ago
KP Trigger Cloud
Submitted
by buchacek about 11 years ago
Indicator / Formula
Copy & Paste Friendly
_SECTION_BEGIN("MultipleRibbon");
// You plot a Ribbon by calling the function as follows: MultiRibbon("Color", "Ribbon Number", "Name To Display");
// The "Ribbon Number" is simply the order of the ribbon, starting with 1 as the bottom Ribbon. You can add as many
// ribbons as you want, until you run out of chart space. Just keep track of the 'Serial Number' (Ribbon Number). :-)


RibbonThickness	= Param("Ribbon Thickness", 8, 1, 15, 0.1);
Font				= ParamList("Font:","Arial|Calibri|Futura|Tahoma|Times New Roman");
"";
function GfxConvertBarToPixelX(Bar)
{
 lvb = Status("lastvisiblebar"); fvb = Status("firstvisiblebar");
 pxchartleft = Status("pxchartleft"); pxchartwidth = Status("pxchartwidth");
 return pxchartleft + Bar  * pxchartwidth / (Lvb - fvb + 1);
}

procedure MultiRibbon(RibbonColor, Position, Label)
{
 LineColor	= colorLightGrey;
 Position	= RibbonThickness * Position;
 x2 = Status("pxchartright");
 y2 = Status("pxchartbottom");

 RibbonColor = IIf(GfxConvertBarToPixelX(BarIndex()-Status("firstvisiblebarindex")) > y2/1.5 * (RibbonThickness/100) * 18 ,
               RibbonColor, colorYellow);

 Plot(0, "", LineColor, styleOwnScale | styleNoLabel, 0, 100);
 Plot(Position, "", LineColor, styleOwnScale | styleNoLabel, 0, 100);
 Plot(Position, "", RibbonColor, styleArea | styleOwnScale | styleNoLabel, 0, 100);

 GfxSetTextColor(colorBlack);
 GfxSelectFont(Font, y2/1.5 * (RibbonThickness/100), 400);
 GfxDrawText(Label, 8, y2 * 1.001 -(y2 * Position/100) , y2/1.5 * (RibbonThickness/100) * 17, y2, 2 + 32 + 256);

}

//=================================================================================================================

//TRENDADVISOR

pointer[0] = 0;

/* Phase filter */

Cond1 = Close > MA(Close, 50)AND NOT(Close > MA(Close, 200))AND NOT(MA(Close, 50) > MA(Close, 200));
Cond2 = Close > MA(Close, 50)AND Close > MA(Close, 200)AND NOT(MA(Close, 50) > MA(Close, 200));
Cond3 = Close > MA(Close, 50)AND Close > MA(Close, 200)AND MA(Close, 50) > MA(Close, 200);
Cond4 = NOT(Close > MA(Close, 50))AND Close > MA(Close, 200)AND MA(Close, 50) > MA(Close, 200);
Cond5 = NOT(Close > MA(Close, 50))AND NOT(Close > MA(Close, 200))AND MA(Close, 50) > MA(Close, 200);
Cond6 = NOT(Close > MA(Close, 50))AND NOT(Close > MA(Close, 200))AND NOT(MA(Close, 50) > MA(Close, 200));

for (i = 1; i < BarCount; i++)
{

  if (Cond1[i])
    pointer[i] = 1;
  if (Cond2[i])
    pointer[i] = 2;
  if (Cond3[i])
    pointer[i] = 3;
  if (Cond4[i])
    pointer[i] = 4;
  if (Cond5[i])
    pointer[i] = 5;
  if (Cond6[i])
    pointer[i] = 6;

}

/* Plot Graphic */
//GraphXSpace= 15 ;
dynamic_color = IIf(pointer < 4, colorGreen, colorRed);
//Plot(pointer, "TrendAdv2", dynamic_color, styleHistogram | styleThick, Null, Null, 0);
//SetChartBkGradientFill(ParamColor("BgTop", colorWhite), ParamColor("BgBottom", colorLightYellow));
//xxxxxxxxxxxxxxxxxxxxxxxxxxxxxxxxxxxxxxxxxxxxxxxxxxxxxxxxxxxxxxxxxxxxxxxxxxxxxxxxxxxxxxxxxxxxxxxxxxxxxxxxxxx

// haDelta-CV-Valcu-Original
//HEIKIN-ASHI
//SetChartOptions(0,chartShowArrows | chartShowDates);
HaClose = (O + H + L + C)/4;
HaOpen = AMA( Ref( HaClose, -1 ), 0.5 );
HaHigh = Max( H, Max( HaClose, HaOpen ) );
HaLow = Min( L, Min( HaClose, HaOpen ) );
xDiff = (HaClose - HaLow);
//barcolor = IIf(HaClose >= HaOpen,colorGreen,colorRed);
//barcolor= IIf(HaClose>=HaOpen,colorGreen,colorRed) ;
//SetBarFillColor(IIf(HaClose>=HaOpen,colorLime,colorRed));
//PlotOHLC( HaOpen, HaHigh, HaLow, HaClose, "", barcolor, styleCandle );
HaDelta= (HaClose-HaOpen) ;
MA1= MA(Hadelta,3) ;
//Plot(Hadelta,"haDelta",colorBlack) ;
//Plot(0,"",colorBrown) ;
//Plot( MA1, "MA3", colorRed );
//xxxxxxxxxxxxxxxxxxxxxxxxxxxxxxxxxxxxxxxxxxxxxxxxxxxxxxxxxxxxxxxxxxxxxxxxxxxxxxxxxxxxxxxxxxxxxxx

//BB HISTOGRAM

_SECTION_BEGIN("BB Histogram");
bbhist=((C+2*StDev(C,20) - MA(C,18)) / ((4*StDev(C,18)))*4) - 2;
//Plot(bbhist, "BBands Histogram", IIf(bbhist > 0, colorLime, colorRed),styleHistogram + styleThick);
//Plot(0,"",colorBrown) ;
_SECTION_END();
//xxxxxxxxxxxxxxxxxxxxxxxxxxxxxxxxxxxxxxxxxxxxxxxxxxxxxxxxxxxxxxxxxxxxxxxxxxxxxxxxxxxxxxxxxxxxxxxxxxxxx

//VOLATILITY RATIO
//n = Param("movn",10,1,50,1);
nTSM = Param("TSMper",15,5,34,1,0) ;
nMATSM = Param("MATSMper",3,3,17,1,0) ;
ratio = C / Ref(C,-1);
natlog = log(ratio);
TSMVolatilityRatio = MA(natlog, nTSM);
MATSM = MA(TSMVolatilityRatio,nMATSM) ;
//Plot(TSMVolatilityRatio, "VolatilityRatio", colorRed,styleLine);
//Plot(0,"",colorBrown) ;
//Plot(MATSM,"MATSM",colorBlue) ;
TSMup= TSMVolatilityRatio>0 AND TSMVolatilityRatio>MA(TSMVolatilityRatio,nMATSM) ;
//xxxxxxxxxxxxxxxxxxxxxxxxxxxxxxxxxxxxxxxxxxxxxxxxxxxxxxxxxxxxxxxxxxxxxxxxxxxxxxxxxxxxxxxxxxxxxxxxxxxxxxxx

//============================================ MAhaDelta ======================================
r1= IIf(MA(Hadelta,3)>0 ,colorGreen,colorRed);

//============================================ CupSAR ======================================
r2 = IIf (C>SAR(0.02,0.2),colorGreen,colorRed);

//============================================ BBhistogram =======================
//PL = (H + C+ L)/3;
r3 = IIf (bbhist>0,colorGreen,colorRed);

//---------------------------------------------------------------------------

//============================================ Volatility =======================
//PL = (H + C+ L)/3;
r4 = IIf (TSMVolatilityRatio>0,colorGreen,colorRed);

//---------------------------------------------------------------------------

//========================================== MACD ===========================
RSI21 = EMA(RSI(21),5);

//r2 = IIf (RSI21 >BBandTop(RSI21,5,0.5),colorGreen,IIf (RSI21 <BBandBot(RSI21,5,0.5),colorRed,colorYellow));
r5 = IIf (MACD()>Signal(),colorGreen,colorRed);
//---------------------------------------------------------------------------

//======================================== Stoch ==============================
//r4 = IIf(EMA(PDI(7),3) > EMA(MDI(7),3),colorGreen,colorRed);
//r4 = IIf(ADX()>Ref(ADX(),-1),colorGreen,colorRed);
r6 = IIf(StochK()>StochD() AND StochK()>20 OR StochK()>80,colorGreen,colorRed);


//======================================== PDIupMDI ==============================

//r3 = IIf (MACD(3,34) >BBandTop(MACD(3,34),5,0.5),colorGreen,IIf (MACD(3,34) <BBandBot(MACD(3,34),5,0.5),colorRed,colorYellow));
r7 = IIf (PDI()>MDI(),colorGreen,colorRed);
//---------------------------------------------------------------------------

//======================================== Top2Up ==============================
//r4 = IIf(EMA(PDI(7),3) > EMA(MDI(7),3),colorGreen,colorRed);
r8 = IIf(BBandTop(C,20,2)>=Ref(BBandTop(C,20,2),-1),colorGreen,colorRed);

//======================================== TrendAdviser ==============================
//r4 = IIf(EMA(PDI(7),3) > EMA(MDI(7),3),colorGreen,colorRed);
//r6 = IIf(MA(C,50)>=Ref(MA(C,50),-1),colorGreen,colorRed);
r9 = IIf(pointer < 4,colorGreen,colorRed);

//======================================== MFI ==============================
//r4 = IIf(EMA(PDI(7),3) > EMA(MDI(7),3),colorGreen,colorRed);
r10 = IIf(MFI()>EMA(MFI(),5) OR MFI()>50,colorBrown,colorRose);

//========================================Limita ==============================
//r4 = IIf(EMA(PDI(7),3) > EMA(MDI(7),3),colorGreen,colorRed);
r11 = IIf((ADX()<50 AND MFI()>30),colorGreen,colorRed);

/*
EMA21 = IIf (MACD(34,55) >Ref(MACD(34,55),-1),colorGreen,colorRed);
EMA34 = IIf (MACD(55,89) >Ref(MACD(55,89),-1),colorGreen,colorRed);
EMA55 = IIf (MACD(3,34) >Ref(MACD(3,34),-1),colorGreen,colorRed);
EMA21 = IIf(PDI(5) > MDI(5),colorGreen,colorRed);
EMA34 = IIf(PDI(9) > MDI(9),colorGreen,colorRed);

//========================================ADX trend ==============================

r6 = IIf(ADX(7) > Ref(ADX(7),-1) AND ADX(7) > 20 AND (ADX(7) > PDI(7) OR ADX(7) > MDI(7)),colorBlue,
     IIf(ADX(7) > Ref(ADX(7),-1) , colorAqua,colorBlack));
//---------------------------------------------------------------------------
*/
MultiRibbon(r11, 1, "Limita");
MultiRibbon(r10, 2, "MFI");
MultiRibbon(r9, 3, "TrendAdviser");
MultiRibbon(r8, 4, "Top2Up");
MultiRibbon(r7, 5, "PDIupMDI");
MultiRibbon(r6, 6, "Stoch");
MultiRibbon(r5, 7, "MACD");
MultiRibbon(r4, 8, "Volatility");
MultiRibbon(r3, 9, "BBhistogram");
MultiRibbon(r2, 10, "CupSAR");
MultiRibbon(r1, 11, "MAhaDelta");

/*
//==================interpretation============================

WriteIf(EMA( Close,13)>EMA( Close,39),"EMA says : UP TREND \n EMA -50 SL of "+ WriteVal(EMA(Close,50)),
       "EMA says : DOWN TREND \n  EMA "+ WriteVal(EMA(Close,50)));
WriteIf (Trix( 9 ) > Ref( Trix( 9 ) , -1 ),"\n TRIX =" + WriteVal(Trix( 9 ))+ " : UP","\n TRIX =" + WriteVal(Trix( 9 ))+"   : DOWN");
WriteIf (MACD( 12, 26 ) > Ref( MACD( 12, 26 ) , -1 ), "MACD ="+ WriteVal(MACD( 12, 26 ))+ " :
        UP","MACD ="+ WriteVal(MACD( 12, 26 ))+ " : DOWN");
WriteIf(ADX( 9 ) > Ref( ADX( 9 ) , -1 ),"ADX ="+WriteVal (ADX(9))+"   :TREND-ING","ADX ="+WriteVal (ADX(9))+"   : ----");
WriteIf (RSI( 7 ) > Ref( RSI(7) , -1 ), "RSI ="+ WriteVal(RSI( 7))+ " : UP","RSI ="+ WriteVal(RSI( 7))+ " : DOWN");
WriteIf (CCI( 10 ) > Ref( CCI(10) , -1 ), "CCI ="+ WriteVal(CCI( 10))+ " : UP","CCI ="+ WriteVal(CCI( 10))+ " : DOWN");
WriteIf(StochK( 14)< Ref (StochK( 14),1) ,"stochastic ="+WriteVal (StochK(14))+" : UP " ,"stochastic =
        "+WriteVal (StochK( 14))+" : DOWN ");
"";
WriteIf (Close > SAR( 0.02, 0.2 ),"SAR says : go LONG at "+Close+" \n with a Stop-Loss = " + WriteVal(  SAR( 0.02, 0.2 )),
        "SAR says : go Short at "+Close+"\n with a Stop-Loss = " + WriteVal(  SAR( 0.02, 0.2 )));
*/
//xxxxxxxxxxxxxxxxxxxxxxxxxxxxxxxxxxxxxxxxxxxxxxxxxxxxxxxxxxxxxxxxxxxxxxxxxxxxxxxxxxxxxxxxxxxxxxxxxxxxxxxxxxxxxxxxxxxxxxxxxxxxxx
13 comments
Leave Comment
Please login here to leave a comment.
Back
Hi morgen
Nice formula,thanks for that. will you pls post formula for the middle pan charts,
looking forward
To sikandar;
The formula on your request I have named “BuySWING&VSTOPEMPottasch&TGL”, is a combination :
VSTOP&ATR E.M.Pottasch, Jul 2010 +
Tommorrow’sPivots + a number of basic indicators + paramtoggle system.
I can’t to put this formula HERE, it has over 3000 characters!
And I can’t to put my formula in Wisestocktrader, because those formulas are alredy in this site from their authors.
You can look in this site for;
1) VSTOP
2) Tomorrow’s Pivots
3) Morgen formulas
Morgen, you can put it in the indicator pasties section and post the link in your comment.
TO SIKANDAR
Check “Indicator Pastie” section for
“Buy&VSTOP&PIV&TGL”.
A (precedent) congestion of Tomorrow’sPivots means a posible change in trend, up or down, see VSTOP and the other indicators.
Thanks morgen
plz help me to draw RIBBON FOR RSI , WHEN RSI >70=GREEN,RSI<30=RED,AND INBETWEEN 70-30=YELLOW
//RSI RIBBON
// Drag-and-drop the code on to your price chart
I think more efficient would be:
Check Indicator Pastie.
To “morgen”
i check the below formula but the error occur in that formula….
i required the ribbon in which
1 when RSI is grater than 70 its colour is green,
2 when RSI is grater than 30to 70 its colour is yelow,
3 when RSI is below 30 its colour is red.
plz help me and edit my above formula,
& thank for ur support
To balhire
See “Indicator Pastie” section in this site for “balhireRSIribbon”.
thanks for ur help ,
its working.
can any body correct this formula pls