Stock Portfolio Organizer
The ultimate porfolio management solution.
WiseTrader Toolbox
#1 Selling Amibroker Plugin featuring:
Trendwave on Amibroker for Amibroker (AFL)
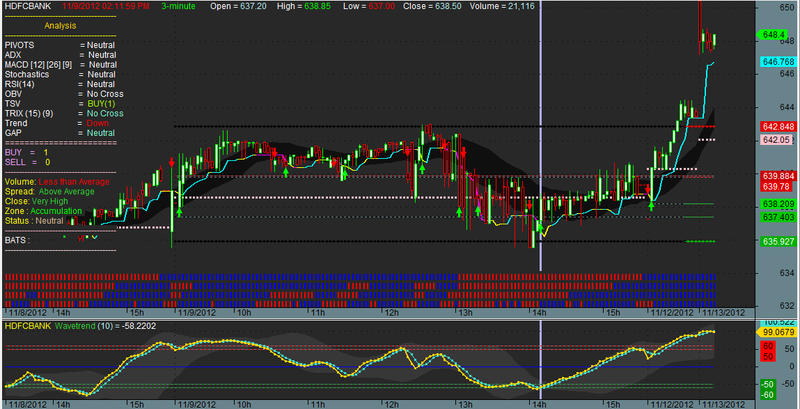
This is modified “Mikes Wave Trend” using Wilder’s Moving Average & is exact same code as “TrendWave.mq4” in Metatrader.
Video On TrendWave Trading : http://www.youtube.com/watch?v=7vhIsk51_Ro
The four dashed lines in Trendend are 60/50 & -60/-50 , a BUY is triggered only when the lines cross within or below the lower band, for sell it has to happen on the upper band.
Strong signal: If we see a Bollinger squeeze around the trigger level, wait for 3 bars to confirm the squeeze breakout direction & go with the trend direction.
Modification: In Trendwave for Metatrader, we have signals that show up as dots at the crossover point around the target bands, however, when I checked Trendwave live in MT4, I have seen the dot repainting. In this code the dot’s do not appear. Using Wilder’s MA smoothened the crossover & eliminated a lot of jitters in lower TF. Shadowed BB added in the code to identify BB squeeze zones.
This indicator is for fast trade & best used at lower TF ( play it from 3:10PM to 3:25PM ) & see what it can do on 1M/3M TF.
This is by far one of the best leading indicators available…it’s best use case is when MKT high have higher volatility e.g at the start of the session or towards the end.
Screenshots
Similar Indicators / Formulas
Indicator / Formula
SetChartOptions(0,chartShowArrows|chartShowDates);
SetChartBkColor(ParamColor("Outer Panel",colorPaleBlue));
SetChartBkGradientFill(ParamColor("Upper Chart",colorDarkGrey),ParamColor("Lower Chart",colorDarkGrey));
GraphXSpace = Param("GraphXSpace",7,0,20,0.5);

_SECTION_BEGIN("WaveTrend");

Period        = 10;                              // Channel periods default is 10.
AvgPeriod     = 20;                              // Average periods default is 21.

AP            = Avg;                             // Typical Price = ( High + Low + Close ) / 3
ESA           = Wilders(AP, Period);
D             = Wilders(abs(AP - ESA), Period);
CI            = (AP - ESA) / (0.015 * D);

WaveTrend1    = EMA(CI, AvgPeriod);              // Gold Color ( BUY )
WaveTrend2    = MA(WaveTrend1,4);                // Turquoise Color ( SELL )

Plot(WaveTrend1,"WaveTrend1",colorGold,styleDots | styleThick);
Plot(WaveTrend2,"WaveTrend2",colorTurquoise,styleDots);

Plot(0,"",colorBlue,styleNoLabel);

Plot( -60 , "", colorGreen,styleDashed);
Plot( -50 , "", colorGreen,styleDashed);
Plot( 50 , "", colorRed,styleDashed);
Plot( 60 , "", colorRed,styleDashed);

_SECTION_END();

Title=EncodeColor(colorYellow)+ Name()+ EncodeColor(colorLime) +"  Wavetrend " + EncodeColor(colorPaleTurquoise) +"(" +Period+ ") = " + EncodeColor(colorWhite) + WaveTrend1;

_SECTION_BEGIN("Bollinger Bands");
P = ParamField("Price field",-1);
Periods = Param("Periods", 20, 2, 100, 1 );
Width = Param("Width", 2, 0, 10, 0.05 );
Color = ParamColor("Color", colorLightGrey );
Style = ParamStyle("Style", styleLine | styleNoLabel ) | styleNoLabel;

bbt = BBandTop( P, Periods, Width );
bbb = BBandBot( P, Periods, Width );

PlotOHLC( bbt, bbt, bbb, bbb, "", ColorBlend( Color, colorDarkGrey, 0.9 ), styleNoLabel | styleCloud | styleNoRescale, Null, Null, Null, -1 );
_SECTION_END();
10 comments
Leave Comment
Please login here to leave a comment.
Back
This is an amazing indicator.
Thanks for sharing.
gacsekar
Note: “0” Line of Trendwave is a potential reversal area, if you have opened a trading with 2 lots ( on top or lower zone cross ), ensure to book partial profit ( 1 lot ) at “0” line, if the the Trendwave is seen loosing momentum around the “0” line i.e. the slope angle of the wave need to 45 degree at a minimum if the angle is lower value like 10 to 20 degree, better protect your profit by closing 1 lot out of the two in trade.
Hello niladri,
Good modification. Works well in Daily , weekly timeframe.
Stochastic-momentum indicator elsewhere in the Library has exactly the same crossings so nothing new here.
thank you
Can anyone please post the link to the formula which is in upper chart……the one with the analysis panner…..
hi niladri,
its really works. try to buy sell signal include.
i’m happy with that. thanks
Siddhartha
dear niladri,
i need an afl which can help me to ignore Choppy Signal.
Siddhartha. From Bangladesh.
dear niladri,
Well done with the modification with Bollinger Bands added! Do you bother to do the same modifications for the original MT4 indicator? Many thanks!
Thanks very much, this afl very helpfull. I pray GOD will bless you. Gbu