Stock Portfolio Organizer
The ultimate porfolio management solution.
Shares, Margin, CFD's, Futures and Forex
EOD and Realtime
Dividends and Trust Distributions
And Much More ....
WiseTrader Toolbox
#1 Selling Amibroker Plugin featuring:
Advanced Adaptive Indicators
Advanced Pattern Exploration
Neural Networks
And Much More ....
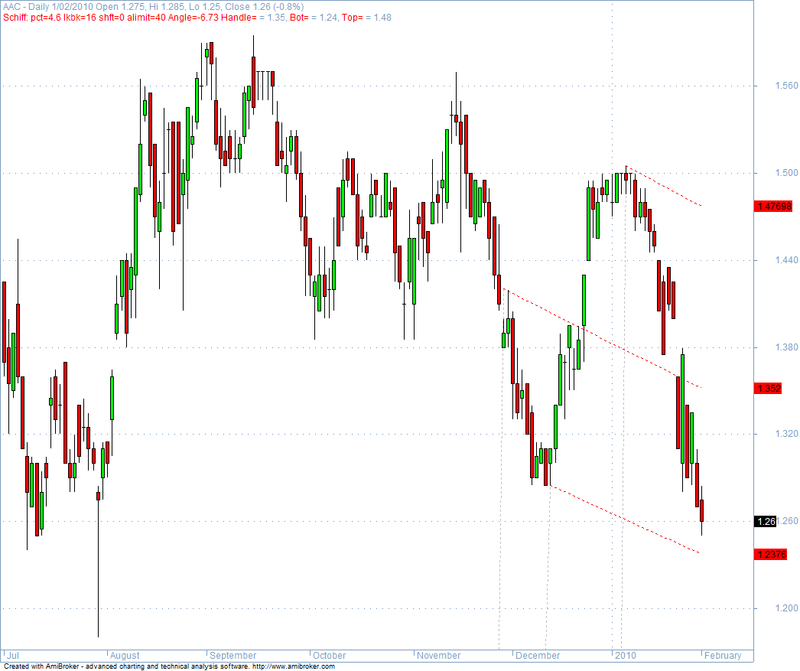
Schiff Lines for Amibroker (AFL)
Rating:
3 / 5 (Votes 2)
Tags:
amibroker, pattern
Variation on Andrew’s Pitchfork. Uses the midpoint between the left 2 peak/trough points instead of the leftmost peak/trough to determine the slope of the lines.
By Bob Johnson – bjohnson314 [at] kc.rr.com
Screenshots
Similar Indicators / Formulas
Wolf Wave AFL
Submitted
by shekhar373 over 12 years ago
Head & Shoulders Pattern
Submitted
by anandnst almost 13 years ago
Volume Trade with Candle reader
Submitted
by Divyesh almost 11 years ago
Modified Head & Shoulder Pattern
Submitted
by huynhbao2 about 13 years ago
Cup Formation
Submitted
by vargasc1 about 13 years ago
Andrews Pitchfork v3.3
Submitted
by kaiji over 14 years ago
Indicator / Formula
Copy & Paste Friendly
// Schiff Lines
// Modified from Andrews Pitchfork V3.3
// Use Peak() & Trough() to get peaks & troughs.
// This version deals with adjacent peaks and adjacent
// troughs, i.e. two peaks without an intervening trough or vice-versa.
// It goes backwards from the selected bar until it has a set of
// peak,trough,peak or trough,peak,trough points to use for calulating
// the Schiff lines.  When 2 or more peaks or 2 or more troughs are adjacent
// it only uses the last one, i.e. the rightmost one, of the series.
//
// This plots the Schiff lines based on the last 3 identified peaks and troughs.
// Instead of a fixed look-back period it identifies the actual bars where the
// peaks AND troughs were revealed by the price action.  i.e. the price has to have
// moved off the high/low by the zigzag pct before the peak or trough will
// be used.
//
// Plots the trendlines as exponential curves that plot as
// straight lines on an semilog chart.
//

SetBarsRequired( 999999,999999);

bi=BarIndex();
sbi=SelectedValue(bi);
echng = 0;

// Pct threshhold for peak() & trough()
Zigpct=Param("Zigpct",4.6,1.0,30.0,0.1,0);

// Since the Zig function only works on a single array, to get a true
// High/Low peak/trough have to approximate it by an EMA choosing the
// High/Low based on the direction the EMA is moving.  Very occasionally
// it misses the correct High/Low.  To just use value, for example the close,
// just change zpr=IIf(ROC(zema,1) > 0,H,L); to zpr=C;
zema=EMA(C,14);
zpr=IIf(ROC(zema,1) > 0,H,L);
zag=Zig(zpr,zigpct);
tr=Ref(zag,-1) > zag AND zag < Ref(zag,1);
pk=Ref(zag,-1) < zag AND zag > Ref(zag,1);
pkprice=ValueWhen(pk,zpr);
trprice=ValueWhen(tr,zpr);

// This bit is still valid at the right edge.  If price moves far enough in 1 Day to show
// a peak or trough on the last bar, the peak or trough won't go away later. The pk_id OR
// tr_id (below) will appear on the same bar.  Normally peaks & troughs appear in 'the past',
// e.g. the high 10 days ago wasn't a peak yesterday but today it is because the price dropped
// enough to make it a peak.
pklast=IIf(BarsSince(pk) < BarsSince(tr),1,0);
trlast=IIf(BarsSince(tr) < BarsSince(pk),1,0);

// A peak or trough is defined as the price moving X pct down or up from a high OR Low.
// The identification point is when the price has actually moved that far.  The Peak/Trough
// will appear 'in the past' on the same day as the pk_id or tr_id appears on the rightmost
// bar.
// Use 'OR tr/OR pk' because when the bar that reveals the pk/tr is also a pk/tr the pklast/
// trlast will have flipped.
// Can't use cross of H or L in the 2nd AND because the H or L may not get above OR below the
// trigger price when the pk/tr occurs.
// The NOT conditions eliminate same-day pk/tr pk_id/tr_id cases. i.e. when the Day's price
// range was >= zpct on the pk/tr day.
pk_id=((pklast OR tr) AND pkprice*(1-(zigpct*0.01)) > L ) AND NOT ( pk AND (H - L)/L >= 0.01 * zigpct);
tr_id=((trlast OR pk) AND H > trprice*(1+(zigpct*0.01)) ) AND NOT ( tr AND (H - L)/L >= 0.01 * zigpct);

// The pk_id/tr_id conditions can recur before the next pk or tr
pk_id=ExRem(pk_id,tr_id);
tr_id=ExRem(tr_id,pk_id);

pk_idlast=IIf(BarsSince(pk_id) < BarsSince(tr_id),1,0);
tr_idlast=IIf(BarsSince(tr_id) < BarsSince(pk_id),1,0);

Lookbk=IIf(pk_idlast,BarsSince(pk),BarsSince(tr));

// How many bars to extend the pitchfork past the selected bar.
xtsn=Param("Extension",62,1,2500,1);

// Shift to move pitchfork up/down from original position one penny at time.
shift=Param("Shift",0,-2000,2000,0.01);

// Filter out cases when the angle of the median lines is too extreme,
// The loop will continue until it finds a set of lines whose slope falls
// between +- the Angle Limit.  Setting the angle limit to 90 effectively
// turns it off.
alimit=Param("Angle Limit",40,1,180,1);

// bkgrndcolor should match your background color.  It's used to mask the
// parts of the pitchfork arrays outside the calculated pitchfork from view.
bkgrndcolor=ParamColor("Background Color",colorLightGrey);
pitchforkcolor=ParamColor("Line Color",colorRed);

// The peak/trough lines will be used to determine the y coordinates
// of the pitchfork's 3 determining points.

//pline1=Peak(H,Zigpct,1);
//tline1=Trough(L,Zigpct,1);
pline1=pkprice;
tline1=trprice;
// Identify the pivots.

pzag1=pline1 != Ref(pline1,-1);
tzag1=tline1 != Ref(tline1,-1);

// Get the x,y coordinates of the pivots skipping adjacent
// peaks and troughs.  Go backwards from the current bar minus the lookback.

// These will hold the x,y coordinates of the pivot points in arrays at the
// sbi index.

zagx1=0;
zagx2=0;
zagx3=0;
zagy1=0;
zagy2=0;
zagy3=0;

for ( i = sbi - Lookbk[sbi], zagfnd = 0, pzagfnd = 0, tzagfnd = 0 ; i >= 0 && zagfnd < 3; i-- ) {
    if ( pzag1[i] || tzag1[i] ) {
        if ( pzag1[i] && NOT pzagfnd ) {
             zagfnd=zagfnd+1;
             pzagfnd=1;
             tzagfnd=0;
             if ( zagfnd == 1 ) {
                 zagx1[sbi]=i;
                 zagy1[sbi]=pline1[i];
             } else if (zagfnd == 2) {
                 zagx2[sbi]=i;
                 zagy2[sbi]=pline1[i];
             } else if (zagfnd == 3) {
                 zagx3[sbi]=i;
                 zagy3[sbi]=pline1[i];
             }
        } else if ( tzag1[i] && NOT tzagfnd ) {
             zagfnd=zagfnd+1;
             tzagfnd=1;
             pzagfnd=0;
             if ( zagfnd == 1 ) {
                 zagx1[sbi]=i;
                 zagy1[sbi]=tline1[i];
             } else if (zagfnd == 2) {
                 zagx2[sbi]=i;
                 zagy2[sbi]=tline1[i];
             } else if (zagfnd == 3) {
                 zagx3[sbi]=i;
                 zagy3[sbi]=tline1[i];
             }
        }
    }

    if ( zagfnd == 3 ) {  // Got 3 candidate peak/trough points

        echng=0;
        midx=0;
        midy=0;
        schiffx=0;
        schiffy=0;
        Handle=0;
        Top=0;
        Bot=0;

        // For Schiff lines instead of Andrew's Pitchfork, move the left pivot point
        // to the mid point of the left most pivots.

        schiffx[sbi]=zagx3[sbi] + (zagx2[sbi]-zagx3[sbi]) / 2;
        schiffy[sbi]=exp( log(zagy2[sbi]) - ( log(zagy2[sbi])-log(zagy3[sbi]) ) / 2);
        // to avoid changing all the instances of zagx3,zagy3 from the old Andrew's code
        // just reset x3 & y3 to the schiff values.

        zagx3[sbi] = schiffx[sbi];
        zagy3[sbi] = schiffy[sbi];

        echng=(log(midy[sbi])-log(zagy3[sbi]))/(midx[sbi]-zagx3[sbi]);

        // Determine Midpoint between the rightmost 2 pivots and the slope from the
        // Schiff point determined above to the midpoint.

        Midx[sbi]=zagx2[sbi] + (zagx1[sbi]-zagx2[sbi]) / 2;
        Midy[sbi]=exp( log(zagy1[sbi]) - ( log(zagy1[sbi])-log(zagy2[sbi]) ) / 2);
        echng=(log(midy[sbi])-log(zagy3[sbi]))/(midx[sbi]-zagx3[sbi]);

        // Apply the Angle Limit filter

        angle_rad = atan(echng);//radians
        angle_deg = 100 * angle_rad * 180/3.1416;//degrees

        if ( angle_deg < -alimit || angle_deg > alimit ) { // Too steep, reset the search
                                                           // to begin from the 2nd pivot found
            if ( tzagfnd == 1 ) {  // was tr,pk,tr so switch to pk,tr,pk
                tzagfnd = 0;
                pzagfnd = 1;
                zagfnd = 1;
                zagx1[sbi]=zagx2[sbi];
                zagy1[sbi]=zagy2[sbi];
                i = zagx1[sbi];
                zagx2=0;
                zagx3=0;
                zagy2=0;
                zagy3=0;
            } else {  // was pk,tr,pk so switch to tr,pk,tr
                tzagfnd = 1;
                pzagfnd = 0;
                zagfnd = 1;
                zagx1[sbi]=zagx2[sbi];
                zagy1[sbi]=zagy2[sbi];
                i = zagx1[sbi];
                zagx2=0;
                zagx3=0;
                zagy2=0;
                zagy3=0;
            }
       }
    }
}

// Calculate the Schiff lines themselves

// Handle first

for ( j=zagx3[sbi],n=0 ; j < Min(sbi+xtsn,BarCount) ; j++,n++ ) {
   Handle[j]=exp(log(zagy3[sbi]) + n*echng) + shift;
}


// High & low median lines.
if ( (exp(log(zagy2[sbi]) + (sbi-zagx2[sbi])*echng))
     > (exp(log(zagy1[sbi]) + (sbi-zagx1[sbi])*echng)) ) {  // Which one is top?
   for ( j=zagx2[sbi],n=0 ; j < Min(sbi+xtsn,BarCount) ; j++,n++ ) {
      top[j]=exp(log(zagy2[sbi]) + n*echng) + shift;
   }
   for ( j=zagx1[sbi],n=0 ; j < Min(sbi+xtsn,BarCount) ; j++,n++ ) {
      bot[j]=exp(log(zagy1[sbi]) + n*echng) + shift;
   }
} else {
   for ( j=zagx2[sbi],n=0 ; j < Min(sbi+xtsn,BarCount) ; j++,n++ ) {
      bot[j]=exp(log(zagy2[sbi]) + n*echng) + shift;
   }
   for ( j=zagx1[sbi],n=0 ; j < Min(sbi+xtsn,BarCount) ; j++,n++ ) {
      top[j]=exp(log(zagy1[sbi]) + n*echng) + shift;
   }
}

Hcolor=IIf(Handle==0,bkgrndcolor,IIf(Ref(handle,-1)== 0 AND handle != 0, bkgrndcolor,pitchforkcolor));
Tcolor=IIf(Top==0,bkgrndcolor,IIf(Ref(top,-1)== 0 AND top != 0, bkgrndcolor,pitchforkcolor));
Bcolor=IIf(Bot==0,bkgrndcolor,IIf(Ref(bot,-1)== 0 AND bot != 0, bkgrndcolor,pitchforkcolor));
Htitle=EncodeColor(pitchforkcolor)
      + StrFormat("\nSchiff: pct=%g lkbk=%g shft=%g alimit=%g Angle=%3.2f Handle=",
        Zigpct, Lookbk, shift, alimit, angle_deg);
Plot(Handle,Htitle,Hcolor,styleLine+styleDashed+styleNoRescale);
Plot(Bot,EncodeColor(pitchforkcolor)+"Bot=",Bcolor,styleLine+styleDashed+styleNoRescale);
Plot(Top,EncodeColor(pitchforkcolor)+"Top=",Tcolor,styleLine+styleDashed+styleNoRescale);
6 comments
Leave Comment
Please login here to leave a comment.
Back
PL CORRECT IT SAYS ECHNG NOT INITIALISED WHEN WE LOAD THE FORMULA PL HELP MY EMAIL sudhiranand@smartfundz.com
Works fine for me check that your doing everything correctly.
Hi sudhir12192,
Even, I too got the same error. But surprised how the administrator has expressed that it worked fine.
With the administrator’s permission, I would like to submit how it worked for me.
First of all, this indicator should be applied on a price chart.
Then, just add the following at the top of the code ie., in the 4th or 5th line to have these variables initialised.
echng=0;
angle_rad = atan(echng);
angle_deg = 100 * angle_rad * 180/3.1416;
Save & apply the indicator on a price chart.
Works beautifully.
Thanks to Bob Jhonson.
eevra does just adding echng = 0; at the top of the formula work for you? Also what version of amibroker are you using?
Yes. It works. My AMi version is 5.2 rc1
Okay as per eevra’s suggestion i have edited the formula it should work now.