Stock Portfolio Organizer
The ultimate porfolio management solution.
Shares, Margin, CFD's, Futures and Forex
EOD and Realtime
Dividends and Trust Distributions
And Much More ....
WiseTrader Toolbox
#1 Selling Amibroker Plugin featuring:
Advanced Adaptive Indicators
Advanced Pattern Exploration
Neural Networks
And Much More ....
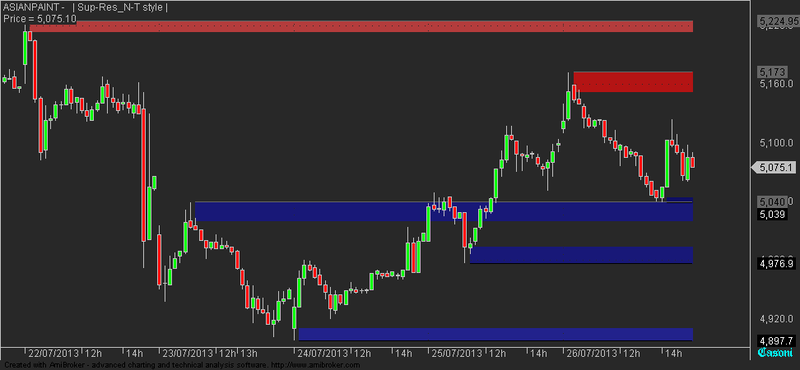
Supply Demand zone for Amibroker (AFL)
Rating:
4 / 5 (Votes 10)
Tags:
amibroker, support, resistance
Got the concept from traderji.com
thread > http://www.traderji.com/amibroker/88984-supply-demand-formula-ninjacator.html
check the thread for video link’s
thank you
Screenshots
Similar Indicators / Formulas
Intraday Trades
Submitted
by vishalsbharati over 12 years ago
price support resistance
Submitted
by icemanc almost 13 years ago
Support & Resistance
Submitted
by shyam242 almost 13 years ago
Yancedolly Bands - how to catch chickens ? - strategy part 1
Submitted
by yancedolly about 13 years ago
Automatic Support and Resistance with Channel
Submitted
by kaiji over 14 years ago
Support/Resistance Modified
Submitted
by dkeleher about 13 years ago
Indicator / Formula
Copy & Paste Friendly
SetChartOptions(0,chartShowArrows|chartShowDates);
bk=ParamColor( "Bk col",colorDarkGrey);
SetChartBkColor(bk);
SetBarFillColor(IIf(C>O,colorBrightGreen,IIf(C<=O,colorRed,colorLightGrey)));
Plot(C,"  | Sup-Res_N-T style |\nPrice",47,64,0,0,0,0);

sr=ParamToggle("Plot Supp/Res lines","No|Yes" ,1);
Per=Param("Sensitivity",1,0.5,5,0.5);
g=Param("No.of Lines",3,1,5,1);
x=Cum(1);
Pk1=PeakBars(H,per,1)== 0;
Tk1=TroughBars(L,per,1)== 0;

px1=LastValue(ValueWhen(pk1,x,1));
px2=LastValue(ValueWhen(Pk1,x,2));
px3=LastValue(ValueWhen(Pk1,x,3));
px4=LastValue(ValueWhen(pk1,x,4));
px5=LastValue(ValueWhen(Pk1,x,5));

tx1=LastValue(ValueWhen(Tk1,x,1));
tx2=LastValue(ValueWhen(Tk1,x,2));
tx3=LastValue(ValueWhen(Tk1,x,3));
tx4=LastValue(ValueWhen(Tk1,x,4));
tx5=LastValue(ValueWhen(Tk1,x,5));

XT1 =LastValue(ValueWhen(pk1,H,1));XT1c =LastValue(ValueWhen(pk1,Max(C,O),1));
XT2 =LastValue(ValueWhen(Pk1,H,2));XT2c =LastValue(ValueWhen(pk1,Max(C,O),2));
XT3 =LastValue(ValueWhen(Pk1,H,3));XT3c =LastValue(ValueWhen(pk1,Max(C,O),3));
XT4 =LastValue(ValueWhen(pk1,H,4));XT4c =LastValue(ValueWhen(pk1,Max(C,O),4));
XT5 =LastValue(ValueWhen(Pk1,H,5));XT5c =LastValue(ValueWhen(pk1,Max(C,O),5));

YT1 =LastValue(ValueWhen(tk1,L,1));YT1c =LastValue(ValueWhen(tk1,Min(O,C),1));
YT2 =LastValue(ValueWhen(tk1,L,2));YT2c =LastValue(ValueWhen(tk1,Min(O,C),2));
YT3 =LastValue(ValueWhen(tk1,L,3));YT3c =LastValue(ValueWhen(tk1,Min(O,C),3));
YT4 =LastValue(ValueWhen(tk1,L,4));YT4c =LastValue(ValueWhen(tk1,Min(O,C),4));
YT5 =LastValue(ValueWhen(tk1,L,5));YT5c =LastValue(ValueWhen(tk1,Min(O,C),5));

pk1=IIf(x>px1 AND g>=1 AND sr,XT1,Null);pk1c=IIf(x>px1 AND g>=1 AND sr,XT1c,Null);
Col1=IIf( LastValue(C)>pk1, ColorRGB(14,14,100), ColorRGB(180,20,20) );
Plot(pk1,"",31,1);PlotOHLC(0,pk1,pk1c,0,"",Col1,styleCloud|styleNoLabel,Null, Null, Null, -1);
pk2=IIf(x>px2 AND g>=2 AND sr,XT2,Null);pk2c=IIf(x>px2 AND g>=2 AND sr,XT2c,Null);
Col2=IIf( LastValue(C)>pk2, ColorRGB(24,24,120), ColorRGB(180,40,40) );
Plot(pk2,"",31,1);PlotOHLC(0,pk2,pk2c,0,"",Col2,styleCloud|styleNoLabel,Null, Null, Null, -2);
pk3=IIf(x>px3 AND g>=3 AND sr,XT3,Null);pk3c=IIf(x>px3 AND g>=3 AND sr,XT3c,Null);
Col3=IIf( LastValue(C)>pk3, ColorRGB(34,34,140),ColorRGB(180,60,60));
Plot(pk3,"",31, 1);PlotOHLC(0,pk3,pk3c,0,"",Col3,styleCloud|styleNoLabel,Null, Null, Null, -3);
pk4=IIf(x>px4 AND g>=4 AND sr,XT4,Null);pk4c=IIf(x>px4 AND g>=4 AND sr,XT4c,Null);
Col4=IIf( LastValue(C)>pk4, ColorRGB(44,44,160), ColorRGB(180,80,80));
Plot(pk4,"",31,1);PlotOHLC(0,pk4,pk4c,0,"",Col4,styleCloud|styleNoLabel,Null, Null, Null, -4);
pk5=IIf(x>px5 AND g>=5 AND sr,XT5,Null);pk5c=IIf(x>px5 AND g>=5 AND sr,XT5c,Null);
Col5=IIf( LastValue(C)>pk5, ColorRGB(54,54,180), ColorRGB(180,100,100));
Plot(pk5,"",31,1);PlotOHLC(0,pk5,pk5c,0,"",Col5,styleCloud|styleNoLabel,Null, Null, Null, -5);
tl1=IIf(x>tx1 AND g>=1 AND sr,YT1,Null);tl1c=IIf(x>tx1 AND g>=1 AND sr,YT1c,Null);
Col1=IIf( LastValue(C)>tl1, ColorRGB(14,14,100), ColorRGB(180,20,20)  );
Plot(tl1,"",1,1);PlotOHLC(0,tl1,tl1c,0,"",Col1,styleCloud|styleNoLabel,Null, Null, Null, -1);
tl2=IIf(x>tx2 AND g>=2 AND sr,YT2,Null);tl2c=IIf(x>tx2 AND g>=2 AND sr,YT2c,Null);
Col2=IIf( LastValue(C)>YT2, ColorRGB(24,24,120), ColorRGB(180,40,40));
Plot(tl2,"",1,1);PlotOHLC(0,tl2,tl2c,0,"",Col2,styleCloud|styleNoLabel,Null, Null, Null, -2);
tl3=IIf(x>tx3 AND g>=3 AND sr,YT3,Null);tl3c=IIf(x>tx3 AND g>=3 AND sr,YT3c,Null);
Col3=IIf( LastValue(C)>YT3, ColorRGB(34,34,140), ColorRGB(180,60,60) );
Plot(tl3,"",1,1);PlotOHLC(0,tl3,tl3c,0,"",Col3,styleCloud|styleNoLabel,Null, Null, Null, -3);
tl4=IIf(x>tx4 AND g>=4 AND sr,YT4,Null);tl4c=IIf(x>tx4 AND g>=4 AND sr,YT4c,Null);
Col4=IIf( LastValue(C)>YT4, ColorRGB(44,44,160), ColorRGB(180,80,80) );
Plot(tl4,"",1,1);PlotOHLC(0,tl4,tl4c,0,"",Col4,styleCloud|styleNoLabel,Null, Null, Null, -4);
tl5=IIf(x>tx5 AND g>=5 AND sr,YT5,Null);tl5c=IIf(x>tx5 AND g>=5 AND sr,YT5c,Null);
Col5=IIf( LastValue(C)>YT5, ColorRGB(54,54,180), ColorRGB(180,100,100));
Plot(tl5,"",1,1);PlotOHLC(0,tl5,tl5c,0,"",Col5,styleCloud|styleNoLabel,Null, Null, Null, -5);

GfxSetOverlayMode(1);
GfxSetTextColor(10);
GfxSelectFont("Old English Text MT", 12, 300, False, False, 0);
GfxTextOut("  Casoni ", Status("pxwidth")-60 , Status("pxheight")-20 );
7 comments
Leave Comment
Please login here to leave a comment.
Back
please read
support as demand zone
resistance as supply zone
http://www.traderji.com/amibroker/88995-pivot-point-formula.html
VISIT THE PAGE FOR MORE INFORMATION AND FOR MORE MODIFIED SUPPLY DEMAND AFL
@amifan,
nice afl…..
thnx for sharing…..!
hi guys
THIS AFL is the work of casoni.
it is pity his name is not mentioned.
I thank casoni for his serious efforts in bringing out this afl.
There may be other developments in future.
anybody wants more info contact casoni on traderji.com
best regards
ford
Hellow reenath,
There are many codes pasted on that page.
Which one you are referring for MODIFIED SUPPLY DEMAND ? Plz paste the code here.
thanks
viswanath
sir, i dont check the formulas. but i think supply demand afl by trash is also good
supply demand afl is great i think