Stock Portfolio Organizer
The ultimate porfolio management solution.
Shares, Margin, CFD's, Futures and Forex
EOD and Realtime
Dividends and Trust Distributions
And Much More ....
WiseTrader Toolbox
#1 Selling Amibroker Plugin featuring:
Advanced Adaptive Indicators
Advanced Pattern Exploration
Neural Networks
And Much More ....
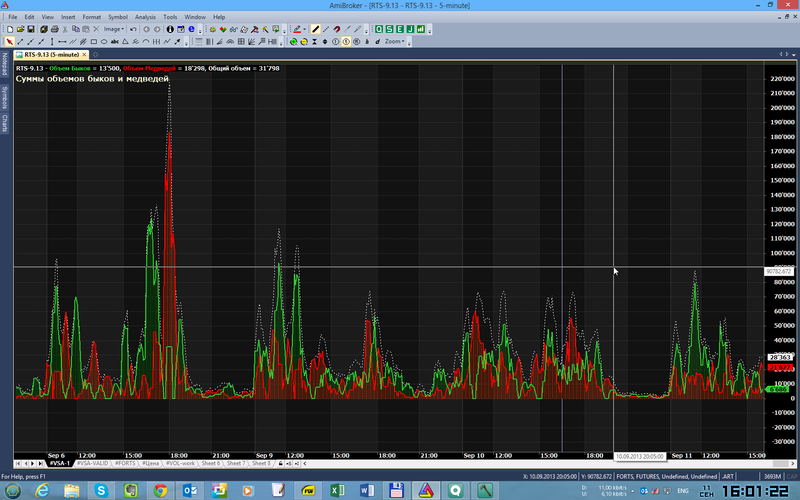
Bull and Bear Volume Separately for Amibroker (AFL)
Rating:
5 / 5 (Votes 1)
Tags:
oscillator, amibroker
Using this AFL You can Plot sum of Bull and Bear Volumes separately and then calculate Force of Market for any periods.
Screenshots
Similar Indicators / Formulas
Febo RSI ..real indicator
Submitted
by abhinavsingh over 12 years ago
Trading Volume Statistic
Submitted
by tuanstock1 almost 10 years ago
Ergodic Oscillator
Submitted
by dljtrader over 13 years ago
3 Days Track
Submitted
by janet0211 almost 14 years ago
Chande Momentum Oscillator
Submitted
by klimpek over 13 years ago
Inverse Fisher Transform Stochastic Oscillator
Submitted
by northstar over 12 years ago
Indicator / Formula
Copy & Paste Friendly
formulaName = "Sum of Bull and Bear Volumes";
SetChartOptions(0,chartShowArrows|chartShowDates);
GfxSetBkMode(1);
GfxSelectFont("Verdana", 12, 600, italic=False);
GfxSetTextColor(colorLightYellow);
GfxTextOut(FormulaName, 4, 20);


_SECTION_BEGIN("Sum of Bull and Bear Volumes");
SetChartOptions(0, chartShowArrows|chartShowDates);
GfxSetBkMode(1);
periods = Param("Periods to Sum", 5, 1, 100, 1);

BullCond = V>Ref(V,-1)	AND C>Ref(C,-1) OR 	V<Ref(V,-1)	AND C<Ref(C,-1);
BearCond = V>Ref(V,-1) AND C<Ref(C,-1) OR V<Ref(V,-1) AND C>Ref(C,-1);

SumBull= Sum (V*BullCond, periods);
SumBear= Sum (V*BearCond, periods);
Delta  = SumBull-SumBear;
Summa  = SumBull+SumBear;

Out = ParamToggle("Show Style", "Bull+Bear|Bull-Bear", 0 );
if ( Out == 0 )
{
GraphXSpace = 20;
	Plot(SumBull,"Bull Vol", colorLime, styleThick);
	Plot(SumBear,"Bear Vol", colorRed, styleThick);
	Plot(SumBear,"", colorBrown, styleHistogram|styleNoLabel|styleNoTitle);
	Plot(SumBull,"", colorDarkGreen, styleHistogram|styleNoLabel|styleNoTitle);
	Plot(Summa,  "All Vol", colorWhite, styleDashed|styleNoRescale);
}
else
{
GraphXSpace = 10;
	DeltaColor = IIf( Delta==0, colorWhite, IIf(Delta>0, colorGreen,colorRed));
	Plot(Delta,"Delta", DeltaColor, styleLine|styleNoLine|styleNoRescale);
	Plot(Delta,"Delta", colorWhite, styleThick|styleNoLabel|styleNoTitle|styleNoRescale);
	PlotOHLC(Delta,Delta,0,Delta,"",DeltaColor, styleCloud|styleClipMinMax|styleNoLabel);
}
_SECTION_END();
3 comments
Leave Comment
Please login here to leave a comment.
Back
Hi Brock,
I was looking for a indicator called Volume BreakDown, you can see at http://www.linnsoft.com/vb/
I could not find it, so I tried to develop that indicator, however; I have some difficulties, I woundering if you could help me, the indicator that I developed is below…..thank you
The problems are:
1. the totals (TotAskVol and TotBidVol) are always set to 1 when new tick occours;
2. the chart level is changing all the time;
thank you,
Carlos
carlos.bahia.br@gmail.com
Hi, cbahia. I don’t use Ami in RealTime.
Hi Brock,
I see, however; if you do not mind, could you please check this code, I am looking for a indicator called Volume BreakDown, you can see at http://www.linnsoft.com/vb/
If you could check the web site above, you will see a very nice indicator….
Thank you,
Carlos