Stock Portfolio Organizer
The ultimate porfolio management solution.
Shares, Margin, CFD's, Futures and Forex
EOD and Realtime
Dividends and Trust Distributions
And Much More ....
WiseTrader Toolbox
#1 Selling Amibroker Plugin featuring:
Advanced Adaptive Indicators
Advanced Pattern Exploration
Neural Networks
And Much More ....
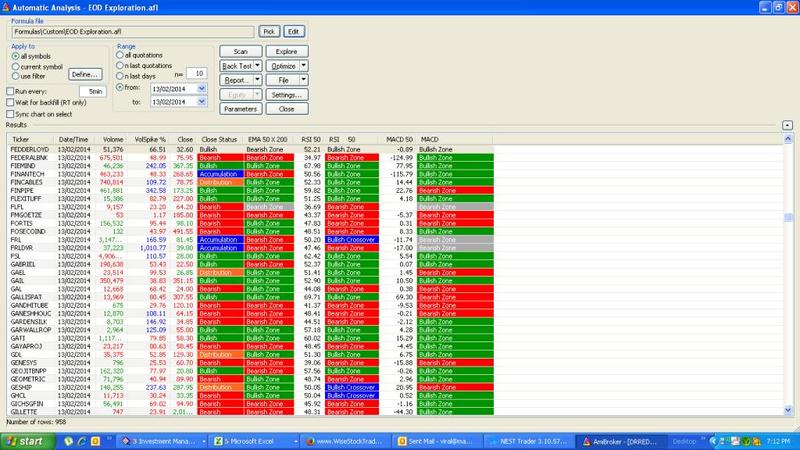
EMA,MACD,RSI EXPLORATION INDICATOR for Amibroker (AFL)
Rating:
4 / 5 (Votes 6)
Tags:
oscillator, amibroker, exploration
THIS INDICATOR IS DEVELOPED TO BE USED FOR INTRADAY OR EOD. IT GIVES PERFECT CALLS & THE EXPLORATION HELPS YOU TO TAKE DECISION ON THE GIVEN CALL.
Screenshots
Similar Indicators / Formulas
Jasons Indicator Convergence Divergence (JICD)
Submitted
by kaiji over 14 years ago
MACD Divergences 2
Submitted
by filinta over 13 years ago
Williams %R Exploration
Submitted
by kaiji about 14 years ago
CumRSI
Submitted
by Xswingtrader almost 14 years ago
Cross Prediction
Submitted
by mauro24 almost 14 years ago
Awesome Oscillator (AO)
Submitted
by zaroldo almost 14 years ago
Indicator / Formula
Copy & Paste Friendly
_SECTION_BEGIN("Price");
SetChartOptions(0,chartShowArrows|chartShowDates);
_N(Title = StrFormat("{{NAME}} - {{INTERVAL}} {{DATE}} Open %g, Hi %g, Lo %g, Close %g (%.1f%%) {{VALUES}}", O, H, L, C, SelectedValue( ROC( C, 1 ) ) ));
Plot( C, "Close", ParamColor("Color", colorBlack ), styleNoTitle | ParamStyle("Style") | GetPriceStyle() );
_SECTION_END();

_SECTION_BEGIN("EMA");
P1 = ParamField("Price field",-1);
Periods1 = Param("Periods", 50, 2, 300, 1, 0);
Plot( EMA( P1, Periods1 ), _DEFAULT_NAME(), ParamColor( "Color", colorCycle ), ParamStyle("Style") );
_SECTION_END();

_SECTION_BEGIN("EMA1");
P2 = ParamField("Price field",-1);
Periods2 = Param("Periods", 200, 2, 300, 1, 0 );
Plot( EMA( P2, Periods2 ), _DEFAULT_NAME(), ParamColor( "Color", colorCycle ), ParamStyle("Style") );
_SECTION_END();

_SECTION_BEGIN("MACD");
r1 = Param( "Fast avg", 50, 2, 200, 1 );
r2 = Param( "Slow avg", 200, 2, 200, 1 );
r3 = Param( "Signal avg", 50, 2, 200, 1 );
ml = MACD(r1, r2);
sl = Signal(r1,r2,r3);
//Plot( ml = MACD(r1, r2), StrFormat(_SECTION_NAME()+"(%g,%g)", r1, r2), ParamColor("MACD color", colorRed ), ParamStyle("MACD style") );
//Plot( sl = Signal(r1,r2,r3), "Signal" + _PARAM_VALUES(), ParamColor("Signal color", colorBlue ), ParamStyle("Signal style") );
//Plot( ml-sl, "MACD Histogram", ParamColor("Histogram color", colorBlack ), styleNoTitle | ParamStyle("Histogram style", styleHistogram | styleNoLabel, maskHistogram ) );
_SECTION_END();

_SECTION_BEGIN("BUYSELL");

//Buy=Cross(EMA(C,10),EMA(C,20)) AND SAR(0.02,0.2) < C AND O > Ref(C,-1);
//Sell=Cross(EMA(C,20),EMA(C,10)) AND SAR(0.02,0.2) > C AND O < Ref(C,-1);

Buy = (Cross(ml,sl) AND RSI(50)> 50) OR (ml > sl AND Cross(RSI(50),50) AND Ref(RSI(50),-1) < 50) AND (MA(V,14)*MA(C,14))>1000000;//Cross(EMA(C,Periods1),EMA(C,Periods2)); //AND C > MA(C,Periods3) AND RSI(14) > 30 AND (MA(V,14)*MA(C,14))>1000000;
Sell = (Cross(sl,ml) AND RSI(50) < 50) OR (ml < sl AND Cross(50,RSI(50)) AND Ref(RSI(50),-1) > 50);//Cross(EMA(C,Periods2),EMA(C,Periods1));// AND C < MA(C,Periods3) AND RSI(14) < 80;


//Buy = ExRem(Buy,Sell);
//Sell = ExRem(Sell,Buy);

PlotShapes(IIf(Buy,shapeUpArrow,shapeNone),colorGreen,0,L,Offset=-20);
PlotShapes(IIf(Sell,shapeDownArrow,shapeNone),colorRed,0,H,Offset=-20);

_SECTION_END();

_SECTION_BEGIN("Volume");
Plot( Volume, _DEFAULT_NAME(), ParamColor("Color", colorBlueGrey ), ParamStyle( "Style", styleHistogram | styleOwnScale | styleThick, maskHistogram  ), 2 );
_SECTION_END();

//Close ZONE
CBl = C > EMA(C,50) AND C > EMA(C,200);
CAc = C > EMA(C,50) AND C < EMA(C,200);
CDi = C < EMA(C,50) AND C > EMA(C,200);
CBr = C < EMA(C,50) AND C < EMA(C,200);

CStatus = WriteIf(CBl, "Bullish", WriteIf(CAc, "Accumulation", WriteIf(CDi, "Distribution","Bearish")));
C_Col=IIf(CBl, colorGreen, IIf(CAc, colorBlue, IIf(CDi, colorOrange,colorRed)));

//EMA Zone
EBullCr = Cross(EMA(C,50),EMA(C,200));
EBrCr = Cross(EMA(C,200),EMA(C,50));
EBullZ = EMA(C,50) > EMA(C,200);
EBrZ = EMA(C,200) > EMA(C,50);

EStatus = WriteIf(EBullCr, "Bullish Crossover", WriteIf(EBrCr, "Bearish Crossover", WriteIf(EBullZ, "Bullish Zone","Bearish Zone")));
E_Col=IIf(EBullCr, colorBlue, IIf(EBrCr, colorOrange, IIf(EBullZ, colorGreen,colorRed)));

//RSI
RBlC = Cross(RSI(50),50) AND Ref(RSI(50),-1) < 50;
RBrC= Cross(RSI(50),50) AND Ref(RSI(50),-1) > 50;
RBlZ = RSI(50) > 50;
RBrZ = RSI(50) < 50;

RStatus = WriteIf(RBlC, "Bullish Crossover", WriteIf(RBrC, "Bearish Crossover", WriteIf(RBlZ, "Bullish Zone","Bearish Zone")));
R_Col=IIf(RBlC, colorBlue, IIf(RBrC, colorOrange, IIf(RBlZ, colorGreen,colorRed)));

//MACD
MBlC = Cross(ml,sl);
MBrC = Cross(sl,ml);
MBlZ = ml > sl;
MbrZ = sl > ml;

MStatus = WriteIf(MBlC, "Bullish Crossover", WriteIf(MBrC, "Bearish Crossover", WriteIf(MBlZ, "Bullish Zone","Bearish Zone")));
M_Col=IIf(MBlC, colorBlue, IIf(MBrC, colorOrange, IIf(MBlZ, colorGreen,colorRed)));


Filter=(MA(V,21)*MA(C,21))>100000 AND Close > 15;

Buy=Filter;

AddColumn(V, "Volome", 1, IIf(V > Ref(V,-1), colorGreen, colorRed),-1);
AddColumn(((V/EMA(Ref(V,-1),10)))*100, "VolSpike %", 1.2, IIf(V> EMA(Ref(V,-1),10), colorBlue, colorRed),-1);
//AddColumn(Delta, "Delta",1.2, IIf(delta < 0, colorRed, colorGreen),-1);
AddColumn(C, "Close", 1.2, IIf(C > Ref(C,-1), colorGreen, colorRed),-1);
AddTextColumn(CStatus, "Close Status", 1.6, colorWhite, C_col,-1);
AddTextColumn(EStatus, "EMA 50 X 200", 1.6, colorWhite, E_col,-1);
AddColumn(RSI(50),"RSI 50",1.2,	colorBlack,colorWhite,-1);
AddTextColumn(RStatus, "RSI     50", 1.6, colorWhite, R_col,-1);
AddColumn(ml,"MACD 50",1.2,	colorBlack,colorWhite,-1);
AddTextColumn(MStatus, "MACD", 1.6, colorWhite, M_col,-1);


//AddColumn(G,"O Low%",1.2,-1);
//AddColumn(F,"C High%",1.2,-1);
//AddColumn(ADX(10),"ADX-10",1.2,IIf(ADX(10) > Ref(ADX(10),-1), colorGreen, colorRed),-1);

//AddTextColumn(Tbuy_status, "T3-Signal", 1.6, colorWhite, T_Col,-1);
//AddTextColumn(Gbuy_status, "Guppy", 1.6, colorWhite, G_Col,-1);
//AddTextColumn(MA_status, "EMA-9", 1.6, colorWhite, MA_Col,-1);
//AddTextColumn(MA2_status, "EMA-20", 1.6, colorWhite, MA2_Col,-1);
///AddTextColumn(MA3_status, "EMA-9x20", 1.6, colorWhite, MA3_Col,-1);
//AddTextColumn(Ibuy_status, "RSI signal", 1.6, colorWhite, I_Col,-1);
//AddTextColumn(adx_status, "Trend", 1.6, colorWhite, adx_Col,-1);
//AddTextColumn(cop_status, "Coppock", 1.6, colorWhite, cop_Col,-1);
//AddTextColumn(wad_status, "WAD", 1.6, colorWhite, WAD_Col,-1);
//AddTextColumn(mt_status, "EMA-50", 1.6, colorWhite, mt_Col,-1);
//AddTextColumn(lt_status, "EMA-200", 1.6, colorWhite, lt_Col,-1);
//AddTextColumn(ltp, "Phase", 1.6, colorWhite, ltp_Col,-1);
5 comments
Leave Comment
Please login here to leave a comment.
Back
When i try to run this code its showing lots of errors. Please do rectify the errors
how to read this exploration? what is the use of various colors there? please explain. thanks!
Good.. and thanks… :)
its very nice and helpful,
thanks…..
thanks sir