Stock Portfolio Organizer
The ultimate porfolio management solution.
Shares, Margin, CFD's, Futures and Forex
EOD and Realtime
Dividends and Trust Distributions
And Much More ....
WiseTrader Toolbox
#1 Selling Amibroker Plugin featuring:
Advanced Adaptive Indicators
Advanced Pattern Exploration
Neural Networks
And Much More ....
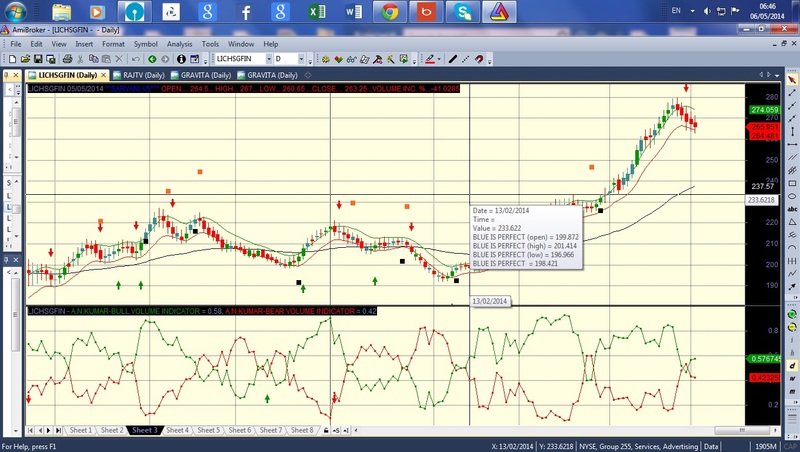
V2.BULL BEAR CROSSOVER for Amibroker (AFL)
Rating:
4 / 5 (Votes 3)
Tags:
trading system, amibroker
Hi…inadvertently, I used the variable “C” at lines 6,8 in my earlier
version of BULL BEAR CROSSOVER. Since “C” refers to “close”, I shouldnt have
used it. Though the indicator is giving good results, My thought of the
indicator was perhaps wrongly represented. Hence, I made this VERSION 2. This is
only the replacing C with some other letter. The indicator has become slightly
slow, but confusion at BUBBLE SQUEEZE area is vastly removed. Kindly check.
Screenshots
Similar Indicators / Formulas
EMA crossover
Submitted
by Ketan-0 about 13 years ago
Kase Peak Osc. V2 batu
Submitted
by batu1453 almost 10 years ago
Kase CD V2batu
Submitted
by batu1453 almost 10 years ago
Ichimoku
Submitted
by prashantrdx almost 10 years ago
buy and sell two EMAS
Submitted
by mundo0007 about 12 years ago
Adaptive Price Zone (APZ)
Submitted
by AndrewThomas about 13 years ago
Indicator / Formula
Copy & Paste Friendly
X=((C-Ref(C,-1))/(HHV(H,2)-LLV(L,2)));
A=0;
A=IIf(C>Ref(C,-1),A+(X*V),A+0);/*portion of bull volume*/

B=0;
B=IIf(C<=Ref(C,-1),B+(X*V),B+0);/*portion of bear volume*/
I=Sum(A,10);
D=Sum(B,10);
E=(I/(I-D));


F=-(D/(I-D));


G=0;
H=0;


Buy=Cross(E,F) AND EMA(E,5)>EMA(E,10) AND E>0.55;

Sell=E<0.85 AND Ref(E,-1)>0.85  ;
Buy=ExRem(Buy,Sell);
Sell=ExRem(Sell,Buy);


shbuy=Buy*shapeUpArrow;

shsell=Sell*shapeDownArrow;

Plot(E,"A.N.KUMAR-BULL VOLUME INDICATOR",colorGreen,style=styleDots);

Plot(F,"A.N.KUMAR-BEAR VOLUME INDICATOR",colorRed,style=styleDots);
PlotShapes(Buy*shapeUpArrow,colorGreen,Layer=0,yposition=H,Offset=50);
PlotShapes(Sell*shapeDownArrow,colorRed,Layer=0,yposition=H,Offset=-50);
4 comments
Leave Comment
Please login here to leave a comment.
Back
Hi, Thanks for sharing the indicator.
Also can you please let us know best time frame & stocks for which indicator performance is good.
Hi..the indicator was based on EOD DATA. But, I strongly believe, it should work
for intraday also.
Respected admin, I want to provide a revised code for choosing custom period through parameter. I tried earlier by giving here, but it is not pasting properly. If possible, kindly help.
sir, thanks a lot for the help