Stock Portfolio Organizer
The ultimate porfolio management solution.
Shares, Margin, CFD's, Futures and Forex
EOD and Realtime
Dividends and Trust Distributions
And Much More ....
WiseTrader Toolbox
#1 Selling Amibroker Plugin featuring:
Advanced Adaptive Indicators
Advanced Pattern Exploration
Neural Networks
And Much More ....
Swing Trading System for Amibroker (AFL)
Rating:
3 / 5 (Votes 5)
Tags:
trading system, amibroker, swing
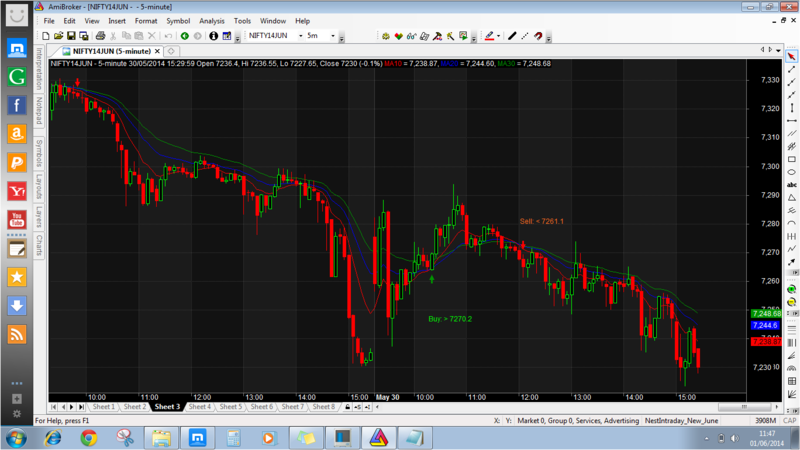
Very simple formula but nice results.
Buy above High and Sell below Low
Green line is Trailing Stop loss line
Screenshots
Similar Indicators / Formulas
NMA Swing System v1.1
Submitted
by kaiji over 14 years ago
Señales de entrada y salida
Submitted
by yayo88 over 10 years ago
NMA indicator with Button Trading
Submitted
by rohan.joshi55 over 10 years ago
Cumulative Value
Submitted
by mfoysalar about 14 years ago
LANDIS Modified
Submitted
by isfandi about 13 years ago
Indicator / Formula
Copy & Paste Friendly
_SECTION_BEGIN("");
SetChartOptions(0,chartShowArrows|chartShowDates);
_N(Title = StrFormat("{{NAME}} - {{INTERVAL}} {{DATE}} Open %g, Hi %g, Lo %g, Close %g (%.1f%%) {{VALUES}}", O, H, L, C, SelectedValue( ROC( C, 1 ) ) ));
Plot( C, "Close", ParamColor("Color", colorBlack ), styleNoTitle | ParamStyle("Style") | GetPriceStyle() );
_SECTION_END();

_SECTION_BEGIN("Swing Trading System");

InitStop = 20; //11;
TRStop = EMA(Close,30);// 84;

Buy = Cross( EMA( Close, 10 ), EMA( Close, 20 )) AND EMA(Close,10) > EMA(Close,20) AND EMA(Close,20) AND EMA(Close,30)-1;
Sell = Cross( EMA( Close, 30 ), EMA( Close, 20 )) AND EMA(Close,30) > EMA(Close,20) AND EMA(Close,10) AND EMA(Close,20)-1;
Short = Sell;
Cover=Buy;

BuyPrice		= ValueWhen(Buy, High);
ShortPrice		= ValueWhen(Short, Low);
CoverPrice		= ValueWhen(Cover, Close);
SellPrice		= ValueWhen(Sell, Close);


dist = 1.5*ATR(10);

for( i = 0; i < BarCount; i++ )
{
if( Buy[i] ) PlotText( "Buy: > " + H[ i ], i, L[ i ] - dist[i], colorBrightGreen); // alteration - C instead of H/L
if( Sell[i] ) PlotText( "Sell: < " + L[ i ], i, H[ i ] + dist[i], colorOrange);
}

PlotShapes(IIf(Sell==1, shapeDownArrow, shapeNone), colorRed, 0,High, Offset=-15);
PlotShapes(IIf(Buy==1, shapeUpArrow , shapeNone), colorGreen, 0,Low, Offset=-15);

Plot( EMA( Close,10),"MA10",colorRed,styleLine);
Plot( EMA( Close,20),"MA20",colorBlue,styleLine);
Plot( EMA( Close,30),"MA30",colorGreen,styleLine);

ApplyStop(stopTypeTrailing, stopModePoint, TRStop, 0, False, 0);
ApplyStop(stopTypeLoss, stopModePoint, InitStop, 0, False, 0);


_SECTION_END();


_SECTION_BEGIN("Stoploss");
//no=10;
//res=HHV(H,no);
//sup=LLV(L,no);
//avd=IIf(C>Ref(res,-1),1,IIf(C<Ref(sup,-1),-1,0));
//avn=ValueWhen(avd!=0,avd,1);
//supres=IIf(avn==1,sup,res);

//color=IIf(avn==1,colorPaleGreen,colorOrange);
//Plot(supres,"Stoploss",color,styleStaircase|styleThick|styleNoTitle);
_SECTION_END();

//Settings for Backtesting to keep lot size fixed // Need help here
SetOption("MaxOpenPositions",1);
RoundLotSize = 125;
SetOption("MinShares",RoundLotSize);
PositionSize = C*125*2;
//End of Backtesting Settings for Backtester
6 comments
Leave Comment
Please login here to leave a comment.
Back
yes it is simple but, it does alot, thanks dear for sharing
I’m confused why would you BUY above High and Sell below Low ??
Dick
This formula looks really good but the question is what is meant under high and low?
I think buy/sell should be done after appearance of the relevant arrow..
Am I right? )
Check crossovers, red line is on top = market is bullish, Red line is on bottom = market is on bearish.
(I’m confused why would you BUY above High and Sell below Low ??)
For breakout
We need to wait for breakout for better results