Stock Portfolio Organizer
The ultimate porfolio management solution.
Shares, Margin, CFD's, Futures and Forex
EOD and Realtime
Dividends and Trust Distributions
And Much More ....
WiseTrader Toolbox
#1 Selling Amibroker Plugin featuring:
Advanced Adaptive Indicators
Advanced Pattern Exploration
Neural Networks
And Much More ....
Kase Peak Osc. V2 batu for Amibroker (AFL)
Rating:
3 / 5 (Votes 8)
Tags:
trading system, amibroker
This is modified but near to original formula of Kase PO
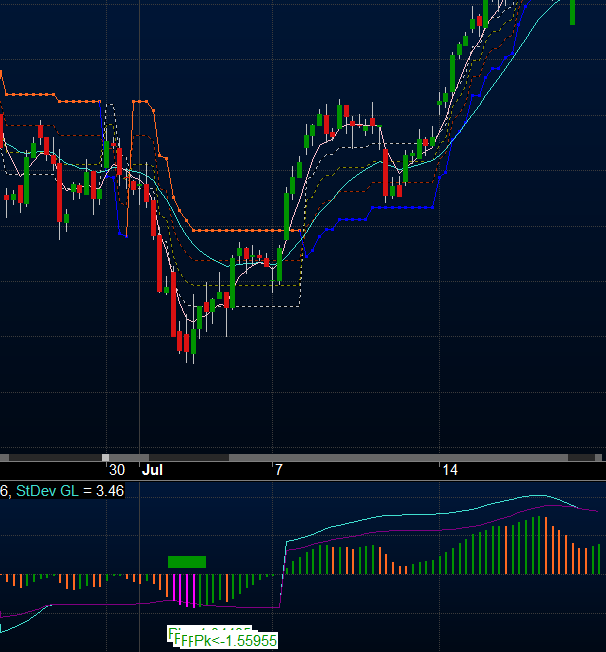
Screenshots
Similar Indicators / Formulas
EMA crossover
Submitted
by Ketan-0 about 13 years ago
Kase CD V2batu
Submitted
by batu1453 almost 10 years ago
Ichimoku
Submitted
by prashantrdx almost 10 years ago
buy and sell two EMAS
Submitted
by mundo0007 about 12 years ago
Adaptive Price Zone (APZ)
Submitted
by AndrewThomas about 13 years ago
Pride System Modified
Submitted
by niladri about 12 years ago
Indicator / Formula
Copy & Paste Friendly
_SECTION_BEGIN("Kase Peak Osc Orginal V2.batu");
Per1=Param("Max Length",55,2,200,1);
Per2=Param("Min Length",13,2,200,1);
RWH=RWIHi(Per2,Per1);
RWL=RWILo(Per2,Per1);
Pk=WMA((RWH-RWL),3);
MN=MA(Pk,Per1);
SD=StDev(Pk,Per1);
Val1=Max(MN+(2*SD),2.2*SD);
Val2=Min(MN-(2*SD),-2.2*SD);
Val3=Max(MN+(2*SD),3*SD);
Val4=Min(MN-(2*SD),-3*SD);
LN1=IIf(PK>=0,Val1,Val2);
LN2=IIf(PK>=0,Val3,Val4);
Red=IIf(Ref(Pk,-1)>Pk,Pk,0);
Green=IIf(Pk>Ref(Pk,-1),Pk,0);


WriteIf( Val2>=Pk, "Buraya yazabilirsin", "Buraya yazılıyor" );


Buy= IIf(Pk<Val2,Val2>=Pk-0.01,Val2>=Pk);
Sell= IIf(Pk>Val1,Pk+0.01>=Val1,Pk>=Val1);

for( i = 0; i < BarCount; i++ )
 {
if( Buy[i] ) PlotText( "Pk<" + Val2[ i ], i, Pk[ i ]-2, colorGreen,colorWhite);
if( Sell[i] ) PlotText( "Pk>" + Val1[ i ], i, Pk[ i ]+2, colorRed,colorWhite);
  }

PlotShapes( Buy *18,IIf( Buy, colorGreen, colorRed ),0,0);
PlotShapes(Sell * 17, IIf( Buy, colorGreen, colorRed ),0,0);


Buy= IIf(Pk<Val4,Val4>=Pk-0.01,Val4>=Pk);
Sell= IIf(Pk>Val3,Pk+0.01>=Val3,Pk>=Val3);
Plot(Red,"Red min "+per2+"-max "+per1,IIf(Buy,11,colorOrange),styleHistogram|styleThick,Null,Null,0,1);
Plot(Green,"Green min"+per2+"-max "+per1,IIf(Sell,11,colorGreen),styleHistogram|styleThick,Null,Null,0,1);
Plot(LN1,"StDev Loc",colorViolet,styleLine);
Plot(ln2,"StDev GL",colorTurquoise,styleLine);
_SECTION_END();
0 comments
Leave Comment
Please login here to leave a comment.
Back