Stock Portfolio Organizer
The ultimate porfolio management solution.
Shares, Margin, CFD's, Futures and Forex
EOD and Realtime
Dividends and Trust Distributions
And Much More ....
WiseTrader Toolbox
#1 Selling Amibroker Plugin featuring:
Advanced Adaptive Indicators
Advanced Pattern Exploration
Neural Networks
And Much More ....
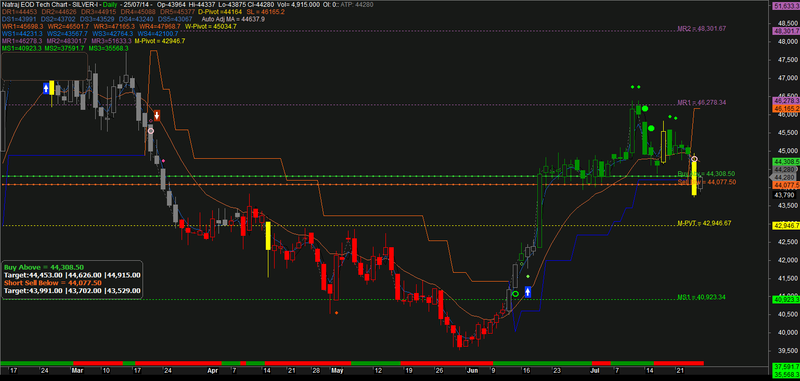
Natraj EOD Tech Chart for Amibroker (AFL)
Rating:
3 / 5 (Votes 9)
Tags:
pivot, amibroker, resistance
This Indicator has been modified from my previous AFL (Natraj Pivot Chart for Amibroker (AFL))which has been posted before 3 years.
http://www.wisestocktrader.com/indicators/1684-natraj-pivot-chart
This Consists of Day, Weekly & Monthly Pivot Support Resistant Levels.
Some of the interesting addons included are Fibo Levels, ATP, Auto MAvg,
Daily Technical Breakout Levels,Super Trend Buy sell Indicator & switching Bar/candle.
Check out Parameter window.
Screenshots
Indicator / Formula
Copy & Paste Friendly
_SECTION_BEGIN("Natraj EOD Tech Chart");
GraphXSpace = 15;
SetBarsRequired(200,0);
SetChartOptions(0,chartShowArrows|chartShowDates);
_SECTION_BEGIN("Controls");
pvk=IIf(ParamList("select type","Daily|NextDay")=="Daily",-1,0);
Dpt = ParamToggle("Plot Day Pivot","Off|On",1);
Wpt = ParamToggle("Plot Week Pivot","Off|On",1);
Mpt = ParamToggle("Plot Month Pivot","Off|On",1);
BSpt = ParamToggle("Plot BS Levels","Off|On",1);
Super=ParamToggle("Super","Off|On",1);
fibs = ParamToggle("Plot Fibs","Off|On",0);
fsma=ParamToggle("Moving Avg","Off|On",1);
_SECTION_END();
_SECTION_BEGIN("Price Movement");

bullish=IIf((PDI(42)>MDI(42)) AND (PDI(14)>MDI(14)),1,0);
bearish=IIf((PDI(42)<MDI(42)) AND (PDI(14)<MDI(14)),1,0);
barcolor= colorBlack;
yello=IIf(((H>Ref(H,1)) AND(H>Ref(H,2)) AND(H>Ref(H,3)) AND(Ref(C,4)>0) AND(L<Ref(L,1)) AND(L<Ref(L,2)) AND(L<Ref(L,3))),1,0);
nocol=IIf(NOT(bullish OR bearish),1,0);
Col=bullish*colorGreen + bearish*colorRed+nocol*colorGrey50;
Colr=IIf(yello,colorYellow,Col);
//col=IIf(state == 1 ,43,IIf(state ==0,4,1));
Plot(C,"",Colr,Param("chart Type",128,64,128,64));

period=Param("Period",34,10,100);
RWH=(High-Ref(Low,-period))/(ATR(period)*sqrt(period));
RWL=(Ref(H,-period)-L)/(ATR(period)*sqrt(period));
Pk=WMA((RWH-RWL),3);
MN=MA(Pk,period);
SD=StDev(Pk,period);
Val1=IIf(MN+(1.33*SD)>2.08,MN+(1.33*SD),2.08);
Val2=IIf(MN-(1.33*SD)<-1.92,MN-(1.33*SD),-1.92);
ln1=IIf(Ref(Pk,-1)>=0 AND Pk>0,Val1,IIf(Ref(Pk,-1)<=0 AND Pk<0,Val2,0));
Red=IIf(Ref(Pk,-1)>Pk,Pk,0);
Green=IIf(Pk>Ref(Pk,-1),Pk,0);

tip=IIf(green>ln1 AND green>1,1,0);
bip=IIf(red<ln1 AND red<-1,1,0);
top=IIf(red>ln1 AND red>1,1,0);
bottom=IIf(green<ln1 AND green<-1,1,0);

printf("\nGreen" + WriteVal(green));
printf("\nRed" + WriteVal(red));
printf("\nLN" + WriteVal(ln1));
printf("\nRWH" + WriteVal(RWH));
printf("\nRWL" + WriteVal(RWL));
printf("\npk" + WriteVal(pk));
printf("\nMN" + WriteVal(MN));
printf("\nSD" + WriteVal(SD));
printf("\nVAL1" + WriteVal(Val1));
printf("\nVAL2" + WriteVal(Val2));

tshape=tip*shapeSmallCircle + bip*shapeSmallCircle + top*shapeCircle + bottom*shapeCircle ;

PlotShapes( tshape, IIf( tip OR top, colorBrightGreen, ColorRGB(230,75,0)), 0, IIf( bip OR bottom, Low, High ),IIf(bip OR bottom,-25,25) );

Prev_Close= TimeFrameGetPrice( "C", inDaily, -1, expandFirst) ;
Plot(prev_close,"Privious Close",colorBlack);
_SECTION_END();
if(fsma==1)
{
_SECTION_BEGIN("FAST");
Periods = Param("periods", 3, 2, 300,1);
Plot( EMA( C, Periods ),_DEFAULT_NAME(), ParamColor("colorfast",ColorRGB(27,96,201)), styleNoLabel,styleDashed);
_SECTION_END();
_SECTION_BEGIN("SLOW");
Periods = Param("periods",13, 2, 300, 1);
Plot( EMA( C, Periods ), _DEFAULT_NAME(),ParamColor("colorslow", ColorRGB(225,105,50)),styleNoLabel,styleDashed);
_SECTION_END();}

_SECTION_BEGIN("Fib Retracements");
	pctH = Param ("Pivot Hi %", 0.325,0.001,2.0,0.002);
	HiLB = Param ("Hi LookBack",1,1,BarCount-1,1);
	pctL = Param ("Pivot Lo %", 0.325,0.001,2.0,0.002);
	LoLB = Param ("Lo LookBack",1,1,BarCount-1,1);
	Back = Param ("Extend Left = 2",1,1,500,1);
	Fwd  = Param("Plot Forward", 0, 0, 500, 1);
	hts  = Param ("Text Shift", 1.4,-50,50,0.10);
	style =ParamStyle("Line Style",styleLine,styleNoLabel);
x = BarIndex();
pRp  = PeakBars( H, pctH, 1) == 0;
yRp0 = SelectedValue(ValueWhen( pRp, H, HiLB));
xRp0 = SelectedValue(ValueWhen( pRp, x, HiLB));
pSp  = TroughBars( L, pctL, 1) == 0;
ySp0 = SelectedValue(ValueWhen( pSp, L, LoLB));
xSp0 = SelectedValue(ValueWhen( pSp, x, LoLB));
Delta = yRp0 - ySp0;

function fib(ret)
{
retval = (Delta * ret);
Fibval = IIf(ret < 1.0
AND xSp0 < xRp0, yRp0 - retval, IIf(ret < 1.0
AND xSp0 > xRp0, ySp0 + retval,IIf(ret > 1.0
AND xSp0 < xRp0, yRp0 - retval, IIf(ret > 1.0
AND xSp0 > xRp0, ySp0 + retval, Null))));
return FibVal;
}

x0 = Min(xSp0,xRp0)-Back;
x1 = (BarCount -1);
//////////////////////////////////////////////////////////////////
r236 = fib(0.236);	r236I = LastValue (r236,1);
r382 = fib(0.382);	r382I = LastValue (r382,1);
r050 = fib(0.50);		r050I = LastValue (r050,1);
r618 = fib(0.618);	r618I = LastValue (r618,1);
r786 = fib(0.786);	r786I = LastValue (r786,1);
e127 = fib(1.27);		e127I = LastValue (e127,1);
e162 = fib(1.62);		e162I = LastValue (e162,1);
e200 = fib(2.00);		e200I = LastValue (e200,1);
e262 = fib(2.62);		e262I = LastValue (e262,1);
e424 = fib(4.24);		e424I = LastValue (e424,1);
//////////////////////////////////////////////////////////////////
p00 = IIf(xSp0 > xRp0,ySp0,yRp0); 	p00I = LastValue (p00,1);
p100 = IIf(xSp0 < xRp0,ySp0,yRp0); 	p100I = LastValue (p100,1);
color00 =IIf(xSp0 > xRp0,colorLime,colorRed);
color100 =IIf(xSp0 < xRp0,colorLime,colorRed);
//////////////////////////////////////////////////////////////////
numbars = LastValue(Cum(Status("barvisible")));
fraction= IIf(StrRight(Name(),3) == "", 3.2, 3.2);
//////////////////////////////////////////////////////////////////
if(fibs==1)
{
Plot(LineArray(xRp0-Fwd,yRp0,x1,yRp0,Back),"PR",32,8|styleNoRescale,Null, Null,Fwd);
Plot(LineArray(xSp0-Fwd,ySp0,x1,ySp0,Back),"PS",27,8|styleNoRescale,Null, Null,Fwd);
Plot(LineArray(x0-Fwd,r236,x1,r236,Back),"",45,style|styleNoRescale,Null, Null,Fwd);
Plot(LineArray(x0-Fwd,r382,x1,r382,Back),"",44,style|styleNoRescale,Null, Null,Fwd);
Plot(LineArray(x0-Fwd,r050,x1,r050,Back),"",41,style|styleNoRescale,Null, Null,Fwd);
Plot(LineArray(x0-Fwd,r618,x1,r618,Back),"",43,style|styleNoRescale,Null, Null,Fwd);
Plot(LineArray(x0-Fwd,r786,x1,r786,Back),"",42,style|styleNoRescale,Null, Null,Fwd);
Plot(LineArray(x0-Fwd,e127,x1,e127,Back),"e127",47,style|styleNoRescale,Null, Null,Fwd);
Plot(LineArray(x0-Fwd,e162,x1,e162,Back),"e162",47,style|styleNoRescale,Null, Null,Fwd);
Plot(LineArray(x0-Fwd,e200,x1,e200,Back),"p200",47,style|styleNoRescale,Null, Null,Fwd);
Plot(LineArray(x0-Fwd,e262,x1,e262,Back),"p262",47,style|styleNoRescale,Null, Null,Fwd);
Plot(LineArray(x0-Fwd,e424,x1,e424,Back),"p424",25,style|styleNoRescale,Null, Null,Fwd);
}
//////////////////////////////////////////////////////////////////
if(fibs==1)
{
PlotText(" 0% = " + WriteVal(p00,fraction), 	LastValue(BarIndex())-(numbars/hts), p00I  + 0.05, color00);
PlotText("23% = " + WriteVal(r236,fraction), LastValue(BarIndex())-(numbars/hts), r236I + 0.05, 45);
PlotText("38% = " + WriteVal(r382,fraction), LastValue(BarIndex())-(numbars/hts), r382I + 0.05, 44);
PlotText("50% = " + WriteVal(r050,fraction), LastValue(BarIndex())-(numbars/hts), r050I + 0.05, 41);
PlotText("62% = " + WriteVal(r618,fraction), LastValue(BarIndex())-(numbars/hts), r618I + 0.05, 43);
PlotText("78% = " + WriteVal(r786,fraction), LastValue(BarIndex())-(numbars/hts), r786I + 0.05, 42);
PlotText("100% = " + WriteVal(p100,fraction), LastValue(BarIndex())-(numbars/hts),p100I + 0.05, color100);
PlotText("127% = " + WriteVal(e127,fraction), LastValue(BarIndex())-(numbars/hts),e127I + 0.05, 47);
PlotText("162% = " + WriteVal(e162,fraction), LastValue(BarIndex())-(numbars/hts),e162I + 0.05, 47);
PlotText("200% = " + WriteVal(e200,fraction), LastValue(BarIndex())-(numbars/hts),e200I + 0.05, 47);
PlotText("262% = " + WriteVal(e262,fraction), LastValue(BarIndex())-(numbars/hts),e262I + 0.05, 47);
PlotText("424% = " + WriteVal(e424,fraction), LastValue(BarIndex())-(numbars/hts),e424I + 0.05, 25);
}
_SECTION_END();

_SECTION_BEGIN("Super");

GraphXSpace = 5;
SetChartOptions(0,chartShowArrows|chartShowDates);
k =  Optimize("K",Param("K",3.2,0.10,15,0.10),0.10,5,0.10);
Per= Optimize("atr",Param("atr",5,3,120,1),3,120,1);
HACLOSE=(O+H+L+C)/4;
HaOpen = AMA( Ref( HaClose,  -1 ),  0.5 );
HaHigh = Max( H,  Max( HaClose,  HaOpen ) );
HaLow = Min( L,  Min( HaClose,  HaOpen ) );


//=======================================================================================================================
//=========================Indicator==============================================================================================


Lucky=ATR(per);
revers=k * Lucky;
Trend = 1;
NW[0] = 0;


for(i = 1; i < BarCount; i++)
{
 if(Trend[i-1] == 1)
 {
  if(L[i] < NW[i-1])
  {
   Trend[i] = -1;
   NW[i] = L[i] + Revers[i];
  }
  else
  {
   Trend[i] = 1;
   if((L[i] - Revers[i]) > NW[i-1])
   {
    NW[i] = H[i] - Revers[i];
   }
   else
   {
    NW[i] = NW[i-1];
   }
  }
 }
 if(Trend[i-1] == -1)
 {
  if(H[i] > NW[i-1])
  {
   Trend[i] = 1;
   NW[i] = H[i] - Revers[i];
  }
  else
  {
   Trend[i] = -1;
   if((H[i] + Revers[i]) < NW[i-1])
   {
    NW[i] = L[i] + Revers[i];
   }
   else
   {
    NW[i] = NW[i-1];
   }
  }
 }
}

//===============system================


TMB=EMA(C,12);
TMS=EMA(C,21);
BC=Cross(H,NW);
SC=Cross(NW,L);
BX=SC;
SX=BC;


Buy= BC AND TMB  > TMS OR  Cross(TMB, TMS) AND EMA(C,1) > NW OR C > NW AND TMB > TMS;
Short=SC AND TMB  < TMS OR Cross(TMS, TMB) AND EMA(C,1) < NW OR C < NW AND TMB < TMS;
Buy=ExRem(Buy,BX);
BX=ExRem(BX,Buy);
Short=ExRem(Short,SX);
SX=ExRem(SX,Short);
ShortPrice=ValueWhen(Short,C,1);
BuyPrice=ValueWhen(Buy,C,1);
Long=Flip(Buy,BX);
Shrt=Flip(Short,SX );


LX1=Cross(EMA(C,21),EMA(C,9)) ;
LX2=Cross(EMA(C,26),EMA(C,12));

SX1=Cross(EMA(C,9),EMA(C,21)) ;
SX2=Cross(EMA(C,12),EMA(C,26)) ;

if(Super==1) {
Plot(NW, "", IIf(Trend == 1, colorBlue,ColorRGB(255,105,21)),styleLine);
shape = SX * shapeHollowCircle + BX * shapeHollowCircle;
PlotShapes( shape, IIf( SX, colorBrightGreen, colorPink ),0, IIf( SX, Low, High ) );
PlotShapes( shapeHollowSmallCircle * LX1, ColorRGB(255,70,150),0,H,Offset = 7);
PlotShapes(shapeSmallCircle * LX2, ColorRGB(255,70,150), 0,H,Offset = 15);

PlotShapes( shapeHollowSmallCircle * SX1, ColorRGB(122,255,77),0,L,Offset = -7);
PlotShapes(shapeSmallCircle * SX2, ColorRGB(122,255,77), 0,L,Offset = -15);

PlotShapes(IIf(Buy, shapeSquare, shapeNone),ColorRGB(10,60,255), 0, L, Offset=-40);
PlotShapes(IIf(Buy, shapeSquare, shapeNone),ColorRGB(10,50,255), 0,L, Offset=-50);
PlotShapes(IIf(Buy, shapeUpArrow, shapeNone),colorWhite, 0,L, Offset=-45);
PlotShapes(IIf(Short, shapeSquare, shapeNone),colorBrown, 0, H, Offset=40);
PlotShapes(IIf(Short, shapeSquare, shapeNone),colorBrown, 0,H, Offset=50);
PlotShapes(IIf(Short, shapeDownArrow, shapeNone),colorWhite, 0,H, Offset=-45);}

_SECTION_END();

_SECTION_BEGIN("Auto Adjusted MA");

AutoMA= ParamToggle("Auto MA","Off|On",0);

Length=21;
Smooth=5;

Change = C - Ref( C, -1 );
SU = Sum( C - Ref( C, -1 ) > 0, Length );
SD = Sum( C - Ref( C, -1 ) < 0, Length );
CMO = 100 * ( SU - SD ) / ( SU + SD );

AbsCMO=( abs(CMO) )/100;

VSC=2/(Smooth+1);

VIDYA=AMA( C, VSC*AbsCMO );
if(AutoMA==1)
{
Plot( VIDYA, "Vidya",ColorRGB(226,201,208),styleLine);
_SECTION_END();}
_SECTION_BEGIN("pivots mw");
SetChartBkColor(2) ;
k1=-1;
TimeFrameSet(inDaily);
day_h= LastValue(Ref(H,pvk));
day_l= LastValue(Ref(L,pvk));
day_c= LastValue(Ref(C,pvk));
TimeFrameRestore();

TimeFrameSet(inWeekly);
Week_h= LastValue(Ref(H,K1));
Week_l= LastValue(Ref(L,K1));;
Week_c= LastValue(Ref(C,K1));;
TimeFrameRestore();

TimeFrameSet(inMonthly);
month_h= LastValue(Ref(H,K1));
month_l= LastValue(Ref(L,K1));
month_c= LastValue(Ref(C,K1));
TimeFrameRestore();

/*--------------------------------------*/
// day
DH=Day_h;
DL=Day_L;
DC=Day_C;

// DAY PIVOT Calculation
pd = ( DH+ DL + DC )/3;
sd1 = (2*pd)-DH;
sd2 = pd -(DH - DL);
sd3 = Sd1 - (DH-DL);
sd4 = Sd2 - (DH-DL);
sd5 = Sd3 - (DH-DL);
rd1 = (2*pd)-DL;
rd2 = pd +(DH -DL);
rd3 = rd1 +(DH-DL);
rd4 = rd2 +(DH-DL);
rd5 = rd3 +(DH-DL);
dp=pd;
mr1=(pd+rd1)/2; mr1I = LastValue (mr1,1);
ms1=(pd+sd1)/2; ms1I = LastValue (ms1,1);
// week
WH=Week_h;
WL=Week_l;
WC=Week_c;

// WEEK PIVOT Calculation
pw = ( WH+ WL + WC )/3;
sw1 = (2*pw)-WH;
sw2 = pw -(WH - WL);
sw3 = Sw1 - (WH-WL);
sw4 = Sw2 - (WH-WL);
rw1 = (2*pw)-WL;
rw2 = pw +(WH -WL);
rw3 = rw1 +(WH-WL);
rw4 = rw2 +(WH-WL);


// month
MH=month_h;
ML=month_l;
MC=month_c;

// MONTH PIVOT Calculation
pm = ( MH+ ML + MC )/3;
sm1 = (2*pm)-MH;
sm2 = pm -(MH - ML);
sm3 = Sm1 - (MH-ML);
rm1 = (2*pm)-ML;
rm2 = pm +(MH -ML);
rm3 = rm1 +(MH-ML);

ppl = ParamToggle("Plot Pivot Levels","Off|On",1);
numbars = LastValue(Cum(Status("barvisible")));
fraction= IIf(StrRight(Name(),3) == "", 3.2, 3.2);
hts = Param("slide all",33,-1000,1000,1);


{
if(Dpt==1) {
Plot(pd,"",colorGold,styleLine|styleDashed|styleNoRescale);
Plot(sd1,"",ColorRGB(73,123,201),styleDashed|styleNoRescale);
Plot(sd2,"",ColorRGB(73,123,201),styleDashed|styleNoRescale);
Plot(sd3,"",ColorRGB(73,123,201),styleDashed|styleNoRescale);
Plot(sd4,"",ColorRGB(73,123,201),styleDashed|styleNoRescale);
Plot(sd5,"",ColorRGB(73,123,201),styleDashed|styleNoRescale);
Plot(rd1,"",ColorRGB(150,60,39),styleDashed|styleNoRescale);
Plot(rd2,"",ColorRGB(150,60,39),styleDashed|styleNoRescale);
Plot(rd3,"",ColorRGB(150,60,39),styleDashed|styleNoRescale);
Plot(rd4,"",ColorRGB(150,60,39),styleDashed|styleNoRescale);
Plot(rd5,"",ColorRGB(150,60,39),styleDashed|styleNoRescale);}
if(BSpt==1) {
Plot(mr1,"",colorLime,styleDots|styleNoRescale);
Plot(ms1,"",colorOrange,styleDots|styleNoRescale);}
if(Wpt==1) {
Plot(pw,"",colorYellow,styleLine|styleDashed|styleNoRescale);
Plot(sw1,"",ColorRGB(9,128,250), styleDashed|styleNoRescale);
Plot(sw2,"",ColorRGB(9,128,250), styleDashed|styleNoRescale);
Plot(sw3,"",ColorRGB(9,128,250), styleDashed|styleNoRescale);
Plot(sw4,"",ColorRGB(9,128,250), styleDashed|styleNoRescale);
Plot(rw1,"",ColorRGB(207,96,39), styleDashed|styleNoRescale);
Plot(rw2,"",ColorRGB(207,96,39), styleDashed|styleNoRescale);
Plot(rw3,"",ColorRGB(207,96,39), styleDashed|styleNoRescale);
Plot(rw4,"",ColorRGB(207,96,39), styleDashed|styleNoRescale);}

if(Mpt==1) {
Plot(pm,"",colorYellow,styleLine|styleDashed|styleNoRescale);
Plot(sm1,"",colorBrightGreen, styleDashed|styleNoRescale);
Plot(sm2,"",colorBrightGreen, styleDashed|styleNoRescale);
Plot(sm3,"",colorBrightGreen, styleDashed|styleNoRescale);
Plot(rm1,"",ColorRGB(175,96,175), styleDashed|styleNoRescale);
Plot(rm2,"",ColorRGB(175,96,175), styleDashed|styleNoRescale);
Plot(rm3,"",ColorRGB(175,96,175), styleDashed|styleNoRescale);}

i=1;
if(BSpt==1) {
PlotText(" Buy Abv = " + WriteVal(mr1,fraction), LastValue(BarIndex())-(numbars/Hts), mr1 , colorLime);
PlotText(" Sell Blw = " + WriteVal(ms1,fraction), LastValue(BarIndex())-(numbars/Hts), ms1 , colorOrange);}

if(Dpt==1) {
PlotText(" D-PVT = " + WriteVal(pd,fraction), LastValue(BarIndex())-(numbars/Hts), dp, colorGold);
PlotText(" DR1 = " + WriteVal(rd1,fraction), LastValue(BarIndex())-(numbars/Hts), rd1 , ColorRGB(150,60,39));
PlotText(" DS1 = " + WriteVal(sd1,fraction), LastValue(BarIndex())-(numbars/Hts), sd1 , ColorRGB(73,123,201));
PlotText(" DR2 = " + WriteVal(rd2,fraction), LastValue(BarIndex())-(numbars/Hts), rd2 , ColorRGB(150,60,39));
PlotText(" DS2 = " + WriteVal(sd2,fraction), LastValue(BarIndex())-(numbars/Hts), sd2 , ColorRGB(73,123,201));
PlotText(" DR3 = " + WriteVal(rd3,fraction), LastValue(BarIndex())-(numbars/Hts), rd3 , ColorRGB(150,60,39));
PlotText(" DS3 = " + WriteVal(sd3,fraction), LastValue(BarIndex())-(numbars/Hts), sd3 , ColorRGB(73,123,201));
PlotText(" DR4 = " + WriteVal(rd4,fraction), LastValue(BarIndex())-(numbars/Hts), rd4 , ColorRGB(150,60,39));
PlotText(" DS4 = " + WriteVal(sd4,fraction), LastValue(BarIndex())-(numbars/Hts), sd4 , ColorRGB(73,123,201));
PlotText(" DR5 = " + WriteVal(rd4,fraction), LastValue(BarIndex())-(numbars/Hts), rd5 , ColorRGB(150,60,39));
PlotText(" DS5 = " + WriteVal(sd4,fraction), LastValue(BarIndex())-(numbars/Hts), sd5 , ColorRGB(73,123,201));}
if(Wpt==1) {
PlotText(" W-PVT = " + WriteVal(pw,fraction), LastValue(BarIndex())-(numbars/Hts), pw , colorYellow);

PlotText(" WR1 = " + WriteVal(rw1,fraction), LastValue(BarIndex())-(numbars/Hts), rw1 , ColorRGB(207,96,39));
PlotText(" WS1 = " + WriteVal(sw1,fraction), LastValue(BarIndex())-(numbars/Hts), sw1 , ColorRGB(9,128,250));
PlotText(" WR2 = " + WriteVal(rw2,fraction), LastValue(BarIndex())-(numbars/Hts), rw2 , ColorRGB(207,96,39));
PlotText(" WS2 = " + WriteVal(sw2,fraction), LastValue(BarIndex())-(numbars/Hts), sw2 , ColorRGB(9,128,250));
PlotText(" WR3 = " + WriteVal(rw3,fraction), LastValue(BarIndex())-(numbars/Hts), rw3 , ColorRGB(207,96,39));
PlotText(" WS3 = " + WriteVal(sw3,fraction), LastValue(BarIndex())-(numbars/Hts), sw3 , ColorRGB(9,128,250));
PlotText(" WR4 = " + WriteVal(rw4,fraction), LastValue(BarIndex())-(numbars/Hts), rw4 , ColorRGB(207,96,39));
PlotText(" WS4 = " + WriteVal(sw4,fraction), LastValue(BarIndex())-(numbars/Hts), sw4 , ColorRGB(9,128,250));}
if(Mpt==1) {
PlotText(" M-PVT = " + WriteVal(pm,fraction), LastValue(BarIndex())-(numbars/Hts), pm , colorYellow);

PlotText(" MR1 = " + WriteVal(rm1,fraction), LastValue(BarIndex())-(numbars/Hts), rm1 , ColorRGB(175,96,175));
PlotText(" MS1 = " + WriteVal(sm1,fraction), LastValue(BarIndex())-(numbars/Hts), sm1 , colorBrightGreen);
PlotText(" MR2 = " + WriteVal(rm2,fraction), LastValue(BarIndex())-(numbars/Hts), rm2 , ColorRGB(175,96,175));
PlotText(" MS2 = " + WriteVal(sm2,fraction), LastValue(BarIndex())-(numbars/Hts), sm2 , colorBrightGreen);
PlotText(" MR3 = " + WriteVal(rm3,fraction), LastValue(BarIndex())-(numbars/Hts), rm3 , ColorRGB(175,96,175));
PlotText(" MS3 = " + WriteVal(sm3,fraction), LastValue(BarIndex())-(numbars/Hts), sm3 , colorBrightGreen);}

}

//--end----------------------------------------------------------------------------
_SECTION_END();

/*--------------------------------------*/
BuyAbv=(pd+rd1)/2;
ShortBl=(pd+sd1)/2;

_SECTION_BEGIN("Scanning Exploration");
Filter = 1;
//AddTextColumn( FullName(), "Company Name" );
AddColumn(pd, "Pivot Point",6.2,1,colorGold);
AddColumn(BuyAbv, "Buy Above",6.2,1,colorLime);
AddColumn(rd1, "R-1",6.2,1,colorGreen);
AddColumn(rd2, "R-2",6.2,1,colorGreen);
AddColumn(rd3, "R-3",6.2,1,colorGreen);
AddColumn(rd4, "R-4",6.2,1,colorGreen);
AddColumn(ShortBl, "Short Below",6.2,1,colorOrange);
AddColumn(sd1, "S-1",6.2,1,colorBrown);
AddColumn(sd2, "S-2",6.2,1,colorBrown);
AddColumn(sd3, "S-3",6.2,1,colorBrown);
AddColumn(sd4, "S-4",6.2,1,colorBrown);

_SECTION_END();

// TEXT
"high  = "+H;
"low   =  "+L;
"close = "+C;

_SECTION_BEGIN("ATP");
Atp=ParamToggle("ATP","Off|On",1);

DayChange = Day() != Ref(Day(), -1);
AvgTradePrice = Null;
CurDayBars = 0;
CurDayCloseSum = 0;

for (i = 0; i < BarCount; i++)
{
if (DayChange[i])
{
CurDayCloseSum = C[i];
CurDayBars = 1;
}
else
{
CurDayCloseSum = CurDayCloseSum + C[i];
CurDayBars++;
}
AvgTradePrice[i] = CurDayCloseSum / CurDayBars;
}
if(Atp==1)
{
Plot(AvgTradePrice, "AvgTradePrice",colorGrey40,styleDashed);
ATP=AvgTradePrice;

_SECTION_END();}

_SECTION_BEGIN("SAR");
accel = Param("Acceleration", 0.02, 0, 1, 0.001);
mx = Param("Max. acceleration", 0.2, 0, 1, 0.001);

F_SAR = SAR(accel,mx);

colordots = IIf(F_SAR < L,ColorRGB(60,100,60),IIf(F_SAR> H,ColorRGB(100,60,60),colorWhite));

SBuy = Cross(C,F_SAR); SBuy = Ref(SBuy,-1); SBuyPrice = O;
SSell = Cross(F_SAR,C); SSell = Ref(SSell,-1); SSellPrice = O;
PSAR= ParamToggle("SAR","Off|On",0);
if(PSAR==1){
Plot(F_SAR,"\nF_SAR",colordots,styleDots|styleNoLine);}

//PlotShapes(IIf(SBuy,shapeUpArrow,shapeNone),colorBrightGreen,0,L,-15);

//PlotShapes(IIf(SSell,shapeDownArrow,shapeNone),colorRed,0,H,-15);

SBTREND=F_SAR < L;
SSTREND=F_SAR> H;
Ribbon_kol=IIf( SBTREND, colorGreen, IIf(SSTREND, colorRed,colorDarkGrey));
Plot(1, "ribbon", Ribbon_kol, styleOwnScale| styleArea|
styleNoLabel,-0.5,100);
_SECTION_END();


_SECTION_BEGIN("Title");
if( Status("action") == actionIndicator )
(
Title = EncodeColor(colorWhite)+ "Natraj EOD Tech Chart" + " - " +  Name() + " - " + EncodeColor(colorBrightGreen)+ Interval(2) + EncodeColor(colorWhite) +
 "  - " + Date() +" - "+"  "+EncodeColor(colorWhite) +"Op-"+O+"  "+"Hi-"+H+"  "+"Lo-"+L+" "+
"Cl-"+C+"  "+ "Vol= "+ WriteVal(V)+ "  "+ "OI: "+OI+":: "+EncodeColor(ColorRGB(140,140,140)) + "ATP: "+ATP+"\n" + EncodeColor(ColorRGB(175,90,59)) + "DR1="+rd1+"   "+"DR2="+rd2+"   "+"DR3="+rd3+"   "+"DR4="+rd4+"   "+"DR5="+rd5+"  "+EncodeColor(colorGold) +  "D-Pivot ="+pd+"   "+EncodeColor(colorOrange) + "SL = "+NW+"\n"+
EncodeColor(ColorRGB(73,123,201)) + "DS1="+sd1+"   "+"DS2="+sd2+"   "+"DS3="+sd3+"   "+"DS4="+sd4+"   "+"DS5="+sd5+"      "+EncodeColor(ColorRGB(226,201,208)) +  "Auto Adj MA = "+VIDYA+"\n"+
EncodeColor(colorOrange) + "WR1="+rw1+"   "+"WR2="+rw2+"   "+"WR3="+rw3+"   "+"WR4="+rw4+"   "+EncodeColor(colorYellow) + "W-Pivot = "+pw+"\n"+
EncodeColor(ColorRGB(9,128,250)) + "WS1="+sw1+"   "+"WS2="+sw2+"   "+"WS3="+sw3+"   "+"WS4="+sw4+"\n"+
EncodeColor(ColorRGB(175,96,175)) + "MR1="+rm1+"   "+"MR2="+rm2+"   "+"MR3="+rm3+"  "+EncodeColor(colorYellow) +   "M-Pivot = "+pm+"\n"+
EncodeColor(colorBrightGreen)  + "MS1="+sm1+"  "+"MS2="+sm2+"   "+"MS3="+sm3+"");


_SECTION_END();


fsma=ParamToggle("Moving Avg","Off|On",0);

if(fsma==1)
{
_SECTION_BEGIN("FAST");
Periods = Param("periods", 15, 2, 300, 1, 10 );
Plot( EMA( C, Periods ),_DEFAULT_NAME(), ParamColor("colorfast",ColorRGB(5,69,140)), styleNoLabel,styleDashed);
_SECTION_END();

_SECTION_BEGIN("SLOW");
Periods = Param("periods",30, 2, 300, 1, 10 );
Plot( EMA( C, Periods ), _DEFAULT_NAME(),ParamColor("colorslow", ColorRGB(145,60,55)),styleNoLabel,styleDashed);

_SECTION_END();

_SECTION_BEGIN("50");
Periods = Param("periods",50, 1, 300, 1);
Plot( EMA( C, Periods ), _DEFAULT_NAME(),ParamColor("colors50", ColorRGB(150,100,50)),styleNoLabel,styleDashed);

_SECTION_END();

_SECTION_BEGIN("90");
Periods = Param("periods",90, 1, 300, 1);
Plot(MA( C, Periods ), _DEFAULT_NAME(),ParamColor("colors50", ColorRGB(240,190,140)),styleNoLabel,styleDashed);

_SECTION_END();}

segretribbon= ParamToggle("Ribbon","Off|On",0);
if(segretribbon==1)
{
_SECTION_BEGIN("MID");

Periods =Param("periods",34,2,300,1,10);
Plot(EMA(C,Periods),_DEFAULT_NAME(),  ColorRGB(25,25,25),styleNoLabel,styleLine);
_SECTION_END();

_SECTION_BEGIN("UL");
Periods = Param("periods", 34, 2, 300, 1, 10 );
Plot( EMA(High, Periods ),_DEFAULT_NAME(), ColorRGB(25,50,25), styleNoLabel,styleLine);

_SECTION_END();

_SECTION_BEGIN("LL");

Periods = Param("periods", 34, 2, 300, 1, 10 );
Plot( EMA( Low, Periods ),_DEFAULT_NAME(), ColorRGB(50,25,25), styleNoLabel,styleLine);
_SECTION_END();}

_SECTION_BEGIN("Cloud Setting");
//Cloud

CloudResColor=ParamColor("CloudResColor",ColorRGB(25,33,25));
CR=EMA(H,34);
CS=EMA(L,34);

if(segretribbon == 1)
{
	PlotOHLC( CS, CS, CR,CR, "Band", CloudResColor, styleCloud | styleNoLabel|styleNoTitle);
}

_SECTION_END();


_SECTION_BEGIN("Advanced SR");

ADSR=ParamToggle("Advanced SR","Off|On",0);
if(ADSR==1)
{

per1=Param ("per1", 0.1,0.1,50,0.10);

per=per1;
x = Cum(1);
s1=L;
s11=H;
pS = TroughBars( s1, per, 1 ) == 0;
endt= SelectedValue(ValueWhen( pS, x, 1 ));
startt=SelectedValue(ValueWhen( pS, x, 2 ));
dtS =endt-startt;
endS = SelectedValue(ValueWhen( pS, s1, 1 ) );
startS = SelectedValue( ValueWhen( pS, s1, 1 ));
aS = (endS-startS)/dtS;
bS = endS;
trendlineS = aS * ( x -endt ) + bS;
g3= IIf(x>startt-10,trendlineS,-1e10);
Plot(g3,"",colorRed,styleDots,styleThick);

pR = PeakBars( s11, per, 1 ) == 0;
endt1= SelectedValue(ValueWhen( pR, x, 1 ));
startt1=SelectedValue(ValueWhen( pR, x, 2 ));
dtR =endt1-startt1;
endR = SelectedValue(ValueWhen( pR, s11, 1 ) );
startR = SelectedValue( ValueWhen( pR, s11, 1 ));
aR = (endR-startR)/dtR;
bR = endR;
trendlineR = aR * ( x -endt1 ) + bR;
g4= IIf(x>startT1-10,trendlineR,-1e10);
Plot(g4,"",colorGreen,styleDots,styleThick);
//////////////////////////////////////////////////////////////////////////////////////////////////
perc=per1;
x=BarIndex();xx=SelectedValue(x);
t1=SelectedValue(ValueWhen(PeakBars(C,perc)==0,x)) ;
H1=SelectedValue(ValueWhen(PeakBars(C,perc)==0,C)) ;
t11=SelectedValue(ValueWhen(TroughBars(C,perc)==0, x));
H11=SelectedValue(ValueWhen(TroughBars(C,perc)==0, C));
g=t1>t11;
shape=IIf(g,shapeDownArrow*(x==t1),shapeUpArrow*(x ==t11));
Color=IIf(g,colorRed,colorGreen);
PlotShapes(shape,color);
/////////////////////////////////////////////////////////////////////////////////////////////////

per=per1;

x = Cum(1);
s1=C;
s11=C;
pS = TroughBars( s1, per, 1 ) == 0;
endt= SelectedValue(ValueWhen( pS, x, 1 ));
startt=SelectedValue(ValueWhen( pS, x, 2 ));
dtS =endt-startt;
endS = SelectedValue(ValueWhen( pS, s1, 1 ) );
startS = SelectedValue( ValueWhen( pS, s1, 2 ));
aS = (endS-startS)/dtS;
bS = endS;
trendlineS = aS * ( x -endt ) + bS;
g3= IIf(x>startt-10,trendlineS,-1e10);
Plot(g3,"",colorRed,styleThick);

pR = PeakBars( s11, per, 1 ) == 0;
endt1= SelectedValue(ValueWhen( pR, x, 1 ));
startt1=SelectedValue(ValueWhen( pR, x, 2 ));
dtR =endt1-startt1;
endR = SelectedValue(ValueWhen( pR, s11, 1 ) );
startR = SelectedValue( ValueWhen( pR, s11, 2 ));
aR = (endR-startR)/dtR;
bR = endR;
trendlineR = aR * ( x -endt1 ) + bR;
g4= IIf(x>startT1-10,trendlineR,-1e10);
Plot(g4,"",colorGreen,styleThick);}
_SECTION_END();

_SECTION_BEGIN("Display");
Display= ParamToggle("Display","Off|On",1);
if(segretribbon == 1)
{

cx=Param("cxposn",610,0,1000,1);
cy=Param("cyposn",12,0,1000,1);

GfxSetBkColor(ColorRGB(23,25,23));
GfxSelectFont( "Bodoni MT",14,50, False);
GfxSetTextColor( colorWhite);
GfxTextOut("LTP: "+C+" ", cx, cy );
_SECTION_END();}

_SECTION_BEGIN("Super Display");
if(Super==1) {
Srdec = (Param("Srdecimals",2,0,7,1)/10)+1;
SrDisH=(Param("SrDisH",100,0,582,1));
SDW=(Param("SDW",0,0,582,1));
GfxSetOverlayMode( mode = 0 );
GfxSelectPen( ColorRGB(99,69,55), 1 );
GfxSelectSolidBrush(ColorRGB(23,25,23));
GfxRoundRect( 2+SDW,0+SrDisH,169+SDW,55+SrDisH, 15, 15 );
GfxSetBkMode(1);
GfxSelectFont( "Times New Roman",9, 700, False );
GfxSetTextAlign(0);
GfxSetTextColor( colorRed);
GfxTextOut( WriteIf(Long AND NOT Buy, "Long StopLoss: "+WriteVal(NW,Srdec),""),8+SDW,5+SrDish);
GfxSetTextColor(ColorRGB(0,204,0));
GfxTextOut( WriteIf(shrt AND NOT Short, "Short StopLoss: "+WriteVal(NW,Srdec ),""),8+SDW,5+SrDish);
GfxSetTextColor(colorGreen);
GfxTextOut( WriteIf(Buy , "Go Long = "+WriteVal(C,Srdec),""), 8+SDW, 20+SrDisH);
GfxSetTextColor(colorRed);
GfxTextOut( WriteIf(Short , "Go Short = "+WriteVal(C,Srdec),""),8+SDW, 20+SrDisH);
GfxSetTextColor( colorGreen);
GfxTextOut( WriteIf( Long AND NOT Buy, "Buy Entry @  = "+WriteVal(BuyPrice,Srdec),""),8+SDW, 20+SrDisH);
GfxSetTextColor(colorRed);
GfxTextOut( WriteIf( shrt AND NOT Short, "Sell Entry @ = "+WriteVal(ShortPrice,Srdec ),""),8+SDW, 20+SrDisH);
GfxSetTextColor(colorLime);
GfxTextOut( WriteIf(BX , "Booked Buy Profit =  "+WriteVal(C-BuyPrice,Srdec),""),8+SDW, 35+SrDisH);
GfxSetTextColor(colorRed);
GfxTextOut( WriteIf(SX , "Booked Short Profit =  "+WriteVal(ShortPrice-C,Srdec),""),8+SDW, 35+SrDisH);
GfxSetTextColor( colorGold);
GfxTextOut( WriteIf( Long AND NOT Buy, "Buy Profit      = "+WriteVal(C-BuyPrice,Srdec ),""),8+SDW, 35+SrDisH);
GfxTextOut( WriteIf( shrt AND NOT Short, "Sell Profit     = "+WriteVal(ShortPrice-C,Srdec ),""),8+SDW, 35+SrDisH);}
_SECTION_END();

_SECTION_BEGIN("Tech Sys");
if(BSpt==1) {
ATSdec = (Param("ATSdecimals",2,0,7,1)/10)+1;
ATSDisH=(Param("ATSDisH",500,0,582,1));
ATSW=(Param("ATSW",0,0,582,1));
GfxSetOverlayMode( mode = 0 );
GfxSelectPen( colorGrey50, 1 );
GfxSelectSolidBrush(ColorRGB(23,25,23));
GfxRoundRect( 2+ATSW, 0+ATSDisH,275+ATSW,75+ATSDisH,15,15);
GfxSetBkMode(1);
GfxSelectFont( "Tahoma", 10, 700, False );
GfxSetTextAlign(0);
GfxSetTextColor(colorLime);
GfxTextOut( WriteIf(mr1 , "Buy Above = "+WriteVal(mr1,ATSDec),""),8+ATSW, 5+ATSDisH);
GfxSetTextColor(colorWhite);
GfxTextOut("Target:"+WriteVal(rd1,ATSDec)+" |"+WriteVal(rd2,ATSDec)+" |"+WriteVal(rd3,ATSDec),8+ATSW,20+ATSDisH);
GfxSetTextColor(colorOrange);
GfxTextOut( WriteIf(ms1 , "Short Sell Below = "+WriteVal(ms1,ATSdec),""), 8+ATSW, 35+ATSDisH);
GfxSetTextColor(colorWhite);
GfxTextOut("Target:"+WriteVal(sd1,ATSDec)+" |"+WriteVal(sd2,ATSDec)+" |"+WriteVal(sd3,ATSDec),8+ATSW,50+ATSDisH);
}
_SECTION_END();


_SECTION_BEGIN("Background Color");
BKswitch = ParamToggle("Background Color","On,Off");

OUTcolor = ParamColor("Outer Panel Color",ColorRGB(25,25,25));
INUPcolor = ParamColor("Inner Panel Upper",ColorRGB(23,25,23));
INDNcolor = ParamColor("Inner Panel Lower",ColorRGB(23,25,23));
TitleColor = ParamColor("Title Color ",ColorRGB(23,25,23));

if (NOT BKswitch)
{
SetChartBkColor(OUTcolor); // color of outer border
SetChartBkGradientFill(INUPcolor,INDNcolor,TitleColor); // color of inner panel
}
_SECTION_END();
24 comments
Leave Comment
Please login here to leave a comment.
Back
Hai Nataraj Sir ; thanks for posting such a nice combo AFL .
Keep on posting such useful AFLs .
Welcome k3325 sir, I will try my best.
Sir How to change to candlestick chart please guide me also suggest targets for your signals it will be very effective if you do so.thank you,
Hi arunajho,
Go to Parameter window(right click in chart window), then click second option in Price Movement ::::click chart type to 128 to 64(click left mouse button)
then press ok .. now change bar chart to candle stick chart.
Simple my strategy is Buy Above:- MR1=(Pivot + Resistant 1)/2; Target R1,R2 or between levels.
Short Below:- MS1=(pivot + Support1)/2; Short below this Level.Target S1,S2 or between levels.
Nice AFl Thanks for sharing
Thank You @ vinitmagar
nataraj sir
can we use this for intrday? if yes what changes i have to do? what should be the time frame?
ravi
_*Hi Nataraj,
Thanks For the Indicator.. Looking Seems Intreasting.. Can we use this for Intraday..If yes what will be the Time frame… 3 Mins time frame looking good.. Is it? Can you please elaborate how to use the indicator.
Once again thanks for the Indicator…
Ashok*_
@ niklravi sir, Time Frame dosn’t matter, Buy above sell below based on pivot support resistant level.
@bollepalli, Thank you sir,
BUY Above, Go to Buy, Stoploss & Reversal Trade in Shortsell below,
Short Sell Below, Go to Short, Stoploss & Reversal in Buy Above.
Super Indicator 3 Minutes & 5 Minutes Time Frame is good. But Personally I Use in Trade
One Minute Time Frame(Only Intraday). Use With Some Filter Indicator like RSI & MACD in High Time Frame.
Thanku Nataraj… :)
One Minute Looking very Interesting.. Let me try on Monday
@esnataraj – Great Work.
I also use similar analysis.
Buy, Sell concept is very nice here.
Keep up the good work.
Thanks,
Neeraj
@esnatraj,
excellent work. i were used to see your privious AFL Natraj Pivots. this upgraded version is wounderfull…..!
can you please clear about OB/OS dots…..?
small dots and Big dots…..!
one other thing for modificatiion if possible…..!
is it possible that we can see previous days pivots ? OR can you plot non-rescalable pivots ?
waiting…..!
Divyesh
Thank You @ NEERAJAMBILWADE
Thank You @ Divyesh,
How do i use it en EOD Data
Hi Sir,
Very nice AFL thanks for sharing it.
One point i want to know that (Buy above=xyz or Short sell Below=xyz above or bellow means how much the price variation we have to place the order for example today(22-08-2014) i have seen union bank fut buy above 213.85 and Tgt is 219.18, excellent……! tgt reached. My point Buy above means where i have to keep the entry order price: 213.90/213.95/214 OR its depends on the lot size? if possible clarify my point
Thank You
Thank You @ dpstavnii, Order placed depend in trade volume sir.
Hi Sir,
Could you clear about dots indication small dots and big dots in super and how do we follow those, as a profit booking signal?
Thanks for nice AFL
Hi dpstavnii SIr,
Yes, Partial Profit booking area if trade multiple lots
Hi Sir,
Thank you for sharing the above AFL. A very handy and good AFL. Just one request if possible kindly update the AFL for BACKTESTING support.
On scanning the buy/sell results are showing but Backtesting gives error.
Thanks n Regards,
Thank You TechnoTrader Sir,
Now Scan & Explore option is included,
I will Update Backtesting Option in Future.
Explore Option Result: http://prntscr.com/4p610g
Hi Sir,
Could u provide sound alert add on afl when super gives buy/sell signal for this formula
Thank You
Wonderful Nataraj, cheers for your nice workout.
It would be great if you could include alerts/popups and also eagerly looking for ‘Backtesting’ option. Thanks :)