Stock Portfolio Organizer
The ultimate porfolio management solution.
Shares, Margin, CFD's, Futures and Forex
EOD and Realtime
Dividends and Trust Distributions
And Much More ....
WiseTrader Toolbox
#1 Selling Amibroker Plugin featuring:
Advanced Adaptive Indicators
Advanced Pattern Exploration
Neural Networks
And Much More ....
RSI2 with ADX2 and Aaron Oscillator(2) for Amibroker (AFL)
Rating:
3 / 5 (Votes 7)
Tags:
oscillator, trading system, amibroker
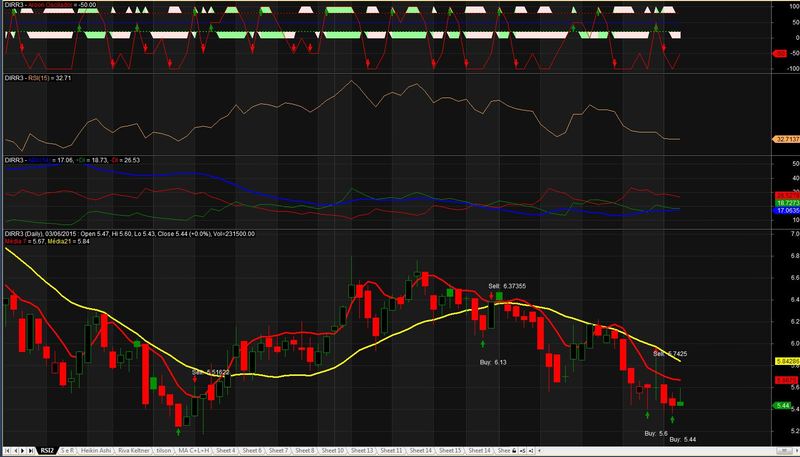
Setup for short trades using RSI ( 2) with ADX ( 2 ) and Aaron oscillator ( 2 ) and configures better with the stop time of 2 days.
Screenshots
Indicator / Formula
Copy & Paste Friendly
//Setup for short trades using RSI ( 2) with ADX ( 2 ) and Aaron oscillator ( 2 ) and configures better with the stop time of 2 days.

//_SECTION_BEGIN("Price");
//SetChartOptions(0,chartShowArrows|chartShowDates);
//_SECTION_END();

_SECTION_BEGIN("Aroon");
if( ParamToggle("Tooltip Shows", "Aroon|Prices" ) )
{
ToolTip=StrFormat("Open: %g\nHigh: %g\nLow: %g\nClose: %g (%.1f%%)\nVolume:
"+NumToStr( V, 1 ), O, H, L, C, SelectedValue( ROC( C, 1 )));
}
Aroonswitch = ParamToggle("Aroon","On,Off");
Periods = Param("Aroon Periods", 2, 1, 100, 1 );
_SECTION_END();

_SECTION_BEGIN("Aroon_UP");
UPcolor = ParamColor( "Aroon_UP Color", colorGreen );
UPstyle = ParamStyle("Aroon_UP Style",styleThick);
_SECTION_END();

_SECTION_BEGIN("Aroon_DN");
DNcolor = ParamColor( "Aroon_DN Color", colorRed );
DNstyle = ParamStyle("Aroon_DN Style",styleThick);
_SECTION_END();

_SECTION_BEGIN("Aroon_Oscillator");
OSswitch = ParamToggle("Aroon_OSc","On,Off");
OScolor = ParamColor( "Aroon_OSc Color", colorBlack );
OSstyle = ParamStyle("Aroon_OSc Style",styleHistogram | styleOwnScale,
maskHistogram );
_SECTION_END();


HHVBarsSince = HHVBars(H, Periods+1);
LLVBarsSince = LLVBars(L, Periods+1);

Aroon_Up = ((Periods - HHVBarsSince) / Periods) * 100;
Aroon_Down = ((Periods - LLVBarsSince) / Periods) * 100;
Aroon_Osc = Aroon_Up - Aroon_Down;


Periodo = optimize("Periodo", 4,4,13,1);
ValorRSI = optimize("Valor RSI", 8, 5, 10,1);

ma7 = MA(HIGH, Periodo);
//ma7  = MA(Close, periodo);
Ma21 = MA(Close, 21);

Buy = High < ma7 AND Close < ma7 AND RSI(2) < ValorRSI AND MDI(2) < 51 AND Ref(MDI(2), -1) > MDI(2)  AND Aroon_Osc < -51 AND Volume > 200000 AND Close > 2.00 ;
Sell = Cross(H, ma7);

Buy=ExRem(Buy,Sell);
Sell=ExRem(Sell,Buy);

BuyPrice = close;
SellPrice = ma7;


_N(Title = StrFormat("{{NAME}} ({{INTERVAL}}), {{DATE}} : {{OHLCX}}, Vol=%1.2f\n{{VALUES}}", V));
COL1=IIf(Close > Ref(Close,-1) ,colorGreen,IIf(Close<Ref(Close, -1),colorRed,colorGreen));
Plot( C, "Close", COL1, styleNoTitle | ParamStyle("Style") | styleCandle );
Plot(MA7,"Média 7",colorRed, styleLine,0,0,0,0,3);
Plot(MA21,"Média21",colorYellow, styleLine,0,0,0,0,3);


shape = Buy * shapeUpArrow + Sell * shapeDownArrow;
PlotShapes( shape, IIf( Buy, colorGreen, colorRed ),0, IIf( Buy, Low, High ) );

GraphXSpace = 5;
dist = 1.0*ATR(5);
dist1 = 1.5*ATR(5);

for( i = 0; i < BarCount; i++ )
{
if( Buy[i] ) PlotText( "Buy:  " + C[ i ], i, L[ i ]-dist[i], colorWhite );
if( Sell[i] ) PlotText( "Sell:  " + MA7[ i ], i, L[ i ]+dist1[i], colorWhite );
}


//PlotShapes(IIf(Buy==1, shapeUpArrow , shapeNone), colorGreen, 0,Low, Offset=-20);
//PlotShapes(IIf(Sell==1, shapeDownArrow, shapeNone), colorRed, 0,High, Offset-10);


// Choice trade size:
SetPositionSize(optimize("percentual", 35, 20, 100, 5), spsPercentOfEquity );
//SetPositionSize(2000,spsShares);
//SetPositionSize(50000, spsValue);
0 comments
Leave Comment
Please login here to leave a comment.
Back