Stock Portfolio Organizer
The ultimate porfolio management solution.
Shares, Margin, CFD's, Futures and Forex
EOD and Realtime
Dividends and Trust Distributions
And Much More ....
WiseTrader Toolbox
#1 Selling Amibroker Plugin featuring:
Advanced Adaptive Indicators
Advanced Pattern Exploration
Neural Networks
And Much More ....
DeMarker for Amibroker (AFL)
Rating:
4 / 5 (Votes 4)
Tags:
oscillator, amibroker
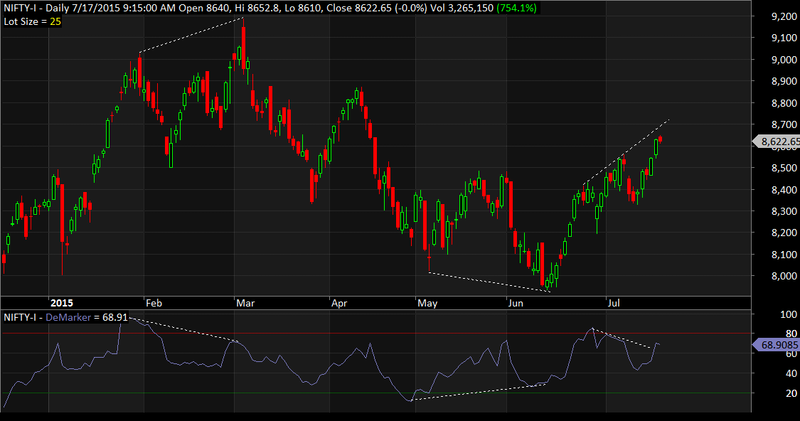
A better Over Bought and Over Sold indicator to detect Tops and Bottoms.
Screenshots
Indicator / Formula
Copy & Paste Friendly
_SECTION_BEGIN("DeMarker Indicator");
// Last edited: VIMALRAJ (vimal.raaj@yahoo.com) on 17/07/2015
// The DeMarker indicator is an attempt to overcome the shortcomings of classical overbought / oversold indicators.
// The DeMarker Indicator identifies potential price bottoms and tops.
// It accomplishes this by making price comparisons from one bar to the next and measuring the level of price demand.
// DeMarker should be interpreted as other overbought / oversold indicators such as RSI with the levels of 30 and 70.
// Compared to RSI it is smoother but still able to detect tops and bottoms a little bit better.
// For more information please check AmiBroker Tips newsletter http://www.amibroker.com/newsletter/02-2000.html

dmPeriods 			= Param( "Periods", 13, 1, 200, 1 );
dmColor				= ParamColor( "Color", colorBlueGrey );
dmStyle				= ParamStyle( "Style", styleLine );
plotLevels			= ParamToggle( "Plot OB/OS Levels", "No|Yes", 1 );
dmOverBoughtLevel 	= Param( "Over Bought Level", 80, 50, 100 );
dmOverSoldLevel 	= Param( "Over Sold Level", 20, 0, 50 );
dmOverBoughtColor	= ParamColor( "OB Level Color", colorRed );
dmOverSoldColor		= ParamColor( "OS Level Color", colorGreen );

DeMax = IIf( H > Ref( H, -1 ), H - Ref( H, - 1), 0 );
DeMin = IIf( L < Ref( L, -1 ), Ref( L, - 1 ) - L, 0 );
DeMarker = 100 *  Sum( DeMax, dmPeriods )/( Sum( DeMax, dmPeriods ) + Sum( DeMin, dmPeriods ) );

Plot( DeMarker, "DeMarker", dmColor, dmStyle );
if( plotLevels ) {
	PlotGrid( dmOverBoughtLevel, dmOverBoughtColor );
	PlotGrid( dmOverSoldLevel, dmOverSoldColor );
}
_SECTION_END();
5 comments
Leave Comment
Please login here to leave a comment.
Back
Thanks for valuable sharing. Picking Divergence by this indicator is most worthy and quite interesting as well.
Hi Nirmala,
Thanks for AFL, I can see the divergence indicator in your screen shot, but its not showing for me, do we need to setup anything for that dot lines divergence indicator with your AFL?; thanks
thank you somuch
@JoeXavier It is just a basic code. The lines were drawn manually to illustrate the divergences. You will need to visually check for the divergences b/w price and DeMarker.
Thanks Vimal,
Do you have any idea how to draw those line thru coding?
Do you have any sample coding which auto draw the lines for Divergence? thanks