Stock Portfolio Organizer
The ultimate porfolio management solution.
Shares, Margin, CFD's, Futures and Forex
EOD and Realtime
Dividends and Trust Distributions
And Much More ....
WiseTrader Toolbox
#1 Selling Amibroker Plugin featuring:
Advanced Adaptive Indicators
Advanced Pattern Exploration
Neural Networks
And Much More ....
Alligator Trading System for Amibroker (AFL)
Rating:
3 / 5 (Votes 14)
Tags:
amibroker, alligator
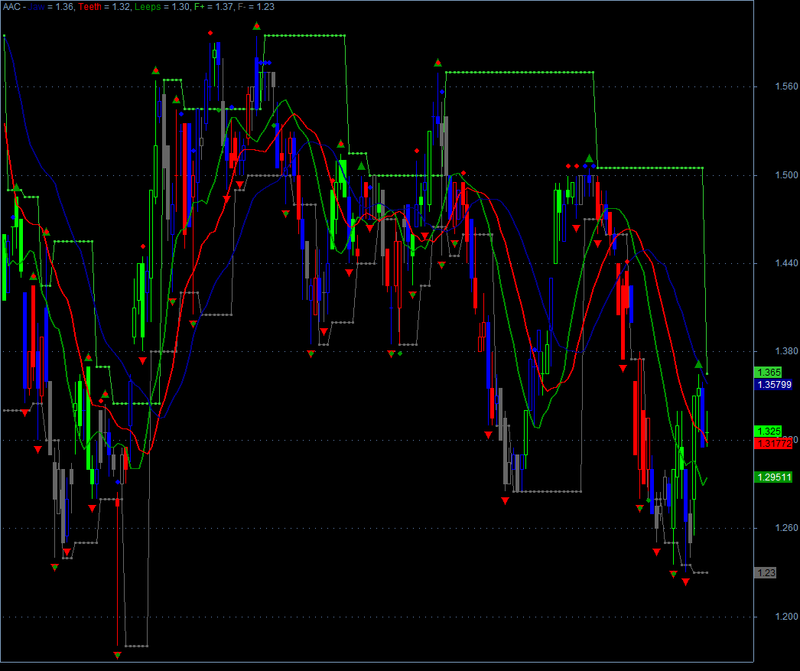
This is a simulation in Amibroker of the Investors Dream Trading program developed by profitunity that uses the Alligator Trading System.
Credit goes to Tal of amibroker fan.
Screenshots
Similar Indicators / Formulas
Bill Williams Alligator
Submitted
by estromholt over 15 years ago
AC (Acceleration Oscillator) Indicator
Submitted
by rajeevj about 14 years ago
Alligator AC Indicator, Exploration and System
Submitted
by kaiji over 16 years ago
BUAYA Timur
Submitted
by lodwyk over 13 years ago
AO (Awesome Oscillator) Indicator
Submitted
by rajeevj about 14 years ago
Alligator AO Indicator, Exploration and System
Submitted
by kaiji over 16 years ago
Indicator / Formula
Copy & Paste Friendly
//TODO:
//1. Remember F, AO, AC and Zone Add Ons signals and hits
//2. Integrate squat bars with exit signals somehow.
//3. five magic bullets - for taking profit

//Alligator lines
//---------------

//The Blue balance line is where the price would be on this time frame if there were no new incoming information,
//in other words, the market only moves when there is Chaos present.
AlligatorBlue=Ref(Wilders(Avg,13),-8);
Plot(AlligatorBlue, "Jaw", colorDarkBlue, styleLine | styleThick);
AlligatorRed=Ref(Wilders(Avg,8),-5);
Plot(AlligatorRed, "Teeth", colorRed, styleLine | styleThick);
AlligatorGreen=Ref(Wilders(Avg,5),-3);
Plot(AlligatorGreen, "Leeps", colorGreen, styleLine | styleThick);

//The PURPLE line is a 5 bar SIMPLE moving average of the bar’s CLOSE offset 3 bars into the future
PurpleLine = MA(Ref(C,-3),5);
if( ParamToggle("Show Purple Line", "No|Yes", 0))
{	Plot(PurpleLine , "Purple", colorViolet, styleLine | styleThick);
}

//AO
//---------------
AO = MA( Avg,5) - MA( Avg , 34);

AOUpBar = AO > Ref(AO, -1);
AODownBar = AO < Ref(AO, -1);

//AC
//---------------
MAAvg34=MA( Avg , 34);
MAAvg5 = MA( Avg,5);
MADiff = MAAvg5 - MAAvg34;
AC = MA(MADiff - MA(MADiff, 5), 5);

ACUpBar = AC > Ref(AC, -1);

ACDownBar = AC < Ref(AC, -1);

//Squat Bar
//---------
//Squat bars are a battle of the bulls and the bears, with lots of buying and selling but little price movement.
//A squat bar will be one of the top three OR bottom three bars 85% of the time at the end of a trend.
//While all trends end with a squat, all squats are NOT the end of a trend.
MarketFacilitionIndex =(H-L)/V;
SquatBar = MarketFacilitionIndex < Ref(MarketFacilitionIndex, -1) AND Volume > Ref(Volume, -1);
ShowSquatBars = ParamToggle("Show Squat Bars", "No|Yes", 1);

//Price Bar
//---------
GreenBar = AOUpBar AND ACUpBar;
RedBar = AODownBar AND ACDownBar;
PriceBarColor = IIf(GreenBar, colorBrightGreen , IIf(RedBar, colorRed, colorGrey40));
PriceBarColor = IIf(ShowSquatBars AND SquatBar, colorBlue, PriceBarColor);

Plot( C, "Close", PriceBarColor , styleNoTitle | ParamStyle("Style") | GetPriceStyle() );
if( ParamToggle("Tooltip shows", "All Values|Only Prices" ) )
{
 ToolTip=StrFormat("Open: %g\nHigh:  %g\nLow:   %g\nClose:  %g (%.1f%%)\nVolume: "+NumToStr( V, 1 ), O, H, L, C, SelectedValue( ROC( C, 1 )));
}

//Fractal up
//----------
fUp = (Ref(H,-2) > Ref(H, -4)) AND
  (Ref(H,-2) > Ref(H, -3)) AND
  (Ref(H,-2) > Ref(H, -1)) AND
  (Ref(H,-2) > H);
var1=ValueWhen(fUp ,Ref(H,-2) ,1);
FractalUp=HighestSince(var1 > 0, var1, 1);
Plot(FractalUp, "F+",colorLime , styleLine | styleDots);

FUpBuyPrice = FractalUp + 0.01;
FUpHit = FUpBuyPrice <= H AND FUpBuyPrice >= L;
FUpSignalOn = Flip(Ref(FractalUp,-1) != FractalUp, FUpHit);

//Looks into the future. This is done only to display Fractal arrow at the right bar.
//The calculation of the fractal up is done without looking into the future.
PlotShapes(IIf(Ref(FractalUp,2) != Ref(FractalUp,1), shapeSmallUpTriangle, shapeNone), colorGreen,0,Ref(FractalUp,2), 10);

//Fractal Down
//------------
var2=
	(Ref(L,-2) <= Ref(L, -1)) AND
	(Ref(L,-2) <= Ref(L, 0)) AND
	(Ref(L,-2) <= Ref(L, -3)) AND
	(Ref(L,-2) <= Ref(L, -4));
FractalDown=ValueWhen(var2, Ref(L,-2), 1);

FDownSellPrice= FractalDown+ 0.01;
FDownHit = FDownSellPrice <= H AND FDownSellPrice >= L;
FDownSignalOn = Flip(Ref(FractalDown,-1) != FractalDown, FDownHit );

Plot(FractalDown, "F-", colorGrey40, styleLine | styleDots);
//Looks into the future. This is done only to display Fractal arrow at the right bar.
//The calculation of the fractal up is done without looking into the future.
PlotShapes(IIf(Ref(FractalDown,2) != Ref(FractalDown,1), shapeSmallDownTriangle, shapeNone), colorRed,0,Ref(FractalDown,2), 10);


//Exits
//-----
Bar5LongExit = Ref(GreenBar, -4) AND Ref(GreenBar, -3) AND Ref(GreenBar, -2) AND Ref(GreenBar, -1) AND GreenBar;
Bar5ShortExit = Ref(RedBar, -4) AND Ref(RedBar, -3) AND Ref(RedBar, -2) AND Ref(RedBar, -1) AND RedBar;

Bar5LongPrice = LowestSince(Bar5LongExit, L) - 0.01;
Bar5LongHit = L <= Ref(Bar5LongPrice, -1);
Bar5LongOn = Flip(Bar5LongExit, Bar5LongHit);

Bar5ShortPrice = LowestSince(Bar5ShortExit, H) + 0.01;
Bar5ShortHit =  H >= Ref(Bar5ShortPrice, -1);
Bar5ShortOn = Flip(Bar5ShortExit, Bar5ShortHit);

GreenLineLongExit = Cross(AlligatorGreen, C);
RedLineLongExit = Cross(AlligatorRed, C);
GreenLineShortExit = Cross(AlligatorGreen, C);
RedLineShortExit = Cross(AlligatorRed, C);

//Zones (Add-Ons)
//---------------
//"Add-On" Buy (Sell):
//(1) The Momentum is still going up (down).
//(2) The Accelerator is moving up (down).
//(3) The Price is closing higher (lower).
//It is rare to continue to get over six to eight bars of the same color - No add ons after 5 consecutive bars.

AddOnBuy = Ref(GreenBar,-1) AND GreenBar AND C > Ref(C,-1) AND NOT Bar5LongExit;
AddOnSell = Ref(RedBar,-1) AND RedBar AND C < Ref(C,-1) AND NOT Bar5ShortExit;

//Balance Lines
//-------------
//1. If we are going toward the Balance Line, we place our Signal at base + two higher highs (lower lows).
//2. If we are going away from the Balance Line, we use base + one higher High (lower Low).
//3. If the current bar is red (green) and we are above the blue (Green) Balance Line AND looking for Buy (sell)signals
//   we double the number of lower low (higher high) bars needed.
//4. Base Bar is the Lowest High (Highest Low) in buy (sell). Signal Bar is the bar before the base bar.
//5. Buy (Sell) stop is defined as the High (Low) + 1 tick of the Signal Bar.
//6. As long as the Signal bar itself is above the Balance Line, we act as if the entire formation were above the Balance Line.
//7. The buy (sell) stop stays in place unless
//		(a) it is triggered
//		OR
//		(b) another bar with a lower High (Higher Low) is formed, creating a different base bar.
//8. You do not sell above the Alligator's mouth and you do not buy below the Alligator's mouth.

AboveAll = L > AlligatorRed AND L > AlligatorBLue AND L > AlligatorGreen;
BelowAll = H < AlligatorRed AND H < AlligatorBLue AND H < AlligatorGreen;

//Buys. Only above balance lines for now
LowerHigh = Ref(H, -1) > H;
//Double the number of LowerHighs Required on RedBar
BuySignalRef = IIf(RedBar, 2, 1);
//"BuySignalRef =" +WriteVal(BuySignalRef );
//1 or 2 lower highs above balance line
BLBuyCondition = Ref(AboveAll,-BuySignalRef) AND LowerHigh AND IIf(RedBar, Ref(LowerHigh,-1) , True);
//"BLBuyCondition =" +WriteVal(BLBuyCondition );
//Update price if new buy signal is on, otherwise use previous price:

BLBuyPrice = LowestSince(BLBuyCondition, Ref(H,-BuySignalRef)+0.01, 1);
//"Buy Hit="+WriteVal(H > Ref(BLBuyPrice,-1)) +" at"+WriteVal(Ref(BLBuyPrice,-1));

//Keep buy signal on until it is hit or marked is below all balance lines:
BLBuySignal = Flip(BLBuyCondition , ((NOT BLBuyCondition) AND H >= Ref(BLBuyPrice,-1)) OR BelowAll);
//"BLBuySignal "+WriteVal(BLBuySignal)+" BLBuyPrice="+WriteVal(BLBuyPrice);
BLBuyHit = Ref(BLBuySignal, -1) AND (NOT BLBuyCondition) AND H >= Ref(BLBuyPrice,-1);

//Note that if new buy signal is after a still valid older signal, we choose the lowest from both of them
BLBuyPrice = IIf(Ref(BLBuySignal,-1), Min(BLBuyPrice, Ref(BLBuyPrice,-1)), BLBuyPrice);


//Sells. Only below balance lines for now

HigherLow = Ref(L, -1) < L;
//Double the number of LowerHighs Required on GreenBar
SellSignalRef = IIf(GreenBar, 2, 1);
//"SellSignalRef =" +WriteVal(SellSignalRef );
//1 or 2 higher lows above balance line
BLSellCondition = Ref(BelowAll, -SellSignalRef) AND HigherLow AND IIf(GreenBar, Ref(HigherLow,-1) , True);
//"BLSellCondition =" +WriteVal(BLSellCondition);
//Update price if new sell signal is on, otherwise use previous price:
BLSellPrice = HighestSince(BLSellCondition , Ref(L,-SellSignalRef)-0.01, 1);

//"Sell Hit="+WriteVal((NOT BLSellCondition) AND L < Ref(BLSellPrice,-1)) +" at"+WriteVal(Ref(BLSellPrice,-1));
//Keep buy signal on until it is hit or market is above all balance lines
BLSellSignal = Flip(BLSellCondition, ((NOT BLSellCondition) AND L <= Ref(BLSellPrice,-1)) OR AboveAll);
//"BLSellSignal"+WriteVal(BLSellSignal)+" BLSellPrice="+WriteVal(BLSellPrice);
BLSellHit = Ref(BLSellSignal, -1) AND (NOT BLSellCondition) AND L <= Ref(BLSellPrice,-1);

//Note that if new sell signal is after a still valid older signal, we choose the highest from both of them
BLSellPrice = IIf(Ref(BLSellSignal,-1), Max(BLSellPrice, Ref(BLSellPrice,-1)), BLSellPrice);

//Bars Analysis
//-------------
Third = (H-L) / 3;
Line1 = H - Third;
Line2 = L + Third;
Half = L + ((H-L) / 2);

//After an extreme bar 85% of the time the market will change direction within the next 1-5 bars.
ExtremeBarUp = Open > Line1 AND Close > Line1;
ExtremeBarDown = Open < Line2 AND Close < Line2;
ExtremeBar = ExtremeBarUp OR ExtremeBarDown;

//Bullish AND Bearish Bars Inside the mouth do NOT create a Signal.
OutsideMouth = NOT ((H < AlligatorBlue AND L > AlligatorGreen) OR (L > AlligatorBlue AND H < AlligatorGreen));
//Bullish Divergence Bars
BullDivBar = OutsideMouth AND L < Ref(L,-1) AND C > Half;
//Bearish Divergence Bars
BearDivBar = OutsideMouth AND H > Ref(H, -1) AND C < Half;

PlotShapes(IIf(ExtremeBar, shapeSmallCircle ,shapeNone), colorBlue, 0, H, 12);
PlotShapes(IIf(BullDivBar, shapeSmallCircle ,shapeNone), colorGreen, 0, L, -12);
PlotShapes(IIf(BearDivBar, shapeSmallCircle ,shapeNone), colorRed, 0, H, 12);

//Commentary:

WriteIf(ExtremeBarUp OR ExtremeBarDown, "Possible Change of direction within the next 1-5 bars. (Extreme Bar)\n","")+
"Buy Signals:\n"+
WriteIf(FUpSignalOn , "Place Buy Stop if Price rises to" +WriteVal(FUpBuyPrice)+ " or higher. (F+)\n","")+
WriteIf(BullDivBar, "Place Buy Stop if Price rises to" +WriteVal(H+0.01)+ " or higher. (Bullish Divergent Bar)\n","")+
WriteIf(AddOnBuy, "Place Buy Stop if Price rises to" +WriteVal(H+0.01)+ " or higher. (Zones Add On Buy)\n","")+
WriteIf(BLBuySignal,"Place Buy Stop if Price rises to" +WriteVal(BLBuyPrice)+ " or higher. (BL+)\n","")+

"Sell Signals:\n"+
WriteIf(FDownSignalOn , "Place Sell Stop if Price falls to" +WriteVal(FDownSellPrice)+ " or lower. (F-)\n","")+
WriteIf(BearDivBar, "Place Sell Stop if Price falls to" +WriteVal(L-0.01)+ " or lower. (Bearish Divergent Bar)\n","")+
WriteIf(AddOnSell, "Place Sell Stop if Price falls to" +WriteVal(L-0.01)+ " or lower. (Zones Add On Sell)\n","")+
WriteIf(BLSellSignal,"Place Sell Stop if Price falls to" +WriteVal(BLSellPrice)+ " or lower. (BL-)\n","")+

"Hits:\n"+
WriteIf(BLBuyHit,"Buy Stop Hit at" +WriteVal(Ref(BLBuyPrice,-1))+ ". (BL+)\n","")+
WriteIf(BLSellHit,"Sell Stop Hit at" +WriteVal(Ref(BLSellPrice,-1))+ ". (BL-)\n","")+

WriteIf(Ref (FUpSignalOn, -1) AND FUpHit,"Buy Stop Hit at" +WriteVal(Ref(FUpBuyPrice,-1))+ ". (F+)\n","")+
WriteIf(Ref (FDownSignalOn, -1) AND FDownHit,"Sell Stop Hit at" +WriteVal(Ref(FDownSellPrice,-1))+ ". (F-)\n","")+

WriteIf(Ref(Bar5LongOn , -1) AND Bar5LongHit, "Close all positions Hit at" +WriteVal(Ref(Bar5LongPrice,-1))+ ". (Long Five Consecutive Bars Exit)\n","")+
WriteIf(Ref(Bar5ShortOn , -1) AND Bar5ShortHit, "Close all positions Hit at" +WriteVal(Ref(Bar5ShortPrice,-1))+ ". (Short Five Consecutive Bars Exit)\n","")+

"Exits:\n"+

WriteIf(Bar5LongOn , "Long Five Consecutive Bars Exit Strategy: Close all Long positions if Price falls to" +WriteVal(Bar5LongPrice)+ " or lower.\n","")+
WriteIf(Bar5ShortOn, "Short Five Consecutive Bars Exit Strategy: Close all Short positions if Price rises to" +WriteVal(Bar5ShortPrice)+ " or higher.\n","")+

WriteIf(GreenLineLongExit, "Green Line Long Exit Strategy: All Long positions should have been closed when Close Price fell below "+WriteVal(AlligatorGreen)+".\n","")+
WriteIf(RedLineLongExit, "Red Line Long Exit Strategy: All Long positions should have been closed when Close Price fell below "+WriteVal(AlligatorRed)+".\n","")+
WriteIf(GreenLineShortExit, "Green Line Short Exit Strategy: All Short positions should have been closed when Close Price rose above "+WriteVal(AlligatorGreen)+".\n","")+
WriteIf(RedLineShortExit, "Red Line Short Exit Strategy: All Short positions should have been closed when Close Price rose aboce "+WriteVal(AlligatorRed)+".\n","");
13 comments
Leave Comment
Please login here to leave a comment.
Back
works with it’s hints in the information window like a real personal advisor … interesting, even it’s not perfect (but who is?).
Can someone link a tutorial for this system?
THX
hey! I’m very interested in this Trading system.. any information would be helpful penluck10@yahoo.com
The name itself is Christmas at Graceland. I have been only been trading 4 months now with a 100% success rate. I keep things very basic (price, volume, patterns, candle sticks) I prefer EOD because it gives me the freedom of choice. In that time I have used Amibroker. At current I want to expand & look more at monitoring trades (trading systems)while at the same time confirm using basic chartist principles. Anyways the Alligator Trading System looks really cool & colorful on my imac so thanks you bunches.
~Jerry
4. I’ve added Exploration – below. Would appreciate checking to see if I’ve done properly … if not revise. Thanks DICK
Hi,
I found sintax error on this line and don’t know how to correct it. Coz I want to make it on auto analyzer.
Anyone can help maybe ? Plzzz…
VP = Param(“Period for Avg Vol” , 10, 50, 240, 1); // sets the period for the average volume calculation
another crap
jerry 100% success. you are great.
I AM FACEING SAME PROBLEM BUT I CANT UNDER STAND
VP = Param(“Period for Avg Vol” , 10, 50, 240, 1); // sets the period for the average volume calculation
WHATS TO DO REPLACE “WITH”?? PLZ PLZ CLEAR
The issue with many afl posted here by users with non US style character set (keyboards), is the quotation mark.
Often in the code we see a beginning “ mark and an ending ” mark, which in most case creates an error. After the [Copy & Paste Friendly] capture, we need to do a global replace of these right [“] and left [”] slanting quotation marks, to the simple vertical quote mark which look like this: " which is the ASCII character number 034.
Try on your keyboard Alt-034
Holding the [Alt] key down, press 034 on the numerical keypad (not the numbers on the top row!) and release. This should give you the correct ‘quote mark’, two vertical bar superscript.
Let me know if that solved the problem.. Good luck.
Parfumeur
Thanks
Hi, thank you very much for this code. How can I use Short and Cover signals with your system?
okok
bealtrader
I think alligator is appropriate for long time frame because indicator lagging.