Stock Portfolio Organizer
The ultimate porfolio management solution.
Shares, Margin, CFD's, Futures and Forex
EOD and Realtime
Dividends and Trust Distributions
And Much More ....
WiseTrader Toolbox
#1 Selling Amibroker Plugin featuring:
Advanced Adaptive Indicators
Advanced Pattern Exploration
Neural Networks
And Much More ....
RockCama for Amibroker (AFL)
Rating:
3 / 5 (Votes 7)
Tags:
amibroker, exploration
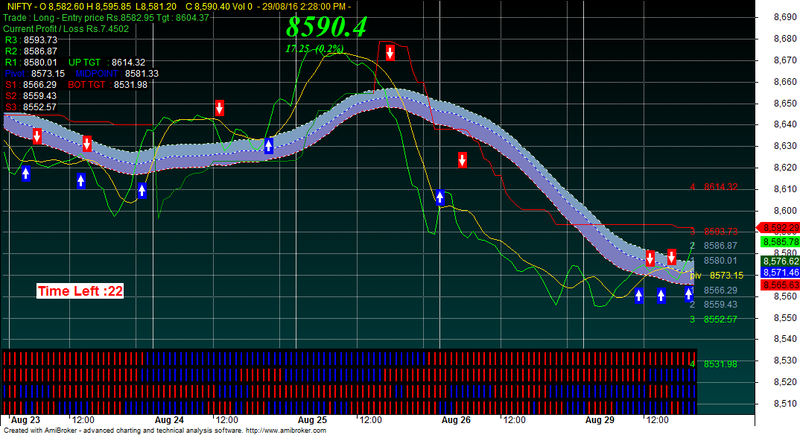
Camarilla based afl..enjoy trading…
Screenshots
Indicator / Formula
Copy & Paste Friendly
SetChartOptions(0, chartShowArrows | chartShowDates);
GraphXSpace=15;
_SECTION_BEGIN("System");

SetChartBkGradientFill( ParamColor("BgTop",  colorBlack ),ParamColor("BgBottom", colorDarkOliveGreen));


TimeFrameSet( in1Minute);
per1=Param("First Period",6,2,30,1);
per2=Param("Second Period",2,2,30,1);
Om=MA(O,per1);
hm=MA(H,per1);
lm=MA(L,per1);
Cm=MA(C,per1);

 DC=sqrt(WMA(Avg,5));//Ref(C,-1 );
c1=WMA(dc,1);
pd1=WMA(dc,5);
Color = IIf( c1 < pd1,4, IIf( c1 == pd1,colorYellow, 6));


//==============================================================================================================
HACLOSE=(Om+Hm+Lm+Cm)/4;
HaOpen = AMA( Ref( HaClose, -1 ), 0.5 );
HaHigh = Max( Hm, Max( HaClose, HaOpen ) );
HaLow = Min( Lm, Min( HaClose, HaOpen ) );
//PlotOHLC( HaOpen, HaHigh, HaLow, HaClose, "" + Name(), colorBlack, styleCandle | styleNoLabel );

Of=MA(Haopen,per2);
Cf=MA(Haclose,per2);
Lf=IIf(haOpen<haClose,MA(Halow,per2),MA(Hahigh,per2));
Hf=IIf(haOpen<haClose,MA(Hahigh,per2),MA(Halow,per2));

PlotOHLC( Of, Hf, Lf, Cf, "" + Name(), colorGold, styleLine | styleNoLabel );

 _SECTION_BEGIN("Super Trend");
Factor=Param("Factor",3,1,10,1);
Pd=Param("ATR Periods",4,1,100,1);
Up=WMA((H+L)/2,3)+(Factor*ATR(Pd));
Dn=WMA((H+L)/2,3)-(Factor*ATR(Pd));
iATR=ATR(Pd);
TrendUp=TrendDown=Null;
trend[0]=1;
changeOfTrend=0;
flag=flagh=0;
for (i = 1; i <BarCount; i++) {
TrendUp[i] = Null;
TrendDown[i] = Null;
trend[i]=1;
if (Close[i]>Up[i-1]) {
trend[i]=1;
if (trend[i-1] == -1) changeOfTrend = 1;
}
else if (Close[i]<Dn[i-1]) {
trend[i]=-1;
if (trend[i-1] == 1) changeOfTrend = 1;
}
else if (trend[i-1]==1) {
trend[i]=1;
changeOfTrend = 0;
}
else if (trend[i-1]==-1) {
trend[i]=-1;
changeOfTrend = 0;
}
if (trend[i]<0 && trend[i-1]>0) {
flag=1;
}
else {
flag=0;
}
if (trend[i]>0 && trend[i-1]<0) {
flagh=1;
}
else {
flagh=0;
}
if (trend[i]>0 && Dn[i]<Dn[i-1]){
Dn[i]=Dn[i-1];
}
if (trend[i]<0 && Up[i]>Up[i-1])
{ Up[i]=Up[i-1];
}
if (flag==1)
{ Up[i]=(H[i]+L[i])/2+(Factor*iATR[i]);;
}
if (flagh==1)
{ Dn[i]=(H[i]+L[i])/2-(Factor*iATR[i]);;
}
if (trend[i]==1) {
TrendUp[i]=Dn[i];
if (changeOfTrend == 1) {
TrendUp[i-1] = TrendDown[i-1];
changeOfTrend = 0;
}
}
else if (trend[i]==-1) {
TrendDown[i]=Up[i];
if (changeOfTrend == 1) {
TrendDown[i-1] = TrendUp[i-1];
changeOfTrend = 0;
}
}
}

Plot(TrendUp,"Trend",colorGreen);
Plot(TrendDown,"Down",colorRed);
_SECTION_END();

Plot(tt=WMA(C,3),"Close",colorBrightGreen,styleLine);
//=======================================================================================================================

GraphXSpace = 25 ;
//---- pivot points
DayH = TimeFrameGetPrice("H", inDaily, -1); // yesterdays high
DayL = TimeFrameGetPrice("L", inDaily, -1); // low
DayC = TimeFrameGetPrice("C", inDaily, -1); // close
DayO = TimeFrameGetPrice("O", inDaily); // current day open

piv=(dayh+DayL+Dayc)/3;
//............camarilla pivots
H5 = ( (DayH-DayL) * (1.1/1) ) + DayC;
H4 = ( (DayH-DayL) * (1.1/2) ) + DayC;
H3 = ( (DayH-DayL) * (1.1/4) ) + DayC;
H2 = ( (DayH-DayL) * (1.1/6) ) + DayC;
H1 = ( (DayH-DayL) * (1.1/12) ) + DayC;
p1 = ( (dayc-dayo) * (1.1/12) ) + piv;
L1 = DayC - ( (DayH-DayL) * (1.1/12) );
L2 = DayC - ( (DayH-DayL) * (1.1/6) ) ;
L3 = DayC - ( (DayH-DayL) * (1.1/4) ) ;
L4 = DayC - ( (DayH-DayL) * (1.1/2) ) ;
piv1=(h1+l1)/2;

avc=WMA(Avg,2);

Buy=cover=Cross(avc,piv1) ;//OR Cross(tt,h2) OR Cross(tt,h3) OR Cross(tt,l1) OR Cross(tt,l2) OR Cross(tt,l3) OR Cross(tt,piv1)  ;
Sell=Short=Cross(piv1,avc);// OR Cross(h2,tt) OR Cross(l2,tt) OR Cross(l3,tt) OR Cross(h1,tt) OR Cross(h2,tt) OR Cross(piv1,tt) ;

Buy=ExRem(Buy,Sell);

Sell=ExRem(Sell,Buy);
//Plot(C,"Close",colorBrightGreen,styleLine);
//=======================================================================================================================


/*
if (NOT BKswitch)
{
SetChartBkColor(OUTcolor); // color of outer border
SetChartBkGradientFill(INUPcolor,INDNcolor,TitleColor); // color of inner panel
}
_SECTION_END();
*/
/*1. Here are some observations to keep in mind that will help assure
you are in a good trending move which is detrimental to the success
of the trade moving higher before the inevitable over exhausted trend.

2 Consider only going long on the 5M if the 30M (two rows above) is also blue.

3 Consider the 1hr row as well being blue since it has an effect too.

4 The 15M row has to be blue with NO exceptions

5 The 30M row if blue has less effect on the trade as compared to the 15M row
but keep this in mind. The 30M row being blue helps the 15M row continue to stay blue.

6 The 1hr row has even less effect OR importance but it too keeps the 30M
from weakening to some minor degree.
*/
// Define label bar (x) position location

blankRightBars = 5; //insert actual blank right bars specified in Preferences
barsInView = Status("lastvisiblebarindex") - Status("firstvisiblebarindex") - blankRightBars;
Offset = Param("Offset Bar", 0.95, 0, 1, 0.01);
textOffset = BarCount - (Offset * barsInView);

_SECTION_BEGIN("default");
HaClose =EMA((O+H+L+C)/4,3);
HaOpen = AMA( Ref( HaClose, -1 ), 0.5 );
HaHigh = Max( H, Max( HaClose, HaOpen ) );
HaLow = Min( L, Min( HaClose, HaOpen ) );
PlotText("Heinkein 4T tf :"+Interval(2), textoffset, 41.01, colorYellow);

Color = IIf( Haopen > Haclose,4, IIf( Haopen == Haclose,colorYellow, 6));
Plot(3,"", Color,  styleHistogram+styleThick|styleOwnScale|styleNoLabel, 0, 100 );
Plot( 4,"",colorBlack,styleOwnScale|styleArea|styleNoLabel,0, 100 );

_SECTION_BEGIN("2");
Compress2= Param("Compression",2,1,3,1);
TimeFrameSet(Compress2* Interval());
HaClose2 =EMA((O+H+L+C)/4,3);
HaOpen2 = AMA( Ref( HaClose2, -1 ), 0.5 );
HaHigh2 = Max( H, Max( HaClose2, HaOpen2 ) );
HaLow2 = Min( L, Min( HaClose2, HaOpen2 ) );
PlotText("Heinkein 4T tf :"+Interval(2), textoffset, 41.055, colorYellow);
TimeFrameRestore();
HAopen2f=TimeFrameExpand( Haopen2, Compress2* Interval());
Haclose2f=TimeFrameExpand( Haclose2, Compress2* Interval());
HaHigh2f=TimeFrameExpand( Hahigh2, Compress2* Interval());
HaLow2f=TimeFrameExpand( Halow2, Compress2* Interval());
Color2 = IIf( Haopen2f > Haclose2f,4, IIf(Haopen2f == Haclose2f,colorYellow, 6));
Plot(7,"", Color2,  styleHistogram+styleThick|styleOwnScale|styleNoLabel, 0, 100 );
Plot( 8,"",colorBlack,styleOwnScale|styleArea|styleNoLabel,0, 100 );

_SECTION_BEGIN("3");
Compress3= Param("Compression3",4,2,6,1);
TimeFrameSet(Compress3* Interval());
HaClose3 =EMA((O+H+L+C)/4,3);
HaOpen3 = AMA( Ref( HaClose3, -1 ), 0.5 );
HaHigh3 = Max( H, Max( HaClose3, HaOpen3 ) );
HaLow3 = Min( L, Min( HaClose3, HaOpen3 ) );
PlotText("Heinkein 4T tf :"+Interval(2), textoffset,41.10, colorYellow);
TimeFrameRestore();
HAopen3f=TimeFrameExpand( Haopen3, Compress3* Interval());
Haclose3f=TimeFrameExpand( Haclose3, Compress3* Interval());
HaHigh3f=TimeFrameExpand( Hahigh3, Compress3* Interval());
HaLow3f=TimeFrameExpand( Halow3, Compress3* Interval());
color3 = IIf( Haopen3f > Haclose3f,4, IIf( Haopen3f == Haclose3f,colorYellow,6));
Plot(11,"", Color3,  styleHistogram+styleThick|styleOwnScale|styleNoLabel, 0, 100 );
Plot( 12,"",colorBlack,styleOwnScale|styleArea|styleNoLabel,0, 100 );

_SECTION_BEGIN("4");
Compress4= Param("Compression4",8,2,10,1);
TimeFrameSet(Compress4* Interval());
HaClose4 =EMA((O+H+L+C)/4,3);
HaOpen4 = AMA( Ref( HaClose4, -1 ), 0.5 );
HaHigh4 = Max( H, Max( HaClose4, HaOpen4 ) );
HaLow4 = Min( L, Min( HaClose4, HaOpen4 ) );
PlotText("Heinkein 4T tf :"+Interval(2), textoffset, 41.14, colorYellow);
TimeFrameRestore();
HAopen4f=TimeFrameExpand( Haopen4, Compress4* Interval());
Haclose4f=TimeFrameExpand( Haclose4, Compress4* Interval());
HaHigh4f=TimeFrameExpand( Hahigh4, Compress4* Interval());
HaLow4f=TimeFrameExpand( Halow4, Compress4* Interval());
Color4 = IIf( Haopen4f > Haclose4f,4, IIf( Haopen4f == Haclose4f ,colorYellow, 6));
Plot(15,"", Color4,  styleHistogram+styleThick|styleOwnScale|styleNoLabel, 0, 100 );
Plot( 16,"",colorBlack,styleOwnScale|styleArea|styleNoLabel,0, 100 );


//Plot(C,"Close",colorBlack, styleCandle);
_SECTION_BEGIN("Price");
SetChartOptions(0,chartShowArrows|chartShowDates);


Short=Sell;

Cover=Buy;

ss=haclose4f;

PlotShapes(IIf(Buy, shapeSquare, shapeNone),colorBlue, 0, ss, Offset=-20);
PlotShapes(IIf(Buy, shapeSquare, shapeNone),colorBlue, 0,ss, Offset=-30);
PlotShapes(IIf(Buy, shapeUpArrow, shapeNone),colorWhite, 0,ss, Offset=-25);
PlotShapes(IIf(Sell, shapeSquare, shapeNone),colorRed, 0, ss, Offset=20);
PlotShapes(IIf(Sell, shapeSquare, shapeNone),colorRed, 0,ss, Offset=30);
PlotShapes(IIf(Sell, shapeDownArrow, shapeNone),colorWhite, 0,ss, Offset=-25);


BuyPrice=ValueWhen(Buy,C);

SellPrice=ValueWhen(Sell,C);

ShortPrice=ValueWhen(Short,C);

CoverPrice=ValueWhen(Cover,C);


Title = EncodeColor(colorWhite)+ "Super Trend AFL code from www.marketcalls.in" + " - " +  Name() + " - " + EncodeColor(colorRed)+ Interval(2) + EncodeColor(colorWhite) +

 "  - " + Date() +" - "+"\n" +EncodeColor(colorRed) +"Op-"+O+"  "+"Hi-"+H+"  "+"Lo-"+L+"  "+

//"Cl-"+C+"  "+ "Vol= "+ WriteVal(V)+"\n"+

EncodeColor(colorLime)+

WriteIf (Buy , " GO LONG / Reverse Signal at "+C+"  ","")+

WriteIf (Sell , " EXIT LONG / Reverse Signal at "+C+"  ","")+"\n"+EncodeColor(colorYellow)+

WriteIf(Sell , "Total Profit/Loss for the Last Trade Rs."+(C-BuyPrice)+"","")+

WriteIf(Buy  , "Total Profit/Loss for the Last trade Rs."+(SellPrice-C)+"","");


function GetSecondNum()
{
    Time = Now( 4 );
    Seconds = int( Time % 100 );
    Minutes = int( Time / 100 % 100 );
    Hours = int( Time / 10000 % 100 );
    SecondNum = int( Hours * 60 * 60 + Minutes * 60 + Seconds );
    return SecondNum;
}

function PopupWindowEx( popupID, bodytext, captiontext, timeout, left, top )
{
    displayText = bodytext + captiontext;
    if ( ( StaticVarGetText( "prevPopup" + popupID ) != displayText) OR ( StaticVarGet( "prevPopupTime" + popupID ) < GetSecondNum() ) )
    {
        StaticVarSetText( "prevPopup" + popupID, displayText);
        StaticVarSet( "prevPopupTime" + popupID, GetSecondNum() + timeout );
        PopupWindow( bodytext, Captiontext + popupID, timeout, Left, top );
        PlaySound("c:\\windows\\media\\ding.wav");
    }
}


_SECTION_BEGIN("Time Left");


RequestTimedRefresh( 1 );

TimeFrame = Interval();

SecNumber = GetSecondNum();

Newperiod = SecNumber % TimeFrame == 0;

SecsLeft = SecNumber - int( SecNumber / TimeFrame ) * TimeFrame;

SecsToGo = TimeFrame - SecsLeft;


x=Param("xposn",50,0,1000,1);

y=Param("yposn",380,0,1000,1);


GfxSelectSolidBrush( ColorRGB( 230, 230, 230 ) );

GfxSelectPen( ColorRGB( 230, 230, 230 ), 2 );

if ( NewPeriod )

{

GfxSelectSolidBrush( colorYellow );

GfxSelectPen( colorYellow, 2 );

Say( "New period" );

}

//GfxRoundRect( x+45, y+40, x-3, y-2, 0, 0 );

//GfxSetBkMode(1);

GfxSelectFont( "Arial", 14, 700, False );

GfxSetTextColor( colorRed );

GfxTextOut( "Time Left :"+SecsToGo+"", x, y );

_SECTION_END();

/*

PlotShapes(IIf(Buy, shapeSquare, shapeNone),colorBlue, 0, L, Offset=-20);
PlotShapes(IIf(Buy, shapeSquare, shapeNone),colorBlue, 0,L, Offset=-30);
PlotShapes(IIf(Buy, shapeUpArrow, shapeNone),colorWhite, 0,L, Offset=-25);
PlotShapes(IIf(Sell, shapeSquare, shapeNone),colorRed, 0, H, Offset=20);
PlotShapes(IIf(Sell, shapeSquare, shapeNone),colorRed, 0,H, Offset=30);
PlotShapes(IIf(Sell, shapeDownArrow, shapeNone),colorWhite, 0,H, Offset=-25);
*/
_SECTION_BEGIN("Pivot calc");

Long=Flip(Buy,Sell);
Shrt=Flip(Short,Cover);

pd = Param("Periods",13,5,144,1);
pds = 2*pd-1;//     (Adjustment for Wilders MA)
aa = Close-Ref(Close,-1);
uu = EMA(Max(0,aa),pds);
dd=  EMA((Max(0,0-aa)),pds);

rf = IIf(C>2,1000,10000);

c1 = Param("Upper Level",70,50,90,1);
qq1 =100/(100-c1)-1;
ff1 = qq1*dd-uu;
ff2 = ff1/qq1;
f1 = Max(ff1,ff2);
UL = Close + f1*(pds-1)/2;
UL = IIf(UL>C,floor(UL*rf),ceil(UL*rf))/rf;

c2 = Param("Equilibrium",50,50,50,0);
qq2 =100/(100-c2)-1;// [=1]
ff = dd-uu;
MM = Close + ff*(pds-1)/2;
MM = IIf(MM>C,floor(MM*rf),ceil(MM*rf))/rf;

c3 = Param("Lower Level",30,10,50,1);
qq3 =100/(100-c3)-1;
ff1 = qq3*dd-uu;
ff2 = ff1/qq3;
f3 = Min(ff1,ff2);
LL = Close + f3*(pds-1)/2;
LL = IIf(LL>C,floor(LL*rf),ceil(LL*rf))/rf;

band = Param("band width",4,0,15,0.25);
mmu = MM+band;
mmd = MM-band;


X=Cross( C,LL);
Y=Cross(UL,C);

Buy1= X ;
Sell1= Y ;

TimeFrameSet( in15Minute*2 );
DH=Ref(H,-1);
DL=Ref(L,-1);
DC=Ref(C,-1);


pd = ( DH+ DL + DC )/3;
sd1 = (2*pd)-DH;
sd2 = pd -(DH - DL);
sd3 = Sd1 - (DH-DL);
rd1 = (2*pd)-DL;
rd2 = pd +(DH -DL);
rd3 = rd1 +(DH-DL);

TimeFrameRestore();

_SECTION_END();


side = Param("side",1,0,1000,1);

dist = 0;

for( i = 0; i < BarCount; i++ )
{ if(i+side== BarCount) PlotText( "\npiv    " + piv1[ i ], i, piv1[ i ]-dist[i], colorYellow );

 if(i+side== BarCount) PlotText( "\n1    " + h1[ i ], i, h1[ i ]-dist[i], colorLightBlue );
if(i+side== BarCount) PlotText( "\n1    " + l1[ i ], i, l1[ i ]-dist[i], colorLightBlue );

 if(i+side== BarCount) PlotText( "\n2    " + h2[ i ], i, h2[ i ]-dist[i], colorLightBlue );
if(i+side== BarCount) PlotText( "\n2    " + l2[ i ], i, l2[ i ]-dist[i], colorLightBlue );


 if(i+side== BarCount) PlotText( "\n3    " + h3[ i ], i, h3[ i ]-dist[i], colorRed );
if(i+side== BarCount) PlotText( "\n3    " + l3[ i ], i, l3[ i ]-dist[i], colorBrightGreen );

 if(i+side== BarCount) PlotText( "\n4    " + h4[ i ], i, h4[ i ]-dist[i], colorRed );
if(i+side== BarCount) PlotText( "\n4    " + l4[ i ], i, l4[ i ]-dist[i], colorBrightGreen );

}


Title =
EncodeColor(colorYellow)+ "" + "  " +  Name() + " - "  +"O "+WriteVal(O,1.2)+" "+"H "+WriteVal(H,1.2)+"  L"+WriteVal(L,1.2)+"    C "+WriteVal(C,1.2)+" Vol "+WriteVal(V,1.0)
+ EncodeColor(colorGold) +  "  - " + Date() +" - "
//+ WriteIf ((e3>e45) ,EncodeColor(colorLime)+ "      Direction : LONG",EncodeColor(colorRed)+"      Direction : SHORT")
+"\n"
+ WriteIf (Sell , " EXIT LONG / Reverse Signal at "+C+"\n","")
+ WriteIf (Buy , " EXIT SHORT / Reverse Signal at "+C+"\n","")

+WriteIf(Sell , "Total Profit / Loss for the Last Trade Rs."+(C-BuyPrice)+"","")+
WriteIf(Buy , "Total Profit / Loss for the Last trade Rs."+(SellPrice-C)+"","")+
WriteIf(Long AND NOT Buy,EncodeColor(colorLime)+  "Trade : Long - Entry price Rs."+(BuyPrice)+" Tgt : "+UL,"")+
WriteIf(shrt AND NOT Sell,EncodeColor(colorRed)+ "Trade : Short - Entry price Rs."+(SellPrice)+" Tgt : "+LL,"")+"\n"+
WriteIf(Long AND NOT Buy, "Current Profit / Loss Rs."+(C-BuyPrice)+"","")+
WriteIf(shrt AND NOT Sell, "Current Profit / Loss Rs."+(SellPrice-C)+"","")
+ EncodeColor(colorBrightGreen)+   "\n R3 : "+ EncodeColor(colorWhite)+h3
+ EncodeColor(colorBrightGreen)+   "\n R2 : "+ EncodeColor(colorWhite)+h2
+ EncodeColor(colorBrightGreen)+   "\n R1 : "+ EncodeColor(colorWhite)+h1 + EncodeColor(colorBrightGreen)+  "     UP TGT   : "+ EncodeColor(colorWhite)+h4
+ EncodeColor(colorBlue)+   "\n Pivot : "+ EncodeColor(colorWhite)+piv1+ EncodeColor(colorBlue)+   "     MIDPOINT : "+ EncodeColor(colorWhite)+piv
+ EncodeColor(colorRed)+   "\n S1 : "+ EncodeColor(colorWhite)+l1   + EncodeColor(colorRed)+    "     BOT TGT  : "+ EncodeColor(colorWhite)+L4
+ EncodeColor(colorRed)+   "\n S2 : "+ EncodeColor(colorWhite)+l2
+ EncodeColor(colorRed)+   "\n S3 : "+ EncodeColor(colorWhite)+l3;


/*


for( i = 0; i < BarCount; i++ )
{
 if( Buy[i] )
 {

OUTcolor = ParamColor("Outer Panel Color",colorWhite);
INUPcolor = ParamColor("Inner Panel Upper",colorAqua);
INDNcolor = ParamColor("Inner Panel Lower",colorWhite);
TitleColor = ParamColor("Title Color ",colorBlack);
SetChartBkColor(OUTcolor); // color of outer border
SetChartBkGradientFill(INUPcolor,INDNcolor,TitleColor); // color of inner panel
}
if( Sell[i] )
{
OUTcolor = ParamColor("Outer Panel Color",colorTeal);
INUPcolor = ParamColor("Inner Panel Upper2",colorBlueGrey);
INDNcolor = ParamColor("Inner Panel Lower2",colorWhite);
TitleColor = ParamColor("Title Color ",colorBlack);
SetChartBkColor(OUTcolor); // color of outer border
SetChartBkGradientFill(INUPcolor,INDNcolor,TitleColor); // color of inner panel
}
}
*/

SN = Status("StockNum");
DT = DateTime();
DN = DateNum();
NumBars = Cum(1);
NewDay = DateNum() != Ref(DateNum(),-1);
DayCount = Cum(Newday);
HoleCount = Cum(V==0);
//O = O;
//Plot(C,"A filled Bar is Red",colorDefault,styleCandle);

Filter=Status("LastBarInTest");
Filter = Buy OR Sell;
//col3=IIf( buy>sell, colorBrightGreen, IIf( buy<sell, colorRed, 0 ));
_SECTION_END();
AddColumn( IIf( Buy, 66, 83 ), "Signal", formatChar );
 AddColumn(Close,"Close",1.2);
AddColumn(C-BuyPrice,"P / L",1.0);
AddColumn(SellPrice-C,"P / L",1.0);
AddColumn(Volume,"Volume",1.0);
Cond13=PDI()>MDI();

_SECTION_END();
SetOption("NoDefaultColumns",False);
AddColumn(HoleCount,"#Holes",1.0);
AddColumn(SN,"Stock#",1.0);
AddColumn(NumBars,"#Bars",1.0);
AddColumn(DayCount,"#Days",1.0);
AddColumn(DT[0],"From",formatDateTime);
AddColumn(DT[BarCount-1],"To",formatDateTime);
_SECTION_BEGIN("Price Line");

//Magfied Market Price

FS=Param("Font Size",30,11,100,1);

GfxSelectFont("Times New Roman", FS, 700, True );

GfxSetBkMode( colorPaleBlue );

GfxSetTextColor( ParamColor("Color",colorBrightGreen) );

Hor=Param("Horizontal Position",383,1,1200,1);

Ver=Param("Vertical Position",12,1,830,1);

GfxTextOut(""+C, Hor , Ver );

YC=TimeFrameGetPrice("c",inDaily,-1);

DD=Prec(C-YC,2);

xx=Prec((DD/YC)*100,2);

GfxSelectFont("Times New Roman", 11, 700, True );

GfxSetBkMode( colorBlack );

GfxSetTextColor(ParamColor("Color",colorYellow) );

GfxTextOut(""+DD+"  ("+xx+"%)", Hor , Ver+45 );


MO=MA(O,40);
ML=MA(L,40);
MH=MA(H,40);

Plot(MO,"",colorBlue,styleDashed);
Plot(ML,"",4,styleDashed);
Plot(MH,"",colorDarkGreen,styleDashed);
PlotOHLC( mo, mo, ml, ml, "u" + Name(), colorBlueGrey, styleCloud | styleNoLabel );
PlotOHLC( ml, ml, mh, mh, "v" + Name(), colorLightBlue, styleCloud | styleNoLabel );
5 comments
Leave Comment
Please login here to leave a comment.
Back
thanx a lot admin and traders….
thanks
how to use
what time frame for banknifty,crudeoil,stocks
its accuracy
In my view 30min or 1hr is best timeframe..
Thanks a lot Jaipal sir
hi, Jaipal sir,
how to use this afl?
Can you teach us?