Stock Portfolio Organizer

The ultimate porfolio management solution.

Shares, Margin, CFD's, Futures and Forex
EOD and Realtime
Dividends and Trust Distributions
And Much More ....
For Portfolio Manager Click Here

WiseTrader Toolbox

#1 Selling Amibroker Plugin featuring:

Advanced Adaptive Indicators
Advanced Pattern Exploration
Neural Networks
And Much More ....
Find Out More Here

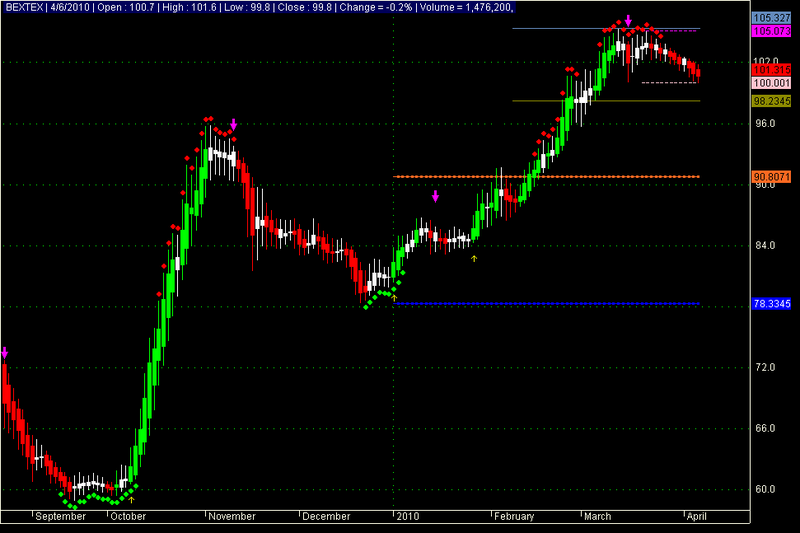
Flower for Amibroker (AFL)
emonsyl
about 14 years ago
Amibroker (AFL)

Rating:
3 / 5 (Votes 41)
Tags:
trading system, amibroker, support, resistance

See this indicator this is very good in use specially its support & resistance. we are using this in Dhaka Stock exchange bangladesh..so enjoy

Screenshots

Similar Indicators / Formulas

FHB Advanced Trading System
Submitted by vishyvishy about 14 years ago
SUPPORT AND RESISTANCE WITH FIB
Submitted by siva almost 14 years ago
Grafic & Linear Regression Channel
Submitted by morgen about 13 years ago
Trading System by ISFANDI
Submitted by sajid over 13 years ago
Sharone System
Submitted by panno over 13 years ago
RAJASWAMY NIFTY CLINIC
Submitted by rajaswamy almost 13 years ago
You cannot view the code for the following reasons:
  • You must be a member and have contributed at least 1 indicator

50 comments

1. windmild_15

nice indicator…thanks

2. sultan

nice indicator…thanks

3. janet0211

nice indicator

4. morin890

i cant watch it

5. abualfoooz

nice indicator

6. tuannm

nice indicator!

7. tuannm

nice indicator!

8. dpk23

how to use this chart ?

9. cnbondre

This is one of the best indicators in our Library.

10. administrator

I agree this is a very well written indicator someone took a lot of time and effort on it.

11. abrarcu

very

12. kuli

thanks

13. emadiarhh

very nice indicator

14. douple

very nice indicator

16. CatandDog

good work

17. rajaswamy

good indicatore sir but unable to make profit with this

18. bdrony8

i can’t see any code here

19. jibonsheikh11

i cant see any formula sir

20. nvibia

nice indicator

21. suri9192

i cant see any formula sir, can u provide me. Pls

22. tdwl

i cant see any formula sir

23. anandnst

Good indicator but NO PROFITS

24. irfan_shaikh

http://www.wisestocktrader.com/indicators/586-flower

25. moneybul

nice formula

26. arazot

good

27. SUMIT JHANWAR

GOOD

28. wwr

Thanks

29. jumpingoption

NICE

30. pulakesh13

i can not seeing that afl

31. shariful

thanks admin… for providing rare opportunity by introducing numerous AFL towards facilitating us become a good trader…
Here tips for this code..for picking prospective scripts firstly scan by this afl and manually choose the stock to buy

32. muruganjantham

goood indicarott

33. Daim

nice indicator

34. sriniwas911

how to download this code plz help me

35. lukaszplewa

good

36. szgolyas

please copy formula . i cant see formula

37. rayquaza

thx

38. acchiang

Can;t see the indicator ? please help, i am using 6.00.2 version

There is an error on row 51
shapeUpArrow = Param(“Buy Shape Typ”,59,1,60,1);

Msg : Error 55. Invalid assignment. The identifier is ready-only (constant) and can not be written to.

39. banthanoi

nice

40. maheshsairam86

_SECTION_BEGIN(“NSEMCX Charts”);
NSEMCXCharts();
_SECTION_END();

41. maheshsairam86

pls upload the afl

42. cwiyaporns

nice indicator

43. Pascal SAMSON

Hello Admin,

It seems that this indi does not work on the latest version of AMIBROKER.

shapeUpArrow = Param(“Buy Shape Typ”,59,1,60,1);
Error 55 Invalid assignment. The identifier is read-only {constant} and cannot be written to.
Any idea to fix it, as it’s a very good code?

Best regards,

Pascal

44. administrator

Just do a search and replace of ‘shapeUpArrow’ with something else such as ‘myShapeUpArrow’

45. Pascal SAMSON

Thanks. It works. You are efficient.
Regards,
Pascal

46. pujaa

How can I download this indicater

47. ggontop

Thanks man !

48. ondrgsh

woww

49. ali2112

nice

50. hezar dastan

hello
i dont know why dont work:

//www.aflcode.com
SetChartOptions(0,chartShowArrows|chartShowDates);

_SECTION_BEGIN("Background_Setting");
SetChartBkGradientFill( ParamColor("BgTop", colorBlack),

ParamColor("BgBottom", colorBlack),ParamColor("titleblock",colorDarkTeal ));
_SECTION_END();


_SECTION_BEGIN("Flower");
Prd1=Param("ATR Period",4,1,20,1);
Prd2=Param("Look Back",7,1,20,1);
green = HHV(LLV(L,Prd1)+ATR(Prd1),Prd2);
red = LLV(HHV(H,Prd1)-ATR(Prd1),Prd2);
flowerClose = EMA((Open+High+Low+Close)/4,3) ;
flowerOpen = EMA((Ref(Open,-1) + Ref(flowerClose,-1))/2,3);
Temp = Max(High, flowerOpen);
flowerHigh = EMA(Max(Temp, flowerClose),3);
Temp = Min(Low,flowerOpen);
flowerLow = EMA(Min(Temp, flowerClose),3);
barColor=IIf(C>Green ,colorBrightGreen,IIf(C < RED,colorRed,colorWhite));
PlotOHLC( IIf(flowerOpen<flowerClose, flowerOpen, flowerClose),flowerHigh,flowerLow,IIf(flowerOpen<flowerClose, flowerClose, flowerOpen), "Close", barColor, styleNoTitle | styleCandle);


_SECTION_END();

_SECTION_BEGIN("OsSetting");

OBSetting=Param("Setting",45,1,500,1);
Bline = StochD(OBSetting);
Oversold=Bline<=30;
Overbought=Bline>=85;


PlotShapes (IIf(Oversold, shapeSmallCircle, shapeNone) ,colorBrightGreen, layer = 0, yposition = flowerLow, offset = -8 );
PlotShapes (IIf(Overbought, shapeSmallCircle, shapeNone) ,colorRed, layer = 0, yposition = flowerHigh, offset = 7 );
_SECTION_END();

_SECTION_BEGIN("Breakout Setting");
Buyperiods=Param("Breakout periods best is usually 18",5,1,100,1,1); //10 is good for adding
Sellperiods=Param("Exit Breakout",6,1,100,1,1); //4 is good for adding
Buy= C>Ref(HHV(H,Buyperiods),-1);
Sell= O<Ref(LLV(O,Sellperiods),-1);

/* exrem is one method to remove surplus strade signals. It removes excessive signals of arrow */
top=Max(Close,Ref(Close,-1));

Buy = ExRem(Buy, Sell);
Sell = ExRem(Sell, Buy);
shapeUpArrow = Param("Buy Shape Typ",59,1,60,1);
//shapeDownArrow = Param("Sell Shape Typ",60,1,60,1);
PlotShapes(shapeUpArrow * Buy, ParamColor("Buy Arrow", colorYellow),0,flowerLow, - 15);
//PlotShapes(shapeDownArrow * Sell, ParamColor("sell Arrow", colorRed),0,flowerLow, - 15);
PlotShapes( IIf( Sell, shapeDownArrow, shapeNone ), colorCustom12, layer = 0, yposition = top, offset = -60  );


_SECTION_END();


_SECTION_BEGIN("Parameters");
LB1= Param("Long LookBack Periods",42,1,60,1);
LB3= Param("Mid LookBack Periods",18,1,30,1);
LB2= Param("Short LookBack Periods",6,1,30,1);

_SECTION_END();


_SECTION_BEGIN("ResistanceLong");

RsColor=ParamColor("LongResColor",colorOrange);
BrCount=Param("LongBarLength",65,1,500,1);
for (i=0;i<BarCount-BrCount;i++) //hide the line except most recent 10 bars
{
 RsColor[i] = colorBlack;
}

flowerClose = EMA((Open+High+Low+Close)/4,3) ;
flowerOpen = EMA((Ref(Open,-1) + Ref(flowerClose,-1))/2,3);
Temp = Max(High, flowerOpen);
flowerHigh = EMA(Max(Temp, flowerClose),3);
Temp = Min(Low,flowerOpen);
flowerLow = EMA(Min(Temp, flowerClose),3);

R=ValueWhen(Cross(MA(flowerClose,LB1),C),HHV(flowerHigh,LB1),-1);
Plot(R,"Resistance",RsColor,ParamStyle("LongResStyle",styleNoTitle|styleLine|styleDots|styleStaircase|styleThick,maskAll));
_SECTION_END();

_SECTION_BEGIN("ResistanceMid");
Rs3Color=ParamColor("MidResColor",colorCustom4);
BrCount3=Param("MidBarLength",40,1,500,1);
for (i=0;i<BarCount-BrCount3;i++) //hide the line except most recent 10 bars
{
 Rs3Color[i] =colorBlack;
}

flowerClose = EMA((Open+High+Low+Close)/4,3) ;
flowerOpen = EMA((Ref(Open,-1) + Ref(flowerClose,-1))/2,3);
Temp = Max(High, flowerOpen);
flowerHigh = EMA(Max(Temp, flowerClose),3);
Temp = Min(Low,flowerOpen);
flowerLow = EMA(Min(Temp, flowerClose),3);

RM2=ValueWhen(Cross(EMA(flowerClose,LB3),C),HHV(flowerHigh,LB3),-1);
Plot(RM2,"MidRes",Rs3Color,ParamStyle("MidResStyle",styleLine|styleStaircase|styleNoTitle,maskAll));
_SECTION_END();

_SECTION_BEGIN("ResistanceShort");
Rs2Color=ParamColor("ShortResColor",colorCustom12);
BrCount2=Param("ShortResLength",12,1,500,1);
for (i=0;i<BarCount-BrCount2;i++) //hide the line except most recent 10 bars
{
 Rs2Color[i] = colorBlack;
}

flowerClose = EMA((Open+High+Low+Close)/4,3) ;
flowerOpen = EMA((Ref(Open,-1) + Ref(flowerClose,-1))/2,3);
Temp = Max(High, flowerOpen);
flowerHigh = EMA(Max(Temp, flowerClose),3);
Temp = Min(Low,flowerOpen);
flowerLow = EMA(Min(Temp, flowerClose),3);

RM=ValueWhen(Cross(TEMA(flowerClose,LB2),C),HHV(flowerHigh,LB2),-1);
Plot(RM,"ShortRes",Rs2Color,ParamStyle("ShortResStyle",styleDashed|styleThick|styleNoTitle|styleStaircase,maskAll));
_SECTION_END();


_SECTION_BEGIN("SupportLong");
Sup1Color=ParamColor("LongSupColor",colorBlue);
BrCount4=Param("LongSupBarLength",65,1,500,1);
for (i=0;i<BarCount-BrCount4;i++) //hide the line except most recent 10 bars
{
 Sup1Color[i] =colorBlack;
}

flowerClose = EMA((Open+High+Low+Close)/4,3) ;
flowerOpen = EMA((Ref(Open,-1) + Ref(flowerClose,-1))/2,3);
Temp = Max(High, flowerOpen);
flowerHigh = EMA(Max(Temp, flowerClose),3);
Temp = Min(Low,flowerOpen);
flowerLow = EMA(Min(Temp, flowerClose),3);

S=ValueWhen(Cross(MA(flowerClose,LB1),C),LLV(flowerLow,LB1),-1);
Plot(s,"Support",Sup1Color,ParamStyle("SupStyle",styleLine|styleDots|styleStaircase|styleThick|styleNoTitle,maskAll));
_SECTION_END();

_SECTION_BEGIN("SupportMid");
Sup3Color=ParamColor("MidSupColor",colorDarkYellow);
BrCount6=Param("MidBarLength",40,1,500,1);
for (i=0;i<BarCount-BrCount6;i++) //hide the line except most recent 10 bars
{
 Sup3Color[i] =colorBlack;
}

flowerClose = EMA((Open+High+Low+Close)/4,3) ;
flowerOpen = EMA((Ref(Open,-1) + Ref(flowerClose,-1))/2,3);
Temp = Max(High, flowerOpen);
flowerHigh = EMA(Max(Temp, flowerClose),3);
Temp = Min(Low,flowerOpen);
flowerLow = EMA(Min(Temp, flowerClose),3);

SM2=ValueWhen(Cross(EMA(flowerClose,LB3),C),LLV(flowerLow,LB3),-1);
Plot(SM2,"MidSup",Sup3Color,ParamStyle("MidSupStyle",styleLine|styleStaircase|styleNoTitle,maskAll));
_SECTION_END();

_SECTION_BEGIN("SupportShort");
Sup2Color=ParamColor("ShortSupColor",colorPink);
BrCount5=Param("ShortSupBarLength",12,1,500,1);
for (i=0;i<BarCount-BrCount5;i++) //hide the line except most recent 10 bars
{
 Sup2Color[i] =colorBlack;
}


flowerClose = EMA((Open+High+Low+Close)/4,3) ;
flowerOpen = EMA((Ref(Open,-1) + Ref(flowerClose,-1))/2,3);
Temp = Max(High, flowerOpen);
flowerHigh = EMA(Max(Temp, flowerClose),3);
Temp = Min(Low,flowerOpen);
flowerLow = EMA(Min(Temp, flowerClose),3);

SM=ValueWhen(Cross(TEMA(flowerClose,LB2),C),LLV(flowerLow,LB2),-1);
Plot(SM,"ShortSup",Sup2Color,ParamStyle("ShortSupStyle",styleDashed|styleThick|styleNoTitle|styleStaircase,maskAll));
_SECTION_END();

_SECTION_BEGIN("Cloud Setting");
//Cloud
ParmCloud = ParamToggle("Cloud", "No|Yes", 0);

CloudResColor=ParamColor("CloudResColor",colorDarkTeal);
BrCount7=Param("CloudResLength",15,1,500,1);
for (i=0;i<BarCount-BrCount7;i++) //hide the line except most recent 10 bars
{
 CloudResColor[i] = colorBlack;
}

flowerClose = EMA((Open+High+Low+Close)/4,3) ;
flowerOpen = EMA((Ref(Open,-1) + Ref(flowerClose,-1))/2,3);
Temp = Max(High, flowerOpen);
flowerHigh = EMA(Max(Temp, flowerClose),3);
Temp = Min(Low,flowerOpen);
flowerLow = EMA(Min(Temp, flowerClose),3);

CS=ValueWhen(Cross(WMA(flowerClose,LB2),C),LLV(flowerLow,LB2),-1);
CR=ValueWhen(Cross(WMA(flowerClose,LB2),C),HHV(flowerHigh,LB2),-1);


if(parmCloud == 1)
{
 PlotOHLC( CS, CS, CR,CR, "Band", CloudResColor, styleCloud | styleNoLabel|styleNoTitle); 
}

_SECTION_END();


Title = StrFormat("\\c02 {{NAME}} | {{DATE}} | Open : %g | High : %g | Low : %g | Close : %g | Change = %.1f%% | Volume = " +WriteVal( V, 1.0 ) +", {{VALUES}}",
O, H, L, C, SelectedValue( ROC( C, 1 )) );


_SECTION_BEGIN("Keltner Bands");
Smooth = Param("Smoothness",14,2,100,1);
Length = 20; Num_ATRs = 1.5;
// Length and Num_ATRs parameters should be personalized for your preferred settings.

Mov_Avg = MA((H+L+C)/3,Length);
KUP = Mov_Avg + Num_ATRs * ATR(Length);
KDOWN = Mov_Avg - Num_ATRs * ATR(Length);


Plot (MA(KUP,smooth),"KUP",colorGreen,styleLine);
Plot (MA(KDown,smooth), "Kdown",colorRed,styleLine);
Plot (MA(Mov_Avg,smooth),"Mov_Avg",colorYellow , styleDashed);
_SECTION_END();
52. liquidice

Hezar, this should work

//www.aflcode.com
SetChartOptions(0,chartShowArrows|chartShowDates);

_SECTION_BEGIN("Background_Setting");
SetChartBkGradientFill( ParamColor("BgTop", colorBlack),

ParamColor("BgBottom", colorBlack),ParamColor("titleblock",colorDarkTeal ));
_SECTION_END();


_SECTION_BEGIN("Flower");
Prd1=Param("ATR Period",4,1,20,1);
Prd2=Param("Look Back",7,1,20,1);
green = HHV(LLV(L,Prd1)+ATR(Prd1),Prd2);
red = LLV(HHV(H,Prd1)-ATR(Prd1),Prd2);
flowerClose = EMA((Open+High+Low+Close)/4,3) ;
flowerOpen = EMA((Ref(Open,-1) + Ref(flowerClose,-1))/2,3);
Temp = Max(High, flowerOpen);
flowerHigh = EMA(Max(Temp, flowerClose),3);
Temp = Min(Low,flowerOpen);
flowerLow = EMA(Min(Temp, flowerClose),3);
barColor=IIf(C>Green ,colorBrightGreen,IIf(C < RED,colorRed,colorWhite));
PlotOHLC( IIf(flowerOpen<flowerClose, flowerOpen, flowerClose),flowerHigh,flowerLow,IIf(flowerOpen<flowerClose, flowerClose, flowerOpen), "Close", barColor, styleNoTitle | styleCandle);


_SECTION_END();

_SECTION_BEGIN("OsSetting");

OBSetting=Param("Setting",45,1,500,1);
Bline = StochD(OBSetting);
Oversold=Bline<=30;
Overbought=Bline>=85;


PlotShapes (IIf(Oversold, shapeSmallCircle, shapeNone) ,colorBrightGreen, layer = 0, yposition = flowerLow, offset = -8 );
PlotShapes (IIf(Overbought, shapeSmallCircle, shapeNone) ,colorRed, layer = 0, yposition = flowerHigh, offset = 7 );
_SECTION_END();

_SECTION_BEGIN("Breakout Setting");
Buyperiods=Param("Breakout periods best is usually 18",5,1,100,1,1); //10 is good for adding
Sellperiods=Param("Exit Breakout",6,1,100,1,1); //4 is good for adding
Buy= C>Ref(HHV(H,Buyperiods),-1);
Sell= O<Ref(LLV(O,Sellperiods),-1);

/* exrem is one method to remove surplus strade signals. It removes excessive signals of arrow */
top=Max(Close,Ref(Close,-1));

Buy = ExRem(Buy, Sell);
Sell = ExRem(Sell, Buy);
//shapeUpArrow = Param("Buy Shape Typ",59,1,60,1);
//shapeDownArrow = Param("Sell Shape Typ",60,1,60,1);
PlotShapes(shapeUpArrow * Buy, ParamColor("Buy Arrow", colorYellow),0,flowerLow, - 15);
//PlotShapes(shapeDownArrow * Sell, ParamColor("sell Arrow", colorRed),0,flowerLow, - 15);
PlotShapes( IIf( Sell, shapeDownArrow, shapeNone ), colorCustom12, layer = 0, yposition = top, offset = -60  );


_SECTION_END();


_SECTION_BEGIN("Parameters");
LB1= Param("Long LookBack Periods",42,1,60,1);
LB3= Param("Mid LookBack Periods",18,1,30,1);
LB2= Param("Short LookBack Periods",6,1,30,1);

_SECTION_END();


_SECTION_BEGIN("ResistanceLong");

RsColor=ParamColor("LongResColor",colorOrange);
BrCount=Param("LongBarLength",65,1,500,1);
for (i=0;i<BarCount-BrCount;i++) //hide the line except most recent 10 bars
{
 RsColor[i] = colorBlack;
}

flowerClose = EMA((Open+High+Low+Close)/4,3) ;
flowerOpen = EMA((Ref(Open,-1) + Ref(flowerClose,-1))/2,3);
Temp = Max(High, flowerOpen);
flowerHigh = EMA(Max(Temp, flowerClose),3);
Temp = Min(Low,flowerOpen);
flowerLow = EMA(Min(Temp, flowerClose),3);

R=ValueWhen(Cross(MA(flowerClose,LB1),C),HHV(flowerHigh,LB1),-1);
Plot(R,"Resistance",RsColor,ParamStyle("LongResStyle",styleNoTitle|styleLine|styleDots|styleStaircase|styleThick,maskAll));
_SECTION_END();

_SECTION_BEGIN("ResistanceMid");
Rs3Color=ParamColor("MidResColor",colorCustom4);
BrCount3=Param("MidBarLength",40,1,500,1);
for (i=0;i<BarCount-BrCount3;i++) //hide the line except most recent 10 bars
{
 Rs3Color[i] =colorBlack;
}

flowerClose = EMA((Open+High+Low+Close)/4,3) ;
flowerOpen = EMA((Ref(Open,-1) + Ref(flowerClose,-1))/2,3);
Temp = Max(High, flowerOpen);
flowerHigh = EMA(Max(Temp, flowerClose),3);
Temp = Min(Low,flowerOpen);
flowerLow = EMA(Min(Temp, flowerClose),3);

RM2=ValueWhen(Cross(EMA(flowerClose,LB3),C),HHV(flowerHigh,LB3),-1);
Plot(RM2,"MidRes",Rs3Color,ParamStyle("MidResStyle",styleLine|styleStaircase|styleNoTitle,maskAll));
_SECTION_END();

_SECTION_BEGIN("ResistanceShort");
Rs2Color=ParamColor("ShortResColor",colorCustom12);
BrCount2=Param("ShortResLength",12,1,500,1);
for (i=0;i<BarCount-BrCount2;i++) //hide the line except most recent 10 bars
{
 Rs2Color[i] = colorBlack;
}

flowerClose = EMA((Open+High+Low+Close)/4,3) ;
flowerOpen = EMA((Ref(Open,-1) + Ref(flowerClose,-1))/2,3);
Temp = Max(High, flowerOpen);
flowerHigh = EMA(Max(Temp, flowerClose),3);
Temp = Min(Low,flowerOpen);
flowerLow = EMA(Min(Temp, flowerClose),3);

RM=ValueWhen(Cross(TEMA(flowerClose,LB2),C),HHV(flowerHigh,LB2),-1);
Plot(RM,"ShortRes",Rs2Color,ParamStyle("ShortResStyle",styleDashed|styleThick|styleNoTitle|styleStaircase,maskAll));
_SECTION_END();


_SECTION_BEGIN("SupportLong");
Sup1Color=ParamColor("LongSupColor",colorBlue);
BrCount4=Param("LongSupBarLength",65,1,500,1);
for (i=0;i<BarCount-BrCount4;i++) //hide the line except most recent 10 bars
{
 Sup1Color[i] =colorBlack;
}

flowerClose = EMA((Open+High+Low+Close)/4,3) ;
flowerOpen = EMA((Ref(Open,-1) + Ref(flowerClose,-1))/2,3);
Temp = Max(High, flowerOpen);
flowerHigh = EMA(Max(Temp, flowerClose),3);
Temp = Min(Low,flowerOpen);
flowerLow = EMA(Min(Temp, flowerClose),3);

S=ValueWhen(Cross(MA(flowerClose,LB1),C),LLV(flowerLow,LB1),-1);
Plot(s,"Support",Sup1Color,ParamStyle("SupStyle",styleLine|styleDots|styleStaircase|styleThick|styleNoTitle,maskAll));
_SECTION_END();

_SECTION_BEGIN("SupportMid");
Sup3Color=ParamColor("MidSupColor",colorDarkYellow);
BrCount6=Param("MidBarLength",40,1,500,1);
for (i=0;i<BarCount-BrCount6;i++) //hide the line except most recent 10 bars
{
 Sup3Color[i] =colorBlack;
}

flowerClose = EMA((Open+High+Low+Close)/4,3) ;
flowerOpen = EMA((Ref(Open,-1) + Ref(flowerClose,-1))/2,3);
Temp = Max(High, flowerOpen);
flowerHigh = EMA(Max(Temp, flowerClose),3);
Temp = Min(Low,flowerOpen);
flowerLow = EMA(Min(Temp, flowerClose),3);

SM2=ValueWhen(Cross(EMA(flowerClose,LB3),C),LLV(flowerLow,LB3),-1);
Plot(SM2,"MidSup",Sup3Color,ParamStyle("MidSupStyle",styleLine|styleStaircase|styleNoTitle,maskAll));
_SECTION_END();

_SECTION_BEGIN("SupportShort");
Sup2Color=ParamColor("ShortSupColor",colorPink);
BrCount5=Param("ShortSupBarLength",12,1,500,1);
for (i=0;i<BarCount-BrCount5;i++) //hide the line except most recent 10 bars
{
 Sup2Color[i] =colorBlack;
}


flowerClose = EMA((Open+High+Low+Close)/4,3) ;
flowerOpen = EMA((Ref(Open,-1) + Ref(flowerClose,-1))/2,3);
Temp = Max(High, flowerOpen);
flowerHigh = EMA(Max(Temp, flowerClose),3);
Temp = Min(Low,flowerOpen);
flowerLow = EMA(Min(Temp, flowerClose),3);

SM=ValueWhen(Cross(TEMA(flowerClose,LB2),C),LLV(flowerLow,LB2),-1);
Plot(SM,"ShortSup",Sup2Color,ParamStyle("ShortSupStyle",styleDashed|styleThick|styleNoTitle|styleStaircase,maskAll));
_SECTION_END();

_SECTION_BEGIN("Cloud Setting");
//Cloud
ParmCloud = ParamToggle("Cloud", "No|Yes", 0);

CloudResColor=ParamColor("CloudResColor",colorDarkTeal);
BrCount7=Param("CloudResLength",15,1,500,1);
for (i=0;i<BarCount-BrCount7;i++) //hide the line except most recent 10 bars
{
 CloudResColor[i] = colorBlack;
}

flowerClose = EMA((Open+High+Low+Close)/4,3) ;
flowerOpen = EMA((Ref(Open,-1) + Ref(flowerClose,-1))/2,3);
Temp = Max(High, flowerOpen);
flowerHigh = EMA(Max(Temp, flowerClose),3);
Temp = Min(Low,flowerOpen);
flowerLow = EMA(Min(Temp, flowerClose),3);

CS=ValueWhen(Cross(WMA(flowerClose,LB2),C),LLV(flowerLow,LB2),-1);
CR=ValueWhen(Cross(WMA(flowerClose,LB2),C),HHV(flowerHigh,LB2),-1);


if(parmCloud == 1)
{
 PlotOHLC( CS, CS, CR,CR, "Band", CloudResColor, styleCloud | styleNoLabel|styleNoTitle); 
}

_SECTION_END();


Title = StrFormat("\\c02 {{NAME}} | {{DATE}} | Open : %g | High : %g | Low : %g | Close : %g | Change = %.1f%% | Volume = " +WriteVal( V, 1.0 ) +", {{VALUES}}",
O, H, L, C, SelectedValue( ROC( C, 1 )) );


_SECTION_BEGIN("Keltner Bands");
Smooth = Param("Smoothness",14,2,100,1);
Length = 20; Num_ATRs = 1.5;
// Length and Num_ATRs parameters should be personalized for your preferred settings.

Mov_Avg = MA((H+L+C)/3,Length);
KUP = Mov_Avg + Num_ATRs * ATR(Length);
KDOWN = Mov_Avg - Num_ATRs * ATR(Length);


Plot (MA(KUP,smooth),"KUP",colorGreen,styleLine);
Plot (MA(KDown,smooth), "Kdown",colorRed,styleLine);
Plot (MA(Mov_Avg,smooth),"Mov_Avg",colorYellow , styleDashed);
_SECTION_END();

Leave Comment

Please login here to leave a comment.

Back