Stock Portfolio Organizer
The ultimate porfolio management solution.
Shares, Margin, CFD's, Futures and Forex
EOD and Realtime
Dividends and Trust Distributions
And Much More ....
WiseTrader Toolbox
#1 Selling Amibroker Plugin featuring:
Advanced Adaptive Indicators
Advanced Pattern Exploration
Neural Networks
And Much More ....
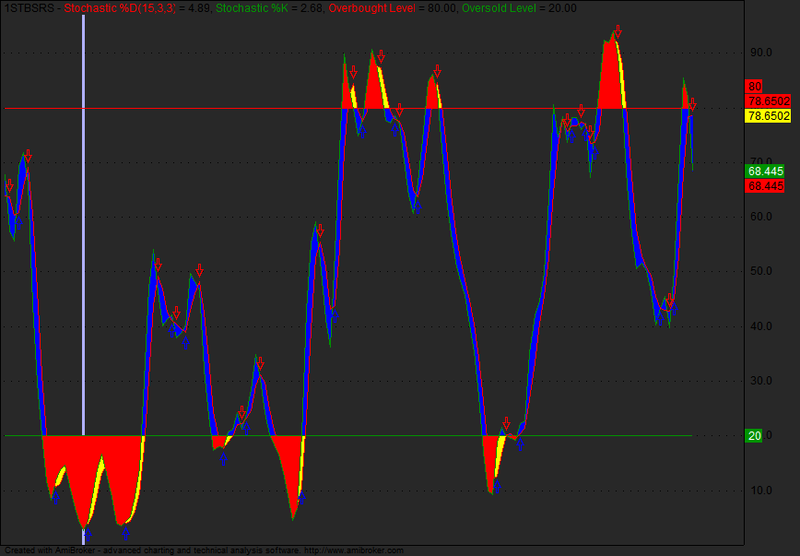
Stochastic for Amibroker (AFL)
Rating:
3 / 5 (Votes 6)
Tags:
oscillator, trading system, amibroker
this formula work seem like rsi but it shows risk zone & simple zone
Screenshots
Similar Indicators / Formulas
Rahul Mohindar Oscillator (RMO)
Submitted
by kaiji over 15 years ago
Price Oscillator
Submitted
by ariful_islam over 14 years ago
1 hour stoch
Submitted
by siddhisagar over 14 years ago
Simple Chaikin Buy Sell
Submitted
by jachyuen over 13 years ago
Nj demand and supply
Submitted
by njethva over 12 years ago
Heikin-Ashi Candles Oscillator for Long term
Submitted
by NTA over 12 years ago
Indicator / Formula
Copy & Paste Friendly
1 2 3 4 5 6 7 8 9 10 11 12 13 14 15 16 17 18 19 20 21 22 23 24 25 26 27 28 29 30 | _SECTION_BEGIN("Stochastic");periods = Param( "Periods", 15, 1, 200, 1 );Ksmooth = Param( "%K avg", 3, 1, 200, 1 );Dsmooth = Param( "%D avg", 3, 1, 200, 1 );myStochD=StochD( periods , Ksmooth, DSmooth );myStochK=StochK( periods , Ksmooth);Overbought=80;Oversold=20;Buy = Cross(myStochK, myStochD );Sell = Cross( myStochD, myStochK );Plot( myStochD, "Stochastic %D"+_PARAM_VALUES(), ParamColor( "ColorD", colorRed ), ParamStyle("StyleD") );Plot( myStochK, "Stochastic %K", ParamColor( "ColorK", colorGreen ), ParamStyle("StyleK") );PlotShapes(IIf(Sell, shapeHollowDownArrow , shapeNone), colorRed);PlotShapes(IIf(Buy, shapeHollowUpArrow , shapeNone), colorBlue);Plot(Overbought,"Overbought Level",colorRed);Plot(Oversold,"Oversold Level",colorGreen); PlotOHLC( myStochK,myStochK,50,myStochK, "", colorRed, styleCloud | styleClipMinMax, 20, 80 );PlotOHLC( myStochD,myStochD,50,myStochD, "", colorYellow, styleCloud | styleClipMinMax, 20, 80 );PlotOHLC( Null,myStochD,myStochK,Null, "", colorBlue, styleCloud); _SECTION_END(); |
0 comments
Leave Comment
Please login here to leave a comment.
Back