Stock Portfolio Organizer
The ultimate porfolio management solution.
Shares, Margin, CFD's, Futures and Forex
EOD and Realtime
Dividends and Trust Distributions
And Much More ....
WiseTrader Toolbox
#1 Selling Amibroker Plugin featuring:
Advanced Adaptive Indicators
Advanced Pattern Exploration
Neural Networks
And Much More ....
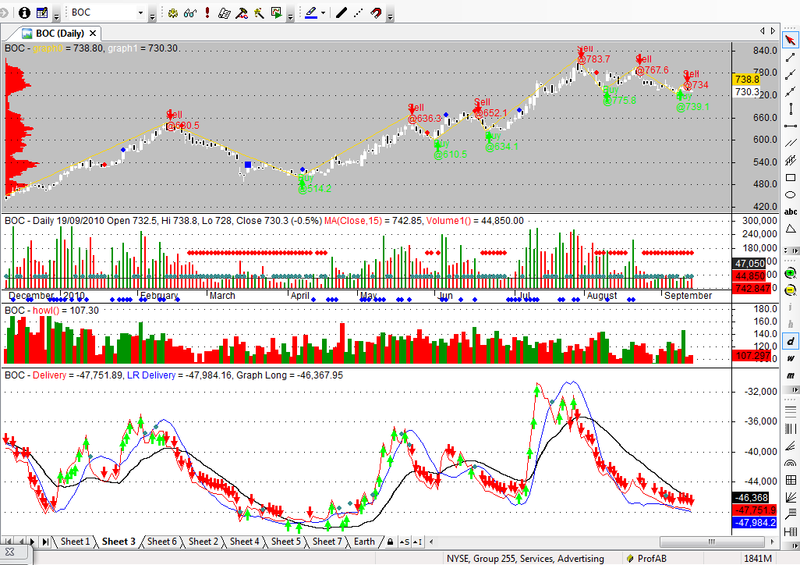
Volume Delivery for Amibroker (AFL)
Rating:
3 / 5 (Votes 2)
Tags:
trading system, amibroker
This is volume accumulation indicator. need some face uplift but works fine.
Screenshots
Similar Indicators / Formulas
weighted moving average scan
Submitted
by naninn about 14 years ago
Kase Peak Osc. V2 batu
Submitted
by batu1453 over 10 years ago
Kase CD V2batu
Submitted
by batu1453 over 10 years ago
Ichimoku
Submitted
by prashantrdx almost 11 years ago
EMA System Ribbon
Submitted
by yo123 about 14 years ago
Three-Bar Inside Bar Pattern
Submitted
by EliStern about 14 years ago
Indicator / Formula
Copy & Paste Friendly
1 2 3 4 5 6 7 8 9 10 11 12 13 14 15 16 17 18 19 20 21 22 23 24 25 26 27 28 29 30 31 32 33 34 35 36 37 38 39 | //Volume Delivery V1.1//By M3trail@yahoo.com_SECTION_BEGIN("DVI");function DailyVolumeIndicator(){ midpoint = ( High + Low ) / 2; dv = Volume * (( Close - midpoint ) / midpoint); return Cum( dv );}Plot( DailyVolumeIndicator(), "Delivery", ParamColor( "Color", ColorCycle ) ); _SECTION_END();_SECTION_BEGIN("Linear Regression");P = ParamField("Price field",-1);Periods = Param("Periods", 20, 2, 300, 1, 10 );Plot( LinearReg( P, Periods ), "LR Delivery", ParamColor( "Color", colorCycle ), ParamStyle("Style") ); _SECTION_END();tdown=( LinearReg( DailyVolumeIndicator(), Periods ))<Ref(( LinearReg( DailyVolumeIndicator(), Periods )),-1) AND (DailyVolumeIndicator()<Ref(DailyVolumeIndicator(),-1));tup=( LinearReg( DailyVolumeIndicator(), Periods ))>Ref(( LinearReg( DailyVolumeIndicator(), Periods )),-1) AND (DailyVolumeIndicator()>Ref(DailyVolumeIndicator(),-1));xup= Cross(DailyVolumeIndicator(),( LinearReg( DailyVolumeIndicator(), Periods )));Buy=(tup OR xup) AND NOT ( LinearReg( DailyVolumeIndicator(), Periods ))<Ref(( LinearReg( DailyVolumeIndicator(), Periods )),-1);xdown=Cross(( LinearReg( DailyVolumeIndicator(), Periods )),DailyVolumeIndicator()) ;Sell=tdown OR xdown AND NOT ( LinearReg( DailyVolumeIndicator(), Periods ))>Ref(( LinearReg( DailyVolumeIndicator(), Periods )),-1);PlotShapes (IIf(Buy,shapeUpArrow,shapeNone) ,colorBrightGreen);PlotShapes (IIf(Sell,shapeDownArrow,shapeNone) ,colorRed);PlotShapes (IIf(xdown,shapeSmallCircle + shapePositionAbove,shapeNone) ,colorTeal);_SECTION_BEGIN("TEMA");P = ParamField("Price field",-1);Periods = Param("Periods", 60, 2, 300, 1, 10 );Plot( TEMA( P, Periods ), "Graph Long", colorBlack, styleThick ); _SECTION_END(); |
1 comments
Leave Comment
Please login here to leave a comment.
Back
SIR IT HAS NOT SHOWING ANY THINK SO PLS GUIDE ME HOW TO RESOLVE THE PROBLEM I LIKE TO SEE THE INDICTORE