Stock Portfolio Organizer
The ultimate porfolio management solution.
Shares, Margin, CFD's, Futures and Forex
EOD and Realtime
Dividends and Trust Distributions
And Much More ....
WiseTrader Toolbox
#1 Selling Amibroker Plugin featuring:
Advanced Adaptive Indicators
Advanced Pattern Exploration
Neural Networks
And Much More ....
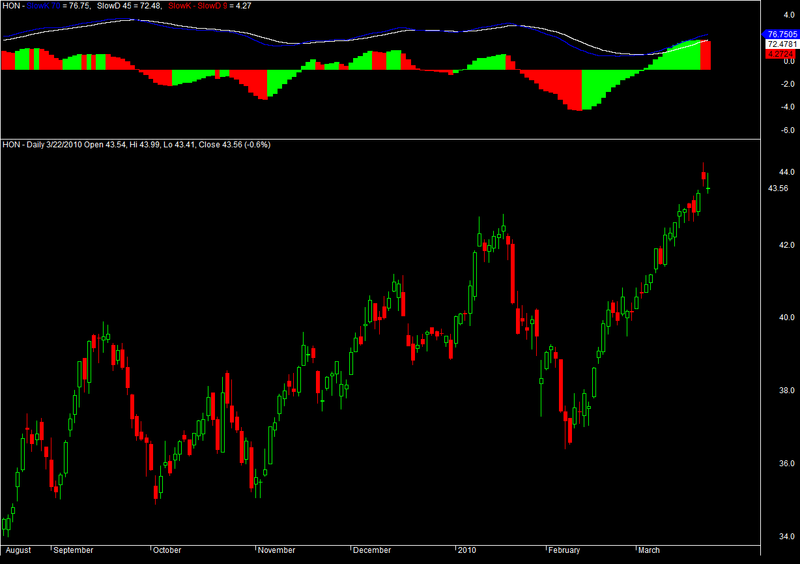
Stochastic (Generic) for Amibroker (AFL)
Rating:
3 / 5 (Votes 2)
Tags:
oscillator, amibroker, optimize
Create Stochastics line and histogram charts with variable parameters according to the following formula;
enjoy
Screenshots
Similar Indicators / Formulas
Double SMI (stochastic Momentum Index)
Submitted
by ecredic over 13 years ago
BollingerLine indicator
Submitted
by Dryden about 13 years ago
Combination MACD RMO ICHIMOKU
Submitted
by dovanquang0404 almost 12 years ago
4 MACD for optimisation
Submitted
by DOMINATOR almost 15 years ago
Stochastic (Generic) for Amibroker
Submitted
by 123flex456 almost 14 years ago
Indicator / Formula
Copy & Paste Friendly
1 2 3 4 5 6 7 8 9 10 11 12 13 14 15 16 17 18 19 20 21 22 23 24 25 26 27 28 29 30 31 32 33 34 35 36 37 38 39 40 41 42 | _SECTION_BEGIN("Stochastic (Generic)");//Create Stochastics line and histogram charts with variable parameters according to the following formula;//100 * (C - Y) / (X - Y) //Where: //C = Close //X = the Highest High value ( HHV ) over some period of time ( Len1 OR in this case 70 bars ) //Y = the Lowest Low value ( LLV ) over some period of time ( Len1 OR in this case 70 bars )//Set the parametersLen1 = Param("Slow",70,1,100,1); Len2 = Param("Fast",45,1,100,1); Len3 = Param("trigger",9,1,50,1); //Do the MathHH = HHV(C, Len1); LL = LLV(C, Len1); FastK = 100 * (C - LL) / (HH - LL); SlowK = EMA(FastK, Len2); SlowD = EMA(SlowK, Len3); Diff = SlowK - SlowD; //Display your workPlot(SlowK, "SlowK "+Len1, colorBlue, styleThick | styleOwnScale, 0, 100); Plot(SlowD, " SlowD "+Len2, colorWhite, styleThick | styleOwnScale, 0, 100); Plot(Diff, " SlowK - SlowD "+Len3, IIf(Diff > Ref(Diff, -1), colorBrightGreen, colorRed), styleArea | styleOwnScale, -10, 10);_SECTION_END();//Create statements for use in the Automatic Analyzer//Optimize parametersLen1 = Optimize( "Slow",20, 1, 100, 2 ); Len2 = Optimize("Fast", 40, 1, 100, 2 ); Len3 = Optimize( "Trigger", 3, 1, 50, 2 );//Create Buy/Sell statementsBuy = Cross(SlowK, slowD);Sell = Cross(SlowK, SlowD); |
0 comments
Leave Comment
Please login here to leave a comment.
Back