Stock Portfolio Organizer
The ultimate porfolio management solution.
Shares, Margin, CFD's, Futures and Forex
EOD and Realtime
Dividends and Trust Distributions
And Much More ....
WiseTrader Toolbox
#1 Selling Amibroker Plugin featuring:
Advanced Adaptive Indicators
Advanced Pattern Exploration
Neural Networks
And Much More ....
VPCI for Amibroker (AFL)
Rating:
3 / 5 (Votes 3)
Tags:
oscillator, amibroker
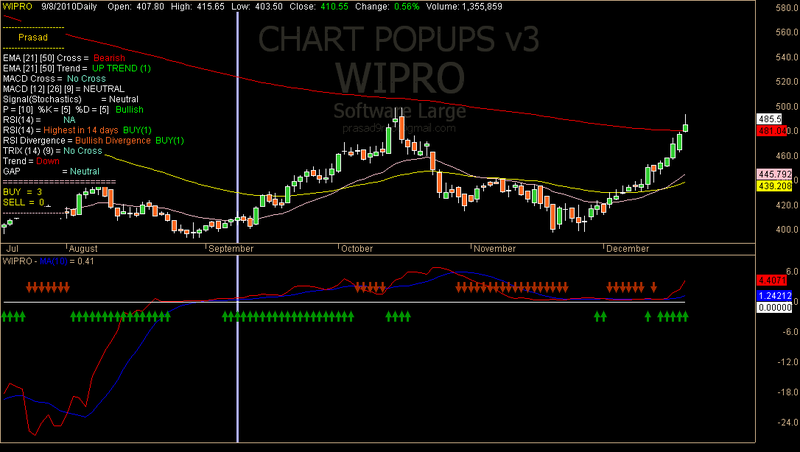
I have formulated the Volume Price Control Indicator.
THe buy and the sell signals are congested.
If anyone can throw light to improve this further.
rEGARDS,
Prasad Rao.
Screenshots
Similar Indicators / Formulas
3 Days Track
Submitted
by janet0211 about 15 years ago
Trading Volume Statistic
Submitted
by tuanstock1 about 11 years ago
Ergodic Oscillator
Submitted
by dljtrader over 14 years ago
BoH Risk Aversion Indicator
Submitted
by genkumag over 13 years ago
Chande Momentum Oscillator
Submitted
by klimpek over 14 years ago
Indicator / Formula
Copy & Paste Friendly
1 2 3 4 5 6 7 8 9 10 11 12 13 14 15 16 17 18 19 20 21 22 23 24 25 26 27 28 29 30 31 32 33 34 35 36 37 38 39 40 41 42 43 44 45 46 47 48 49 50 51 52 53 54 55 56 57 58 59 60 61 62 63 64 65 66 67 68 69 70 71 | /*Volume-weighted average = Sum {closing price (I) * [Volume (I)/(total range)]} where I = given Day’s action.*/Days = Days1 =LINE_ZERO =0;vpci_zero= 0;S_PERIOD = Param("vm sHORT",5,1,50,1);L_PERIOD = Param("vm LONG",20,1,100,1);/////////****************VWMA********************/S_VWMA = Sum(C*V,S_PERIOD)/Sum(V,S_PERIOD);L_VWMA = Sum(C*V,L_PERIOD)/Sum(V,L_PERIOD);VWMA = S_VWMA + L_VWMA;printf("Close Short %g \n",Ref(C,S_PERIOD-1));printf("VOLCUM %g \n",(Ref(V,S_PERIOD)+Ref(V,L_PERIOD)));printf("LPERIODA %g \n",L_PERIOD);printf("LVWMA %g \n",L_VWMA);printf("SPERIODA %g \n",S_PERIOD);printf("SVWMA %g \n",S_VWMA);printf("VWMA %g \n\n",VWMA);/////////****************VPC********************/VPC = L_VWMA - MA(C,L_PERIOD);printf("MA long %g \n",MA( C,L_PERIOD));VPR = S_VWMA / MA(C,S_PERIOD);printf("VPR %g \n",VPR);Vol_multi = MA(V,S_PERIOD)/MA(V,L_PERIOD);printf("VPC %g \n",VPC);printf("vOL_MULTI %g \n",Vol_multi);VPCI = VPR * Vol_multi * VPC;printf("VPCI = %g \n",VPCI);Plot(vpci_zero,"",colorWhite);Plot(VPCI,"",colorRed);// and VPCI smoothedaperiod = Param("Smoothing period", 20, 1, 30, 1 );VPCI_SMOOTH = MA( VPCI, aperiod);Plot( VPCI_SMOOTH, "MA("+aperiod+")", colorBlue );VPCI_BUY = VPCI > VPCI_SMOOTH AND ADX(7) > 10 AND MACD( 12, 26 ) > Signal( 12, 26, 9 );VPCI_SELL = VPCI< VPCI_SMOOTH;PlotShapes(IIf(VPCI_BUY,shapeUpArrow,Null),colorGreen,0,Min(0,0),-20); PlotShapes(IIf(VPCI_SELL,shapeDownArrow,Null),colorBrown,0,Min(0,0),-20); //** simple trading system follows*** //Buy = Vp > Vps AND** //ADX( 7 ) > 10 AND** // MACD( 12, 26 ) > Signal( 12, 26, 9 );**// Sell = Vps < Vp;** |
2 comments
Leave Comment
Please login here to leave a comment.
Back
HI
WHAT IS THE ABOVE INDICATOR (CHART POPUPS) CALLED? TX
I have a consideration!
acording to Buff Dormeier the VPCIsmooth should be made with a VWMA.
maybe you should use the “cross” function for the buy and sell instructions.