Stock Portfolio Organizer
The ultimate porfolio management solution.
Shares, Margin, CFD's, Futures and Forex
EOD and Realtime
Dividends and Trust Distributions
And Much More ....
WiseTrader Toolbox
#1 Selling Amibroker Plugin featuring:
Advanced Adaptive Indicators
Advanced Pattern Exploration
Neural Networks
And Much More ....
EMA System Ribbon for Amibroker (AFL)
Rating:
2 / 5 (Votes 4)
Tags:
trading system, amibroker
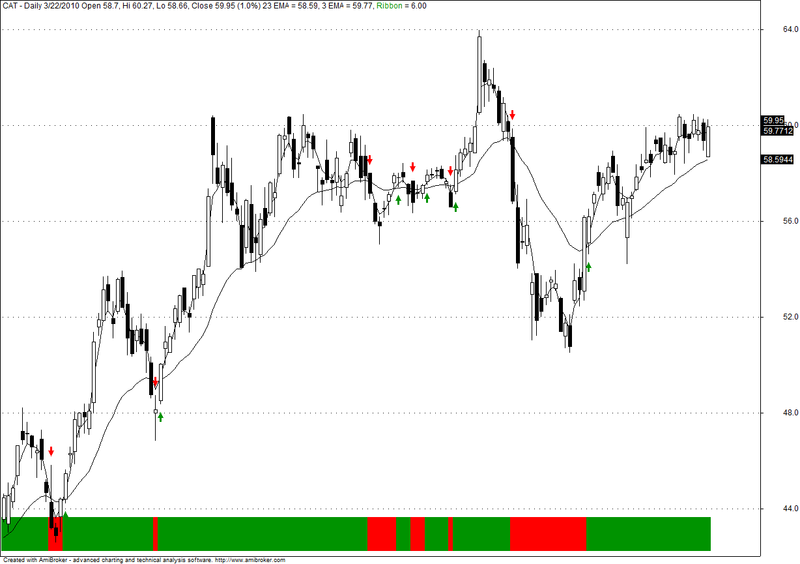
This is a simple program to demonstrate that how to visualize your strategy using Amibroker Ribbon function. The purpose is to visualise how long a buy or sell signal holds.
Steps Involved in Building the code
1)Plot the EMA3/EMA23
2)Buy or Sell Condtion i.e Buy = 3EMA>21EMA and Sell=3EMA<21EMA
3)Plot Arrows on the chart Green Arrow = Buy Signal and Red Arrow = Sell signal
4)Plot the Ribbon. Green Ribbon indicates the length of the Buy signal and Red indicates the sell signal
Now combining everything in one single AFL code
Screenshots
Similar Indicators / Formulas
weighted moving average scan
Submitted
by naninn about 14 years ago
Kase Peak Osc. V2 batu
Submitted
by batu1453 over 10 years ago
Kase CD V2batu
Submitted
by batu1453 over 10 years ago
Ichimoku
Submitted
by prashantrdx almost 11 years ago
Three-Bar Inside Bar Pattern
Submitted
by EliStern about 14 years ago
LANDIS Modified
Submitted
by isfandi about 14 years ago
Indicator / Formula
Copy & Paste Friendly
1 2 3 4 5 6 7 8 9 10 11 12 13 14 15 16 17 18 19 20 21 | _SECTION_BEGIN("Price");SetChartOptions(0,chartShowArrows|chartShowDates);_N(Title = StrFormat("{{NAME}} - {{INTERVAL}} {{DATE}} Open %g, Hi %g, Lo %g, Close %g (%.1f%%) {{VALUES}}", O, H, L, C, SelectedValue( ROC( C, 1 ) ) ));Plot( C, "Close", ParamColor("Color", colorBlack ), styleNoTitle | ParamStyle("Style") | GetPriceStyle() ); /*Buy or Sell Condition*/Buy = Cross(EMA( Close , 3 ),EMA( Close , 23 ));Sell = Cross(EMA( Close , 23 ),EMA( Close , 3 ));/*Pot Buy or Sell Arrows*/PlotShapes(IIf(Sell==1, shapeDownArrow, shapeNone), colorRed, 0,High, Offset=-20);PlotShapes(IIf(Buy==1, shapeUpArrow , shapeNone), colorGreen, 0,Low, Offset=-20);/*Plot EMA*/Plot( EMA( Close,23), "23 EMA",ParamColor("Color", colorRed ),styleNoRescale);Plot( EMA( Close,3), "3 EMA",ParamColor("Color", colorBlue ),styleNoRescale);/*Plot Ribbon */Ribbon1=IIf( EMA( Close , 3 )>EMA( Close , 23 ) ,colorGreen, IIf(EMA( Close , 23 )>EMA( Close , 3 ), colorRed,colorYellow));Plot(6, "Ribbon", Ribbon1, styleOwnScale| styleArea| styleNoLabel,-0.5,100);_SECTION_END(); |
2 comments
Leave Comment
Please login here to leave a comment.
Back
Does not add any value really.
Try for 8-34 EMA FOR MORE GOOD RESULTS