Stock Portfolio Organizer
The ultimate porfolio management solution.
Shares, Margin, CFD's, Futures and Forex
EOD and Realtime
Dividends and Trust Distributions
And Much More ....
WiseTrader Toolbox
#1 Selling Amibroker Plugin featuring:
Advanced Adaptive Indicators
Advanced Pattern Exploration
Neural Networks
And Much More ....
Price Breakout Detection Exploration for Amibroker (AFL)
Rating:
3 / 5 (Votes 31)
Tags:
amibroker, exploration, support, resistance
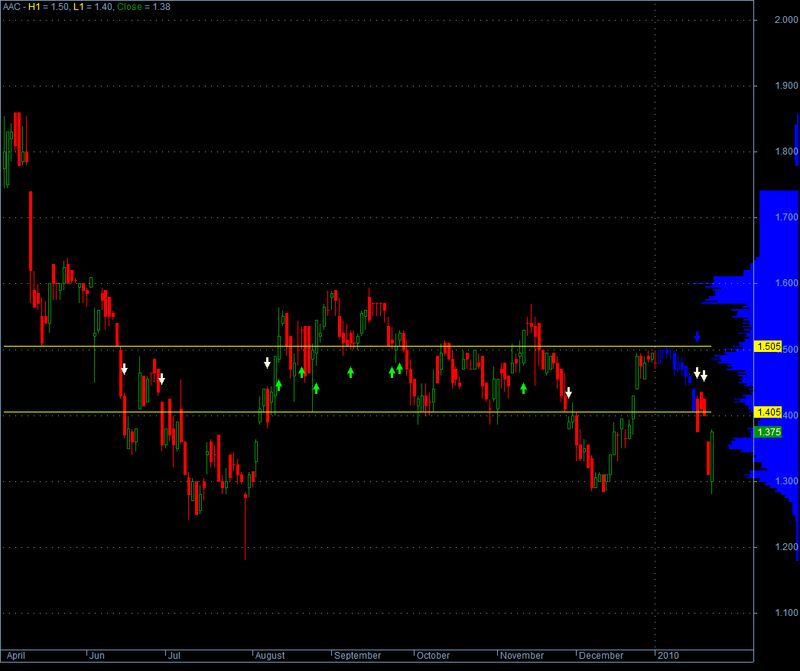
This is a very good formula developed by Rasheed to show horizontal support and resistance lines to detect price breakouts. The formula was then modified by NWTrader to add exploration for breakouts. I also made some minor modifications to the code to make it look better.
Screenshots
Similar Indicators / Formulas
Dynamic Support & Resistance
Submitted
by cnbondre almost 16 years ago
Tom DeMark Trend Lines
Submitted
by kaiji over 16 years ago
S/R type code
Submitted
by empottasch over 13 years ago
Support - Resistance Level
Submitted
by tanujaya over 15 years ago
MIDAS SYSTEM
Submitted
by pras almost 16 years ago
Flower Indicator
Submitted
by niladri over 14 years ago
Indicator / Formula
Copy & Paste Friendly
//  RASHEED'S BREAKOUTS
//  help requested for adding an exploration for End of Day breakouts
/*  coded by NW Trader 1-29-10 with exploration, chart signals and chart options
    toggle parameter to select between C or H & L for the breakout crossings
    toggle parameter added to remove extra trade signals
    Volume at price added
*/

_SECTION_BEGIN("BREAK OUTS");


//  ============== Standard Chart Code ============================
CodeName = "Rasheed's Breakouts";
SetFormulaName("Rasheed's Breakouts");

//   ---------------  Controls for Chart Display  ----------------------------------
SetChartOptions(0, chartShowDates | chartWrapTitle);
if (ParamToggle("Tooltip shows", "All Values|Only Prices"))
{
  ToolTip = StrFormat("Open: %g\nHigh:  %g\nLow:   %g\nClose:  %g (%.1f%%) \nVolume: " + NumToStr(V, 1), O, H, L, C, SelectedValue(ROC(C, 1)));
}

space = Param("Space on Chart", 20,  - 15, 50, 1);
GraphXSpace = space;
SetChartBkColor(ParamColor("Background Color", colorBlack));

// ================= Rasheed's original code (with Lookback and Shift default set to his specs) =================

H0 = H;
L0 = L;
C0 = C;
O0 = O;

Lookback = Param("LookBack", 10, 10, 50, 1); // Default for interday commodity currency trading
shift = Param("Shift", 5, 1, 50, 1); // ?
x0 = LastValue(Cum(1));
x1 = x0 - shift;
H = Ref(H,  - shift + 1);
L = Ref(L,  - shift + 1);
H1 = LastValue(Ref(HHV(H, Lookback),  - 1));
L1 = LastValue(Ref(LLV(L, Lookback),  - 1));

Plot(H1, "H1", colorYellow);
Plot(L1, "L1", colorYellow);

H = H0;
L = L0;
C = C0;
O = O0;

up = Cross(H, H1)AND Cum(1) > x1;
dn = Cross(L1, L)AND Cum(1) > x1;

Plot(C, "Close", IIf(Cum(1) > x1 - Lookback AND Cum(1) <= x1, colorBlue, IIf(Up, colorBrightGreen, IIf(Dn, colorRed, IIf(C > O, colorGreen, colorRed)))), 64);
PlotShapes(shapeDownArrow *(Cum(1) == x1 + 1), colorBlue);

// ======================= Exploration and Signal Code =================
TRIGGER = ParamToggle("Trigger ", "CLOSE|HIGH OR LOW");


XH1 = Cross(C, H1);
XL1 = Cross(L1, C);
XH2 = Cross(H, H1);
XL2 = Cross(L1, L);

if (TRIGGER == 0)
{
  Buy = XH1;
  Sell = XL1;
}

else
{
  Buy = XH2;
  Sell = XL2;
}


TradeDisplay = ParamToggle("Remove Extra Trades?", "No|Yes");

if(TradeDisplay != 0){
	Buy = ExRem(Buy, Sell);
  	Sell = ExRem(Sell, Buy); // THIS WILL REMOVE EXESS SIGNALS ON A CHART OR IN AN EXPLORATION
}

Filter = Buy OR Sell;
Action = WriteIf(Buy, "BUY", WriteIf(Sell, "SELL", "   "));

AddTextColumn(IndustryID(1), "Industry Sector  ", 30.0, colorBlue, colorYellow);
AddColumn(C, "Last ", 2.2, colorWhite, colorBlue);
AddTextColumn(Action, "Action", 8.0, IIf(XH1, colorDarkGreen, colorDarkRed), colorWhite);
AddColumn(IIf(XH1, H1, L1), "BREAKOUT LEVEL", 3.2, colorYellow, IIf(XH1, colorDarkGreen, colorDarkRed));

// -----------------------------------------------------------------------------------  Arrow signals --- FOR TRADES  ----------------------------------------------------------
PlotShapes(Buy *shapeUpArrow, colorBrightGreen, 0, L /* ENTRY_TRAILARRAY */,  - 30);
PlotShapes(Sell *shapeDownArrow, colorLightYellow, 0, H,  - 30);
_SECTION_END();


_SECTION_BEGIN("Volume At Price");
PlotVAPOverlay(Param("Lines", 1000, 100, 1000, 10), Param("Width", 15, 1, 100, 1), ParamColor("Color", colorBlue), ParamToggle("Side", "Left|Right", 1) | 4 *ParamToggle("Z-order", "On top|Behind", 1));

_SECTION_END();
15 comments
Leave Comment
Please login here to leave a comment.
Back
NW Trader is the author of a substantial part of this code (the exploration, backtest and chart display of buy and sell indicators). The original concept of the H1 and L1 levels is Rasheed’s. This code was posted here without prior permission of either author.
Before using this code, you should carefully read the following. Use of the code implies that you have read and accepted the following terms of use:
NW Trader retains a copyright for intellectual property he develops. Under no circumstances may another claim intellectual or exclusive ownership to NW Trader code, modified or unmodified. Use of this code is “as is” without warranty of any kind, either expressed or implied. In no event shall our judicial person be liable for any damages including, but not limited to, direct, indirect, special, incidental or consequential damages or other losses arising out of the use of or inability to use this code.
NW Trader grants a license to any individual to copy to and run this code for their own personal use on their computer. Snapshots of charts produced with this code may be reproduced in message boards. This personal license may not be further assigned, transferred or sub-licensed without the prior written consent of NW Trader. NW Trader reserves the right to change, modify or withdraw this license with no further notice.
Absent the prior written consent of NW Trader, no license is granted for commercial use of the code in any fashion, including (but not limited to) selling the code, the results of running the code, or redistributing the code or its results. This limitation further includes placing this code, modified or unmodified, on any diskette, CD, DVD, website, email, message board, commercial server or any other medium if offered for redistribution or resale.
Peace and Justice
-Patrick, aka NW Traderwonderful and very handy AFL..thanks lot. I like it.
very wonderful AFL thanks and we are waiting for more and more AFL
very good AFL
Nice AFL. I was searching for this type of AFL.
WOW! What an AFL
Thx a Lot.
Brgds
Ravi
very useful AFL
how to use any indicator. Can be explain any for me.
Thanks
Ok i just joined this site..i made an account for downloading the formulas , ive downloaded them but they are not working at all , i can’t figure it out that why Admin of this site wants to give only formulas , Not any Mq4 file or ex4 file…why the hell hes doing it, plus formulas not working at all..
Mq4 and ex4 have nothing to do with Amibroker at all.
All you need is the formula in plain text to be able to paste it into the Amibroker formula editor which you can get via the "Copy & Paste Friendly’ link.
Mantab, goods for explorer.
thanks
Very nice indicator thanks
good one
good day ,admin KAIJI
is this AFL suitable for scanning using weekly
time frame ????
good day ,admin KAIJI
is this AFL suitable for scanning using weekly
time frame ????