Stock Portfolio Organizer
The ultimate porfolio management solution.
Shares, Margin, CFD's, Futures and Forex
EOD and Realtime
Dividends and Trust Distributions
And Much More ....
WiseTrader Toolbox
#1 Selling Amibroker Plugin featuring:
Advanced Adaptive Indicators
Advanced Pattern Exploration
Neural Networks
And Much More ....
QStick from Tushar Chande for Amibroker (AFL)
Rating:
3 / 5 (Votes 3)
Tags:
oscillator, amibroker
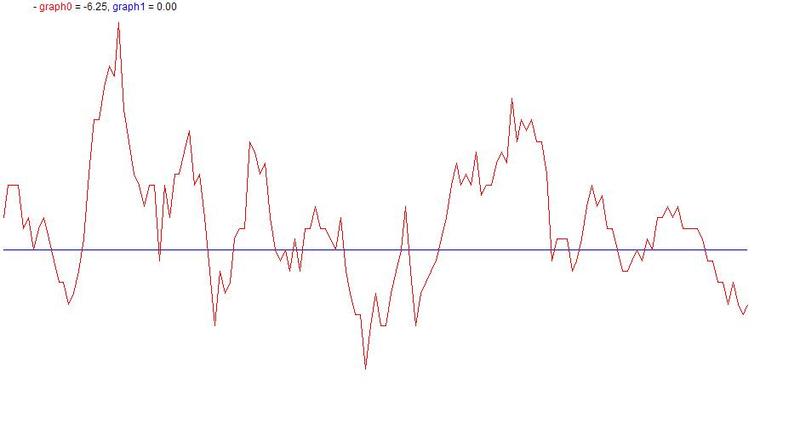
A technical indicator developed by Tushar Chande to numerically identify trends in candlestick charting. It is calculated by taking an ‘n’ period moving average of the difference between the open and closing prices. A Qstick value greater than zero means that the majority of the last ‘n’ days have been up, indicating that buying pressure has been increasing.
Screenshots
Similar Indicators / Formulas
Febo RSI ..real indicator
Submitted
by abhinavsingh over 12 years ago
Trading Volume Statistic
Submitted
by tuanstock1 almost 10 years ago
Ergodic Oscillator
Submitted
by dljtrader over 13 years ago
3 Days Track
Submitted
by janet0211 almost 14 years ago
Chande Momentum Oscillator
Submitted
by klimpek over 13 years ago
BoH Risk Aversion Indicator
Submitted
by genkumag over 12 years ago
Indicator / Formula
Copy & Paste Friendly
/* QStick from Tushar Chande. This indicator measures intraday momentum by
   using the distance between the open and close of price over "n periods".
   It is set at the default ( 8 ) periods that Chande suggest. */

MaxGraph=3;

Graph0=MA( C-O,8);

// The '0' line.
Graph1=0;
Graph1Style=5;
Graph1Style=styleNoLabel;
0 comments
Leave Comment
Please login here to leave a comment.
Back