Stock Portfolio Organizer
The ultimate porfolio management solution.
Shares, Margin, CFD's, Futures and Forex
EOD and Realtime
Dividends and Trust Distributions
And Much More ....
WiseTrader Toolbox
#1 Selling Amibroker Plugin featuring:
Advanced Adaptive Indicators
Advanced Pattern Exploration
Neural Networks
And Much More ....
Price With Regression and Trend for Amibroker (AFL)
Rating:
3 / 5 (Votes 7)
Tags:
trendline, amibroker
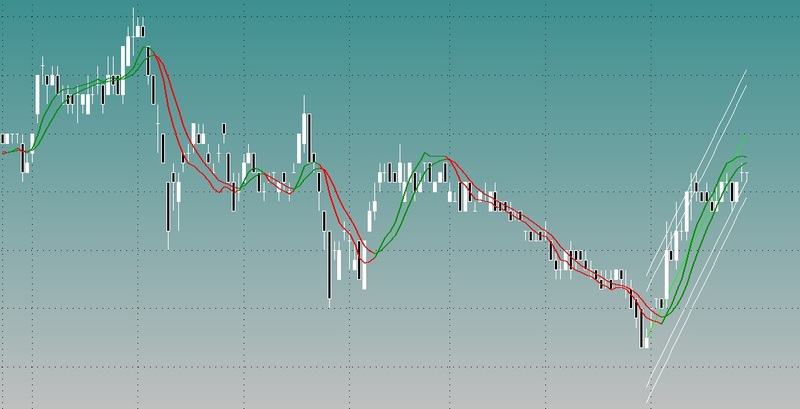
Shows Trendlines of Prices as well as the linear regression of the price.
When Trend is up, trendline is green.
When Trend is down, trendline is red.
Just modify the period of the regression line to what you would like to use.
Screenshots
Similar Indicators / Formulas
Automatic Trend-line
Submitted
by kaiji over 15 years ago
trend price
Submitted
by ashokwins about 12 years ago
Advanced Trend Lines
Submitted
by Arun about 14 years ago
Trendline Multiple TimeFrame
Submitted
by vargasc1 over 13 years ago
Marva Mid R-Line Signal
Submitted
by isfandi over 14 years ago
Indicator / Formula
Copy & Paste Friendly
1 2 3 4 5 6 7 8 9 10 11 12 13 14 15 16 17 18 19 20 21 22 23 24 25 26 27 28 29 30 31 32 33 34 35 36 37 38 39 40 41 42 43 44 45 46 47 48 49 50 51 52 53 54 55 56 57 58 59 60 61 62 63 64 65 66 67 68 69 70 71 72 73 74 75 76 77 78 79 80 81 82 83 84 85 86 87 88 89 90 91 92 93 94 95 96 97 98 99 100 101 102 103 104 105 106 107 108 109 110 111 112 113 114 115 116 | _SECTION_BEGIN("Trend Lines");p1 = Param("TL 1 Periods", 20, 5, 50, 1);p2 = Param("TL 2 Periods", 5, 3, 25, 1);TL1 = LinearReg(C, p1);TL2 = EMA(TL1, p2);Col1 = IIf(TL1 > TL2, ParamColor("TL Up Colour", colorGreen), ParamColor("TL Dn Colour", colorRed));Plot(TL1, "TriggerLine 1", Col1, styleLine|styleThick|styleNoLabel);Plot(TL2, "TriggerLine 2", Col1, styleLine|styleThick|styleNoLabel);_SECTION_END();_SECTION_BEGIN("Linear Regression Channel");//CyberMan's Linear Regression Channel.//Linear Regression Line with 2 Standard Deviation Channels Plotted Above and Below //The original was written by Patrick Hargus, with critical hints from Marcin Gorzynski, Amibroker Technical Support //Wysiwyg coded the angle in degrees part//I modified the original Linear Regression code so that the line will change color based on the degree of the Linear Regression slope.//I combine this with my trading system.//When my system gives an entry signal I look at the Linear Regression Line and I will only take long positions if the Linear Regression line is green and the entry price is below the LR line.//When my system gives an entry signal I look at the Linear Regression Line and I will only take short positions if the Linear Regression line is red and the entry price is above the LR line.//It is usefull for filtering out lower probability trades.//================================================Start Chart Configuration============================================================================SetChartOptions(0,chartShowArrows|chartShowDates);_N(Title = StrFormat("{{NAME}} - {{INTERVAL}} {{DATE}} Open %g, Hi %g, Lo %g, Close %g (%.1f%%) Vol " +WriteVal( V, 1.0 ) +" {{VALUES}}", O, H, L, C, SelectedValue( ROC( C, 1 )) ));SetChartBkGradientFill(ParamColor("Top", colorTeal), ParamColor("Bottom", colorLightGrey), ParamColor("Title", colorTeal));SetChartBkColor(colorTeal);Plot( C, "Close", colorWhite, styleCandle, Zorder = 1);SetChartOptions(0,chartShowArrows | chartShowDates);//================================================End Chart Configuration===============================================================================//====================================Start of Linear Regression Code==================================================================================P = ParamField("Price field",-1);Length = 150;Daysback = Param("Period for Liner Regression Line",Length,1,240,1);shift = Param("Look back period",0,0,240,1);//=============================== Math Formula ========================================================================================================x = Cum(1);lastx = LastValue( x ) - shift;aa = LastValue( Ref(LinRegIntercept( p, Daysback), -shift) );bb = LastValue( Ref(LinRegSlope( p, Daysback ), -shift) );y = Aa + bb * ( x - (Lastx - DaysBack +1 ) );//==================Plot the Linear Regression Line ====================================================================================================LRColor = ParamColor("LR Color", colorCycle ); LRStyle = ParamStyle("LR Style");LRLine = IIf( x > (lastx - Daysback) AND BarIndex() < Lastx, y, Null );LRStyle = ParamStyle("LR Style");Angle = Param("Angle", 0.05, 0, 1.5, 0.01);// A slope higher than 0.05 radians will turn green, less than -0.05 will turn red and anything in between will be white.LRLine = IIf( x > (lastx - Daysback) AND BarIndex() < Lastx, y, Null );Pi = 3.14159265 * atan(1); // PiSlopeAngle = atan(bb)*(180/Pi);LineUp = SlopeAngle > Angle;LineDn = SlopeAngle < - Angle;if(LineUp){Plot(LRLine, "Lin. Reg. Line Up", IIf(LineUp, colorBrightGreen, colorWhite), LRStyle);}else{Plot(LRLine, "Lin. Reg. Line Down", IIf(LineDn, colorDarkRed, colorWhite), LRStyle);} //========================== Plot 1st SD Channel ======================================================================================================SDP = Param("Standard Deviation", 1.5, 0, 6, 0.1);SD = SDP/2;width = LastValue( Ref(SD*StDev(p, Daysback),-shift) ); //Set width of inside chanels here.SDU = IIf( x > (lastx - Daysback) AND BarIndex() < Lastx, y+width , Null ) ;SDL = IIf( x > (lastx - Daysback) AND BarIndex() < Lastx, y-width , Null ) ;SDColor = ParamColor("SD Color", colorCycle );SDStyle = ParamStyle("SD Style");Plot( SDU , "Upper Lin Reg", colorWhite,SDStyle ); //Inside Regression LinesPlot( SDL , "Lower Lin Reg", colorWhite,SDStyle ); //Inside Regression Lines//========================== Plot 2d SD Channel ========================================================================================================SDP2 = Param("2d Standard Deviation", 2.0, 0, 6, 0.1);SD2 = SDP2/2;width2 = LastValue( Ref(SD2*StDev(p, Daysback),-shift) ); //Set width of outside chanels here. SDU2 = IIf( x > (lastx - Daysback) AND BarIndex() < Lastx, y+width2 , Null ) ;SDL2 = IIf( x > (lastx - Daysback) AND BarIndex() < Lastx, y-width2 , Null ) ;SDColor2 = ParamColor("2 SD Color", colorCycle );SDStyle2 = ParamStyle("2 SD Style");Plot( SDU2 , "Upper Lin Reg", colorWhite,SDStyle2 ); //OutSide Regression LinesPlot( SDL2 , "Lower Lin Reg", colorWhite,SDStyle2 ); //OutSide Regression LinesTrend = IIf(LRLine > Ref(LRLine,-1),colorGreen,colorRed);//Changes LR line to green if sloping up and red if sloping down.Plot( LRLine , "LinReg", Trend, LRSTYLE );//============================ End Indicator Code ======================================================================================================== |
5 comments
Leave Comment
Please login here to leave a comment.
Back
Not bad
good one. Helps to cut out the losing trades.
Dear Boknoy9999: Nice code! But how do you combine this code with your existing trading system? Don’t you have problems with the fact that this code looks into the future?
how to generate buy and sell signal
great afl. Thanks for sharing