Stock Portfolio Organizer
The ultimate porfolio management solution.
Shares, Margin, CFD's, Futures and Forex
EOD and Realtime
Dividends and Trust Distributions
And Much More ....
WiseTrader Toolbox
#1 Selling Amibroker Plugin featuring:
Advanced Adaptive Indicators
Advanced Pattern Exploration
Neural Networks
And Much More ....
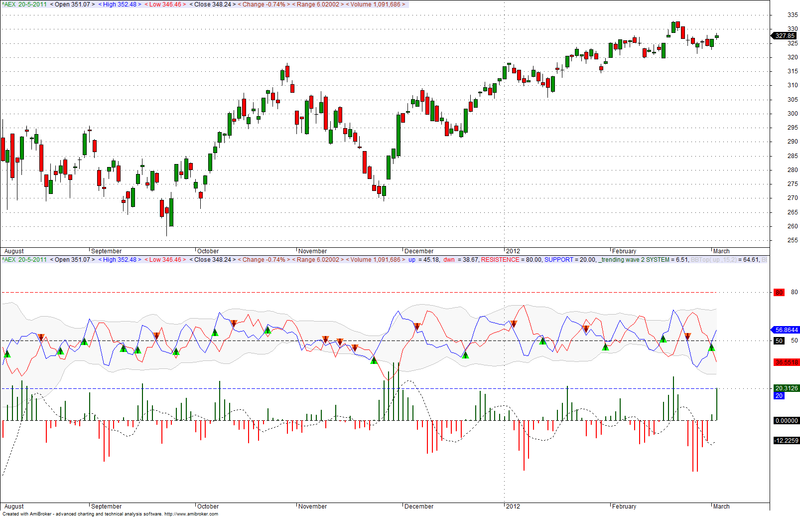
Trending Wave 2 System for Amibroker (AFL)
Rating:
3 / 5 (Votes 4)
Tags:
oscillator, trading system, amibroker
in development.
a system, which turn out profitable quickly without (much) optimization. Defined are only a few basic rules, so there’s potential for more. Suggestions welcome.
backtest settings as I use them.
long& short
only check activate stops immediately
trades tab
buy/sell/short/cover → delay 1
select open
profit taking disabled, go from signal to signal unless stop loss. No trailing stop not implemented yet.
stop loss is executed when triggered
Screenshots
Similar Indicators / Formulas
Rahul Mohindar Oscillator (RMO)
Submitted
by kaiji over 15 years ago
Price Oscillator
Submitted
by ariful_islam almost 15 years ago
Stochastic
Submitted
by expert almost 15 years ago
STOCH RSI CROSSOVER
Submitted
by sonia.b over 13 years ago
CCI ZERO CROSS WITH ALERT
Submitted
by thanigay2k almost 12 years ago
1 hour stoch
Submitted
by siddhisagar almost 15 years ago
Indicator / Formula
Copy & Paste Friendly
1 2 3 4 5 6 7 8 9 10 11 12 13 14 15 16 17 18 19 20 21 22 23 24 25 26 27 28 29 30 31 32 33 34 35 36 37 38 39 40 41 42 43 44 45 46 47 48 49 50 51 52 53 54 55 56 57 58 59 60 61 62 63 64 65 66 67 68 69 70 71 72 73 74 75 76 77 78 79 80 81 82 83 84 85 86 87 88 89 90 91 92 93 94 95 96 97 98 99 100 101 102 103 104 105 106 107 108 109 110 111 112 113 114 115 | _SECTION_BEGIN("_trending wave");SetChartOptions(0, chartShowArrows|chartShowDates, chartGrid20 |chartGrid50 |chartGrid80);_N(Title =EncodeColor(colorGreen)+ StrFormat("{{NAME}} {{DATE}} " + EncodeColor(colorBlack)+" < Open %g > "+ EncodeColor(colorBlue)+ " < High %g > "+ EncodeColor(colorRed)+" < Low %g > "+ EncodeColor(colorBlack) + " < Close %g > " + EncodeColor(colorBrown ) + "< Change" +" %.2f%% > " + "< Range " +(H-L) +" >" +" < Volume " +WriteVal( V, 1.0 ) +" >"+" {{VALUES}} ", O, H, L, C, SelectedValue( ROC( C, 1 )) ));SetChartBkColor(ParamColor("Outer Panel Color ",colorWhite)); // color of outer border SetChartBkGradientFill( ParamColor("Inner Panel Color Upper Half",colorWhite),ParamColor("Inner Panel Color Lower Half",colorWhite)//color of inner panel,ParamColor("Behind Text Color", colorLavender));PositionSize = 1000;SetPositionSize( 1, spsShares ); GraphXSpace=15;Hc=(O+H+L+C)/4;periods = Optimize("periods ",Param("periods ",20,15,20,5),15,30,5);width = Optimize("width ",Param("width ",2,2,2,2),2,2,2);C1 = C - BBandBot( Close, periods, width) ;C2 = BBandTop (Close,periods,width) - BBandBot( Close, periods, width);R = C1 / C2;RS = (AMA( C1, 0.5 ) / AMA( C2, 0.5 )); //smoothuptrend = r > Ref(r,-1);downtrend = r < Ref(r,-1);uptrendS = rs > Ref(rs,-1);downtrendS = rs < Ref(rs,-1);trendu= ((uptrendS +uptrend)/2);trendd=((downtrend +downtrendS)/2);Ho = AMA( Ref( Hc, -1 ), 0.5 );pds = Optimize("pds ",Param("pds ",4,1,25,1),1,25,1);myArrayu = (RSIa((Ho ), pds )+ RSIa( trendu,pds ) + Ref(RSIa(trendu,pds),-1) + Ref(RSIa(trendu,pds),-2) + Ref(RSIa(trendu,pds),-3))/5 ; myArrayd = (RSIa((Ho ), pds )+ RSIa( trendd,pds ) + Ref(RSIa(trendd,pds),-1) + Ref(RSIa(trendd,pds),-2) + Ref(RSIa(trendd,pds),-3))/5 ; //myArrayu1 = (AMA( myArrayu , 0.5 )); //smooth//myArrayd2 = (AMA( myArrayd , 0.5 )); //smoothBS = ParamToggle("smooth","No|Yes",1);BN = ParamToggle("normal","No|Yes",1);if (BS) Plot( myArrayu , " up ", IIf( myArrayu >=Ref(myArrayu ,-1), colorBlue, colorBlue));//if (BS) Plot ( 1, "", IIf( myArrayS >Ref(myArrayS ,-1), colorGreen, IIf( myArrayS < Ref(myArrayS ,-1), colorRed, colorPink )), styleOwnScale|styleArea|styleNoLabel, -0.5, 100 );if (BN) Plot( myArrayd , " dwn ", IIf( myArrayd >=Ref(myArrayd ,-1), colorRed , colorRed ));//if (BN) Plot ( 2, "", IIf( myArray >Ref(myArray ,-1), colorGreen, IIf( myArray < Ref(myArray ,-1), colorRed, colorPink )), styleOwnScale|styleArea|styleNoLabel, -0.5, 100 );Plot(80,"RESISTENCE",colorRed, styleLine|styleDashed | styleThick);Plot(50,"",colorBlack, styleLine|styleDashed | styleThick);Plot(20,"SUPPORT",colorBlue, styleLine|styleDashed | styleThick); _SECTION_END();HistInd=myArrayu - myArrayd ;if (BS AND BN) Plot(HistInd, _DEFAULT_NAME(),IIf(HistInd>=0, ParamColor("Up Color", colorDarkGreen), ParamColor("Down Color", colorRed)),ParamStyle( "Style", styleHistogram | styleThick, maskHistogram ));if (BS AND BN) Plot(0,"",colorBlack, styleLine|styleDashed | styleThick);_SECTION_BEGIN("Average Histogram"); avpds = Optimize("average periods ",Param("average periods",7,1,7,1),1,7,1);average=MA(Histind,avpds);Plot(average,"",colorBlack, styleLine|styleDashed );_SECTION_END();C1L = Histind > average ;// AND average <Ref(average ,-7);C2L = Cross(myArrayu ,myArrayd );C1S= Histind < average ;// AND average >Ref(average ,-7);C2S = Cross(myArrayd ,myArrayu );Buy=C1L AND C2L ;Sell=C2s;Short=C1S AND C2S;Cover=C2l;ExRem(Buy,Sell);ExRem(Short,Cover);PlotShapes( Buy * shapeUpTriangle, colorBrightGreen, 0); PlotShapes( Short * shapeDownTriangle, colorOrange, 0); //PlotShapes( Sell * shapeHollowSmallCircle, colorRed, 0); //PlotShapes( Cover * shapeSmallCircle, colorDarkGreen, 0,myarray,Offset=-25); ApplyStop(stopTypeLoss, stopModePercent, Optimize( "stopTypeLoss", 2.5, 2.5, 2.5, 0.5 ) ,1, True );//ApplyStop(stopTypeProfit , stopModePercent, Optimize( "stopTypeProfit ", 2.0, 2.5, 2.5, 0.1 ) ,2, True );////////////////////////////// HIGHLY IMPORTANT //////////////////////LETOP: ACTIVATESTOPS MOET AANSTAAN IN SETTINGSe = Equity(1,0); /* Highly Important!!. "Removes all extra signals, evaluates stops AND writes BACK signals to Sell/Cover arrays". As it should be!!*/Lprofit = e - ValueWhen( Buy, e); Sprofit = e - ValueWhen( Short, e); PlotShapes( Buy* shapeUpArrow , colorDarkGreen, 0); PlotShapes( Short* shapeDownArrow , colorDarkRed, 0);////////////////////////////////////////////////////////////////////////////////_SECTION_BEGIN("Bollinger Bands");P = ParamField("Price field",-1);Periods = Param("Periods", 15, 2, 100, 1 );Width = Param("Width", 2, 0, 10, 0.05 );Color = ParamColor("Color", colorLightGrey );Style = ParamStyle("Style", styleLine | styleNoLabel ) | styleNoLabel;Plot( bbt = BBandTop( P, Periods, Width ), "BBTop" + _PARAM_VALUES(), Color, Style ); Plot( bbb = BBandBot( P, Periods, Width ), "BBBot" + _PARAM_VALUES(), Color, Style ); PlotOHLC( bbt, bbt, bbb, bbb, "", ColorBlend( Color, colorWhite, 0.9 ), styleNoLabel | styleCloud | styleNoRescale, Null, Null, Null, -1 );_SECTION_END(); |
2 comments
Leave Comment
Please login here to leave a comment.
Back
error in line 144
szgolyas, use latest amibroker version