Stock Portfolio Organizer
The ultimate porfolio management solution.
Shares, Margin, CFD's, Futures and Forex
EOD and Realtime
Dividends and Trust Distributions
And Much More ....
WiseTrader Toolbox
#1 Selling Amibroker Plugin featuring:
Advanced Adaptive Indicators
Advanced Pattern Exploration
Neural Networks
And Much More ....
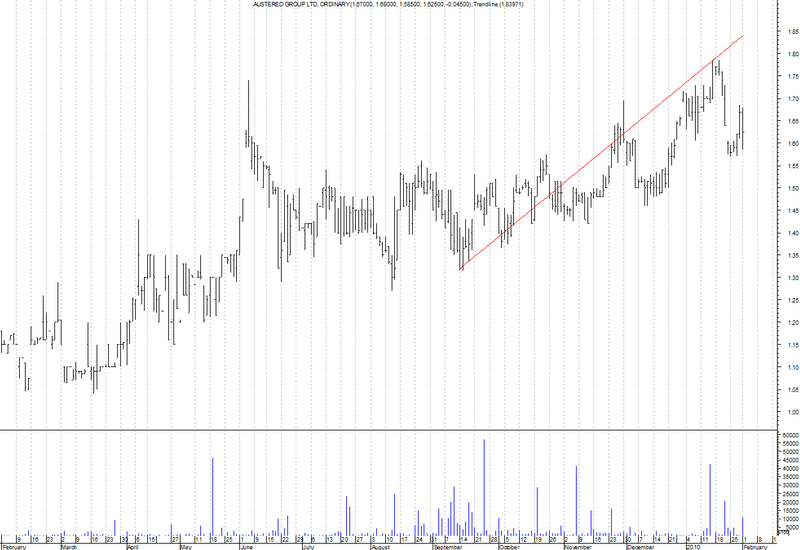
Trendline - adjustable for Metastock
Rating:
5 / 5 (Votes 1)
Tags:
Automatically draws trend-lines on a chart.
By Jose Silva at metastocktools.com
Screenshots
Indicator / Formula
Copy & Paste Friendly
{ ©Copyright 2003 Jose Silva }
{ http://www.metastocktools.com }

pds:=
 Input("average trend length periods",2,252,21);
pr:=Input("Open=1 High=2 Low=3 Close=4 Vol=5 MP=6, P=7",1,7,4);
display:=Input("plot Trend line = 1, Trend points = 2",1,2,1);

{define events}
pr:=If(pr=1,O,If(pr=2,H,If(pr=3,L,If(pr=5,V,
If(pr=6,MP(),If(pr=7,P,C))))));
price1:=pr;
price2:=pr;
time1:=price1>Ref(HHV(price1,pds),-1);
time2:=price2<Ref(LLV(price2,pds),-1);

{restrict to last events}
time1:=time1
 AND Cum(time1)=LastValue(Cum(time1));
time2:=time2
 AND Cum(time2)=LastValue(Cum(time2));

{sort events}
t1pds:=LastValue(BarsSince(time1));
t2pds:=LastValue(BarsSince(time2));
x1:=If(t1pds>=t2pds,time1,time2);
x2:=If(t1pds>=t2pds,time2,time1);
y1:=If(t1pds>=t2pds,price1,price2);
y2:=If(t1pds>=t2pds,price2,price1);

{fix coordinates}
y1:=ValueWhen(1,x1,y1);
y2:=LastValue(ValueWhen(1,x2,y2));
b1:=LastValue(BarsSince(x1));
b2:=LastValue(BarsSince(x2));
plot:=y1+BarsSince(x1)*(y2-y1)/(b1-b2);

If(display=1,plot,time1+time2)
0 comments
Leave Comment
Please login here to leave a comment.
Back