Stock Portfolio Organizer
The ultimate porfolio management solution.
Shares, Margin, CFD's, Futures and Forex
EOD and Realtime
Dividends and Trust Distributions
And Much More ....
WiseTrader Toolbox
#1 Selling Amibroker Plugin featuring:
Advanced Adaptive Indicators
Advanced Pattern Exploration
Neural Networks
And Much More ....
Multiple Trend for Amibroker (AFL)
Rating:
3 / 5 (Votes 4)
Tags:
trading system, amibroker, timeframe
I got this code from Bulli Castelo’s forum, but it was a mess!
I don’t know the author, but he could not implement what he/she wanted.
I think the Idea is good so I tried to fix the code and I think I got it working as intended.
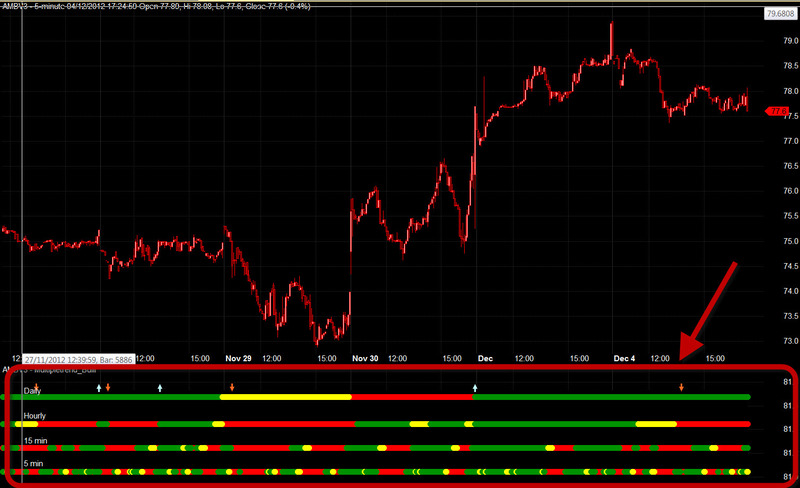
The code shows the cross of a EMA and a AMA on various timeframes indicating gold cross (green),
dead cross (red) and change of direction (yellow) on one of them.
You have to use 5 min or less on the chart for it to display the crosses on 5, 15, 60 and daily.
It guives buy and sell signals acording to the sync of the timeframes.
Enjoy,
Eduardo
Screenshots
Similar Indicators / Formulas
Positional Tread
Submitted
by Divyesh almost 13 years ago
5 day high low system
Submitted
by anandmoorti over 12 years ago
Intraday / Positional Signals
Submitted
by Divyesh almost 13 years ago
Three-Bar Inside Bar Pattern
Submitted
by EliStern over 14 years ago
EMA System Ribbon
Submitted
by yo123 over 14 years ago
Indicator / Formula
Copy & Paste Friendly
1 2 3 4 5 6 7 8 9 10 11 12 13 14 15 16 17 18 19 20 21 22 23 24 25 26 27 28 29 30 31 32 33 34 35 36 37 38 39 40 41 42 43 44 45 46 47 48 49 50 51 52 53 54 55 56 57 58 59 60 61 62 63 64 65 66 67 68 69 70 71 72 73 74 75 76 77 | _SECTION_BEGIN("Multiple Trend");// Define label bar (x) position location#pragma nocacheblankRightBars = 0; //insert actual blank right bars specified in PreferencesbarsInView = Status("lastvisiblebarindex") - Status("firstvisiblebarindex") - blankRightBars;Offset = Param("Offset Bar", 0.95, 0, 1, 0.01);textOffset = BarCount - (Offset * barsInView);TimeFrameSet( in5Minute) ;HaClose5 = EMA((O+H+L+C)/4,3);HaOpen5 = AMA( Ref( HaClose5, -1 ), 0.5 );X5 = HaClose5 < Ref( HaClose5,-1) OR AlmostEqual( Haopen5 , Ref(Haopen5,-1) );Color5m = IIf( HaOpen5 > HaClose5, colorRed, IIf( X5,colorYellow, colorGreen));event1 = Haopen5 >= Haclose5;event2 = Haopen5 < Haclose5;TimeFrameRestore();TimeFrameSet( in15Minute) ;HaClose15 =EMA((O+H+L+C)/4,3);HaOpen15 = AMA( Ref( HaClose15, -1 ), 0.5 );X15 = HaClose15 < Ref( HaClose15,-1) OR AlmostEqual( HaOpen15,Ref(HaOpen15,-1));Color15m = IIf( Haopen15 > Haclose15, colorRed, IIf( X15,colorYellow, colorGreen));event3= Haopen15 >= Haclose15;event4= Haopen15 < Haclose15;TimeFrameRestore();TimeFrameSet( inHourly) ;HaCloseH =EMA((O+H+L+C)/4,3);HaOpenH = AMA( Ref( HaCloseH, -1 ), 0.5 );XH = HaCloseH < Ref( HaCloseH,-1) OR AlmostEqual( HaopenH,Ref(HaopenH,-1));ColorHr = IIf( HaopenH > HacloseH, colorRed, IIf( XH,colorYellow, colorGreen));event5 = HaopenH >= HacloseH;event6 = HaopenH < HacloseH;TimeFrameRestore();TimeFrameSet(inDaily) ;HaCloseD = EMA((O+H+L+C)/4,3);HaOpenD = AMA( Ref( HaCloseD, -1 ), 0.5 );XD = HaCloseD <= Ref( HaCloseD,-1) OR AlmostEqual( HaopenD, Ref(HaopenD,-1));Color20D = IIf( HaOpenD > HacloseD, colorRed, IIf( XD , colorYellow, colorGreen));event7 = HaopenD >= HacloseD;event8 = HaopenD < HacloseD;TimeFrameRestore();PlotShapes( IIf(TimeFrameExpand( event1 , in5Minute ), shapeCircle,shapeNone) ,TimeFrameExpand( Color5m , in5Minute ), 0,81.10);PlotShapes( IIf(TimeFrameExpand( event2 , in5Minute ), shapeCircle,shapeNone) , TimeFrameExpand( Color5m , in5Minute ), 0,81.10);PlotShapes( IIf(TimeFrameExpand( event3 , in15Minute ), shapeCircle,shapeNone) ,TimeFrameExpand( Color15m , in15Minute ), 0,81.30);PlotShapes( IIf(TimeFrameExpand( event4 , in15Minute ), shapeCircle,shapeNone) ,TimeFrameExpand( Color15m , in15Minute ), 0,81.30);PlotShapes( IIf(TimeFrameExpand( event5 , inHourly ), shapeCircle,shapeNone) ,TimeFrameExpand( ColorHr , inHourly ), 0,81.50);PlotShapes( IIf(TimeFrameExpand( event6 , inHourly ), shapeCircle,shapeNone) ,TimeFrameExpand( ColorHr , inHourly ), 0,81.50);PlotShapes( IIf(TimeFrameExpand( event7 , inDaily ), shapeCircle,shapeNone) ,TimeFrameExpand( Color20D , inDaily ), 0,81.73);PlotShapes( IIf(TimeFrameExpand( event8 , inDaily ), shapeCircle,shapeNone) , TimeFrameExpand( Color20D , inDaily ), 0,81.73);Plot( 21,"",colorBlack,styleOwnScale|styleArea|styleNoLabel,0, 100 );PlotText("5 min", textoffset, 81.09, colorWhite);Plot( 41,"",colorBlack,styleOwnScale|styleArea|styleNoLabel,0, 100 );PlotText("15 min", textoffset, 81.28, colorWhite);Plot( 61,"",colorBlack,styleOwnScale|styleArea|styleNoLabel,0, 100 );PlotText("Hourly", textoffset, 81.49, colorWhite);Plot( 81,"",colorBlack,styleOwnScale|styleArea|styleNoLabel,0, 100 );PlotText("Daily", textoffset, 81.70, colorWhite);Sell = TimeFrameExpand( event1 , in5Minute ) AND TimeFrameExpand( event3 , in15Minute ) AND TimeFrameExpand( event5 , inHourly )/* AND TimeFrameExpand( event7 , inDaily )*/ ;Buy = TimeFrameExpand( event2 , in5Minute ) AND TimeFrameExpand( event4 , in15Minute ) AND TimeFrameExpand( event6 , inHourly ) AND TimeFrameExpand( event8 , inDaily ) ;Buy=ExRem (Buy,Sell);Sell=ExRem(Sell,Buy);PlotShapes( IIf(Buy, shapeUpArrow,shapeNone) , colorSkyblue, 0,81.8);PlotShapes( IIf(Sell, shapeDownArrow,shapeNone) , colorOrange, 0,81.8,10);GraphXSpace = 10;_SECTION_END(); |
2 comments
Leave Comment
Please login here to leave a comment.
Back
good work
good work done. can you help me to get a 4 hourly time frame in this. this would be highly appreciated . thanx