Stock Portfolio Organizer
The ultimate porfolio management solution.
WiseTrader Toolbox
#1 Selling Amibroker Plugin featuring:
Fibonacci High-Probability Zones for Amibroker (AFL)
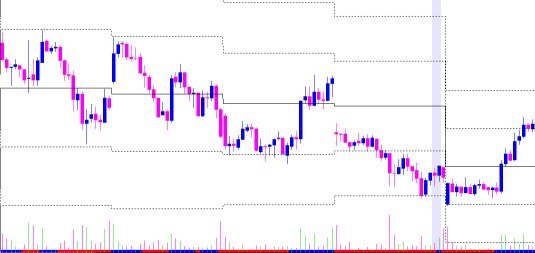
Typically used for day trading based on previous day trading range but this will be adjusted automatically according to the chart interval (If you need to finetune them, jump in and change the ‘Periodicity’ to your heart’s content). For longer trading timeframes, Weekly, monthly or yearly price range may be optimally selected for you. The indicator plots high-probability Fibonacci zones which are the regions most likely to see a reversal during the current trading day. Look for a bounce off one of the levels while the Stochastics is turning up from the oversold area on the 15-min chart (the reverse for a short trade).
The center black line is the daily pivot point.
Screenshots
Similar Indicators / Formulas
Indicator / Formula
_SECTION_BEGIN("FIBONACCI HIGH PROBABILITY ZONES");

ShowFibHiProbZone=ParamToggle("Show FIb High-Probability Zone","No|Yes",1);
HpzColor = ParamColor("Line Color",colorBlack);
Periodicity = inDaily;

if(ShowFibHiProbZone AND Interval()<inHourly)
{
Periodicity = inDaily;
}
else if(ShowFibHiProbZone AND Interval()==inHourly)
{
Periodicity = inWeekly;
}
else if (ShowFibHiProbZone AND Interval()>=inDaily AND Interval()<inMonthly)
{
Periodicity = inMonthly;
}
else if(ShowFibHiProbZone AND Interval()>inWeekly AND Interval()<inYearly)
{
Periodicity = inYearly;
}
else // Default just to silence the compiler. This will never occur.
{
Hi=Ref(H,-1);
Lo=Ref(L,-1);
Cl=Ref(C,-1);
}

Hi=TimeFrameGetPrice("H",Periodicity,-1);
Lo=TimeFrameGetPrice("L",Periodicity ,-1);
Cl=TimeFrameGetPrice("C",Periodicity ,-1);


p=(Hi+Lo+Cl)/3;
r1=p+((Hi-Lo)/2);
s1=p-((Hi-Lo)/2);
r2=p+(Hi-Lo);
s2=p-(Hi-Lo);

//Bands
s1b=((Hi-Lo)*0.618)-p;
s2b=((Hi-Lo)*1.382)-p;

r1b=((Hi-Lo)*0.618)+p;
r2b=((Hi-Lo)*1.382)+p;

extnd=0;
sty=styleNoLabel|styleStaircase|styleDashed|styleNoRescale;
Plot(r1-extnd,"",HpzColor ,sty,Null,Null,extnd,1000);
//PlotOHLC(r1,r1,r1b,r1b,"",Col,sty|styleClipMinMax|styleCloud|styleNoLine,Null,Null,extnd,1000);

Plot(s1-extnd,"",HpzColor ,sty,Null,Null,extnd,1000);
//PlotOHLC(s1,s1b,s1,s1b,"",Col,sty|styleClipMinMax|styleCloud|styleNoLine,Null,Null,extnd,1000);
Plot(p-extnd,"",HpzColor ,styleNoLabel|styleStaircase|styleNoRescale,Null,Null,extnd,1000);
Plot(r2-extnd,"",HpzColor ,sty,Null,Null,extnd,1000);
Plot(s2-extnd,"",HpzColor ,sty,Null,Null,extnd,1000);

//Daily Range Hi Lo
//Plot(Hi-extnd,"",ColorBlend(colorLime,colorBrightGreen) ,styleNoLabel|styleStaircase|styleNoRescale,Null,Null,extnd,1000);
//Plot(Lo-extnd,"",ColorBlend(colorCustom12,colorRed) ,styleNoLabel|styleStaircase|styleNoRescale,Null,Null,extnd,1000);

_SECTION_END();
8 comments
Leave Comment
Please login here to leave a comment.
Back
Hey Jay,
I tried using this AFl. My chart screen is complete blank. I cant see any chart
Hellow,
Add price chart, you will get whole picture.
I appreciate Jay for this wonder code.
I need to study this.
Is this code can be used for daily/weekly charts?
if so any adjustments required?
Jay,Kindly post some tips on using this
My ratings 5 ( my initial impression)
Thanks
viswanath
Hellow Jay,
Please guide me where i can change in parametsr for daily time frame. i can not see it in parameters.
“This will be adjusted automatically according to the chart interval (If you need to finetune them, jump in and change the ‘Periodicity’ to your heart’s content)”
Thanks
viswanath
@Natiraj, you have to drop this indicator on an existing chart.
@kv_maligi, if you study the code, you’ll discover that the levels are automatically adjusted according to the current chart time frame.
- If the current chart timeframe is less than an hour, Daily HP lines are drawn.
- If you’re looking at a Daily chart, the monthly HP lines are drawn and so on.
These levels are chosen after a long time of using these levels and they work out best. But you are free to jump in and change it as you desire.
Cheers and happy trading.
Jay, many thanks for prompt reply.
Any reason why weekly HP lines not taken for daily chart (Reference “If you’re looking at a Daily chart, the monthly HP lines are drawn”).
If possible, can you change the code for weekly HP lines & post here.
I will study both & update my comments
viswanath
Jay,
I have tested this ( & also compared with my changes as i requested).
This is indeed great code, helps traders. Once again thanks for sharing
viswanath
good afl .But i think ordinary pivots work well in intraday trading . Fibonacci ret and ext. of last minor and major swing are the best levels according to my experience . I have not posted it here as chart looks too much crowded by so many levels .So i draw manually always .
I get black screen no chart.