Stock Portfolio Organizer
The ultimate porfolio management solution.
Shares, Margin, CFD's, Futures and Forex
EOD and Realtime
Dividends and Trust Distributions
And Much More ....
WiseTrader Toolbox
#1 Selling Amibroker Plugin featuring:
Advanced Adaptive Indicators
Advanced Pattern Exploration
Neural Networks
And Much More ....
TSL&ATR&EMA&TGL for Amibroker (AFL)
Rating:
5 / 5 (Votes 1)
Tags:
amibroker, stop loss
Another Trailing Stop Loss (TSL) from Web.
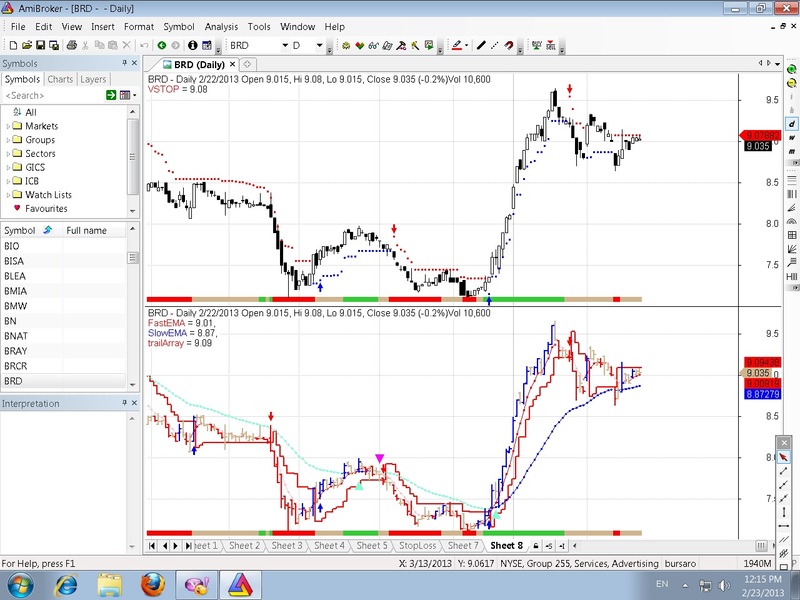
Screenshots
Similar Indicators / Formulas
DODA BAND BUY SELL
Submitted
by saas over 11 years ago
JMA Stoploss
Submitted
by kuzukapama over 13 years ago
TSL & HL & New
Submitted
by morgen almost 13 years ago
Stop Loss Indicator
Submitted
by nabcha almost 15 years ago
ABKP Benchmark Bar
Submitted
by amitabh almost 15 years ago
Indicator / Formula
Copy & Paste Friendly
1 2 3 4 5 6 7 8 9 10 11 12 13 14 15 16 17 18 19 20 21 22 23 24 25 26 27 28 29 30 31 32 33 34 35 36 37 38 39 40 41 42 43 44 45 46 47 48 49 50 51 52 53 54 55 56 57 58 59 60 61 62 63 64 65 66 67 68 69 70 71 72 73 74 75 76 77 78 79 80 81 82 83 84 85 86 87 88 89 90 91 92 93 94 95 96 97 98 99 100 101 102 103 104 105 106 107 108 109 110 111 112 113 114 115 116 117 118 119 120 121 122 123 124 125 126 127 128 129 130 131 132 133 134 135 136 137 138 139 140 141 142 143 144 145 146 147 148 149 150 151 152 153 154 155 156 157 158 159 160 161 162 163 164 165 166 167 | //HEIKIN-ASHI ORIGINAL//SetChartOptions(0,chartShowArrows | chartShowDates);HaClose = (O + H + L + C)/4; HaOpen = AMA( Ref( HaClose, -1 ), 0.5 ); HaHigh = Max( H, Max( HaClose, HaOpen ) ); HaLow = Min( L, Min( HaClose, HaOpen ) ); xDiff = (HaHigh - Halow) * 10000;//barcolor = IIf(HaClose >= HaOpen,colorGreen,colorRed);//barcolor= IIf(HaClose>=HaOpen AND C>Ref(C,-1) AND C>=O,colorGreen,// IIf(HaClose<HaOpen AND C<Ref(C,-1) AND C<O, colorRed, colorBrown)) ;//SetBarFillColor(IIf(HaClose>=HaOpen,colorBrightGreen,colorOrange));//SetBarFillColor(IIf(HaClose>=HaOpen AND C>Ref(C,-1) AND C>=O,colorBrightGreen,// IIf(HaClose<HaOpen AND C<Ref(C,-1) AND C<O, colorOrange, colorTan)) );//PlotOHLC( HaOpen, HaHigh, HaLow, HaClose, "\nHeikin-ashi", barcolor, styleCandle );//PlotOHLC( HaOpen, HaHigh, HaLow, HaClose, "\nHeikin-ashi", colorBlack, styleCandle );//HaDelta & MAHaDelta= HaClose-HaOpen ;MAhadelta= MA(Hadelta,3) ;Hadeltaup3= Hadelta>MA(Hadelta,3) ;Hadeltaup33 = Hadelta>MA(MA(Hadelta,3),3) ;//Plot(Hadelta,"haDelta",colorBlack) ;//Plot(0,"",colorBrown) ;//Plot( MA1, "MA1", colorRed );//Plot( MA2, "MA2", colorBlue );Haup= HaClose>=HaOpen ;//xxxxxxxxxxxxxxxxxxxxxxxxxxxxxxxxxxxxxxxxxxxxxxxxxxxxxxxxxxxxxxxxxxxxxxxxxxxxxxxxxxxxxxxxxxxxxxxxxx//TRENDING RIBBON// Paste the code below to your price chart somewhere and green ribbon means both// both MACD and ADX trending up so if the red ribbon shows up the MACD and the ADX // are both trending down._SECTION_BEGIN("trending ribbon");uptrend= (PDI()>MDI() AND MACD()>Signal()) ;downtrend=MDI()>PDI() AND Signal()>MACD();Plot( 2, /* defines the height of the ribbon in percent of pane width */"", IIf(uptrend,colorLime,IIf(downtrend,colorRed,colorTan)),styleOwnScale|styleArea|styleNoLabel,-0.5,100 );_SECTION_END();//xxxxxxxxxxxxxxxxxxxxxxxxxxxxxxxxxxxxxxxxxxxxxxxxxxxxxxxxxxxxxxxxxxxxxxxxxxxxxxxxxxxxxxxxxxxxxxxxxxxxxxxxxxxx//MODEL PENTRU 3 CULORI , ADICA 3 CONDITII//bar3culori= IIf(C> NLBL, colorBlue, IIf(C<NLSL, colorRed, colorTan));//MODEL MODEL MODEL 3 CULORI//SetBarFillColor(IIf(HaClose>=HaOpen,colorBrightGreen,colorOrange));//bar3culori= IIf(C> NLBL, colorBlue, IIf(C<NLSL, colorRed, colorTan));//MODEL MODEL MODEL 3 CULORI//SetBarFillColor(IIf(HaClose>=HaOpen AND C>Ref(C,-1),colorBrightGreen,// IIf(HaClose<HaOpen AND C<Ref(C,-1), colorRed, colorTan)) );//SetBarFillColor= IIf(C> NLBL, colorBlue, IIf(C<NLSL, colorRed, colorTan));//MODEL MODEL MODEL 3 CULORI//xxxxxxxxxxxxxxxxxxxxxxxxxxxxxxxxxxxxxxxxxxxxxxxxxxxxxxxxxxxxxxxxxxxxxxxxxxxxxxxxxxxxxxxxxxxxxxxxxxxxxxxxxxxxx//PRICE_SECTION_BEGIN("Price");//SetChartOptions(0,chartShowArrows|chartShowDates);_N(Title = StrFormat("{{NAME}} - {{INTERVAL}} {{DATE}} Open %g, Hi %g, Lo %g, Close %g (%.1f%%)Vol " + WriteVal( V, 1.0 ) + " {{VALUES}}", O, H, L, C, SelectedValue( ROC( C, 1 )) ));barcolor= IIf(C>O AND C>Ref(C,-1) AND HaClose>=HaOpen,colorBlue, IIf(C<O AND C<Ref(C,-1) AND HaClose<HaOpen,colorRed,colorTan)) ;//Plot( C, "", ParamColor("Color", colorBlack ), styleNoTitle | ParamStyle("Style") | GetPriceStyle() ); Plot( C, "", barcolor,styleBar+styleThick ); _SECTION_END();//xxxxxxxxxxxxxxxxxxxxxxxxxxxxxxxxxxxxxxxxxxxxxxxxxxxxxxxxxxxxxxxxxxxxxxxxxxxxxxxxxxxxxxxxxxxxxxxxxxxxxxxxxxxxxxxx// TRAILING STOP LOSS & ATR & EMA/*This formula plots two exponential moving averages along withan auto-switching exponential ATR trailing stop.*/per = Param("per",10,2,50,1,0);mult = Param("mult",2,1,10,0.1,0);tr = Ref(EMA(ATR(1),per),0)*mult;mov = Param("FastEMA",5,1,100,1,0);mov2 = Param("SlowEMA",34,10,200,1,0);trailArray[ 0 ] = C[ 0 ]; // initializefor( i = 1; i < BarCount; i++ ){prev = trailArray[ i - 1 ];if (C[ i ] > prev AND C[ i - 1 ] > prev){trailArray[ i ] = Max(prev,C[ i ] - tr[ i ]);}else if (C[ i ] < prev AND C[ i - 1 ] < prev){trailArray[ i ] = Min(prev,C[ i ] + tr[ i ]);}else if (C[ i ] > prev){trailArray[ i ] = C[ i ] - tr[ i ];}else{trailArray[ i ] = C[ i ] + tr[ i ];}}trailArray = Ref(trailArray,-1);//GraphXSpace = 5;//SetChartOptions(0, chartShowDates);//Plot(EMA(Close,mov),"\nFastEMA",colorRed,styleLine);MAupcol=IIf(EMA(Close,mov)>Ref(EMA(Close,mov),-1),colorRed,colorPink) ;Plot(EMA(Close,mov),"\nFastEMA",MAupcol,styleDots);//Plot(EMA(Close,mov2),"\nSlowEMA",colorBlue,styleLine);MA2upcol=IIf(EMA(Close,mov2)>Ref(EMA(Close,mov2),-1),colorBlue,colorAqua) ;Plot(EMA(Close,mov2),"\nSlowEMA",MA2upcol,styleDots);Plot(trailArray,"\ntrailArray",colorRed,styleStaircase+styleThick);//Plot( C, "\nCandle",colorBlack, styleCandle );//xxxxxxxxxxxxxxxxxxxxxxxxxxxxxxxxxxxxxxxxxxxxxxxxxxxxxxxxxxxxxxxxxxxxxxxxxxxxxxxxxxxxxxxxxxxxxxxxxxxxxxxxxxx//FORMULEstochup= StochK()>StochD() ;stoch80= StochK()<80 ;MACDup= MACD()>Signal() ;Hist= MACD()-Signal() ;Histup= Hist>Ref(Hist,-1) ;MFIupema5= MFI()>EMA(MFI(),5) ;MFI30= MFI()>30 ;Cupo= C>O ;MA10up= MA(C,10)>=Ref(MA(C,10),-1) ;MA20up= MA(C,20)>=Ref(MA(C,20),-1) ;EMA50up= EMA(C,50)>=Ref(EMA(C,50),-1) ;CupEMA50= C>EMA(C,50) ;Cupma20= C>MA(C,20) ;PDIupmdi= PDI()>MDI() ;CCIup0= CCI()>0 ;top2up= BBandTop(C,20,2)>=Ref(BBandTop(C,20,2),-1) ;top1up= BBandTop(C,20,1)>=Ref(BBandTop(C,20,1),-1) ;Cuptop1= C>BBandTop(C,20,1) ;mybuy= C>trailArray ;PlotShapes(IIf(Cross(EMA(Close,mov),EMA(Close,mov2)),shapeUpTriangle,shapeNone),colorAqua,0,Low,Offset=-25) ;PlotShapes(IIf(Cross(EMA(Close,mov2),EMA(Close,mov)),shapeDownTriangle,shapeNone),colorCustom12,0,High,Offset=-25) ;//xxxxxxxxxxxxxxxxxxxxxxxxxxxxxxxxxxxxxxxxxxxxxxxxxxxxxxxxxxxxxxxxxxxxxxxxxxxxxxxxxxxxxxxxxxxxxxxxxxxxxxx//PARAMTOGGLE// This combines indicators into one timing Signal//function ParamOptimize( description, default, minv, maxv, step )// { return Optimize(description, Param(description,default, minv, maxv, step ), minv, maxv, step ); }tgl = ParamToggle("Result", "AND logic|Compare");// switch test calculation and compare the resultsif(tgl){myBuy = mybuy AND macdup AND histup AND cupo AND haup ;myShort = !mybuy ; }else{myBuy = IIf( C>trailArray AND MACD()>Signal() AND Hist>Ref(Hist,-1) AND C>O AND HaClose>=HaOpen ,1,0);myShort = IIf( C<trailArray ,1,0);}Buy = ExRem(myBuy, myShort);Sell = ExRem(myShort, myBuy);PlotShapes(IIf(Buy,shapeUpArrow,shapeNone),colorBlue,0,Low,Offset=-15);PlotShapes(IIf(Sell,shapeDownArrow,shapeNone),colorRed,0,High,Offset=-15); |
1 comments
Leave Comment
Please login here to leave a comment.
Back
Foarte bun. Bravo!