Stock Portfolio Organizer
The ultimate porfolio management solution.
Shares, Margin, CFD's, Futures and Forex
EOD and Realtime
Dividends and Trust Distributions
And Much More ....
WiseTrader Toolbox
#1 Selling Amibroker Plugin featuring:
Advanced Adaptive Indicators
Advanced Pattern Exploration
Neural Networks
And Much More ....
TREND CHART for Amibroker (AFL)
Rating:
2 / 5 (Votes 5)
Tags:
amibroker
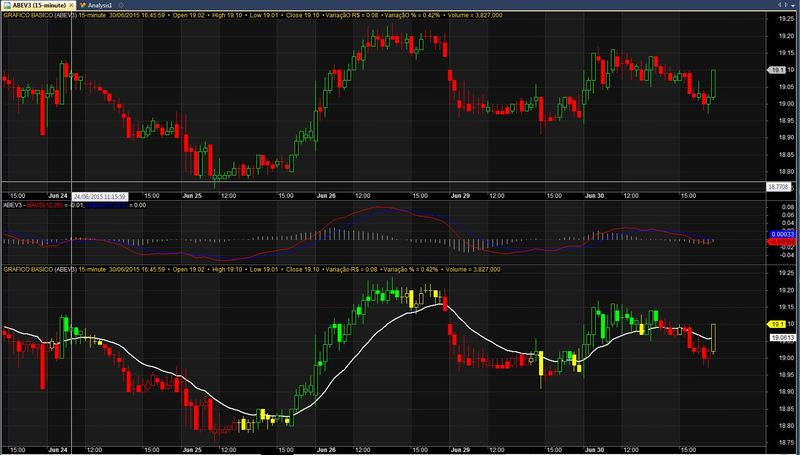
This AFL identifies trend with exponential moving average(EMA) and MACD . If candle for :
Red = downtrend
Green = uptrend
yellow = caution, without TREND
This AFL identifies trend with exponential moving average and MACD .
If candle for : Red = downtrend
Green = uptrend
Yellow = caution, without TREND .
This is a simple example to identify trend and just follow the colors GREEN , RED OR YELLOW . The graph is cleaner . The AFL is only an indicator and not a Trading System .
Screenshots
Indicator / Formula
Copy & Paste Friendly
//Candles or bars colored by trend
//identifying trends with EMA and MACD

cond1 = Close > EMA(C, 17) AND MACD() > Signal();
cond2 = Close > EMA(C, 17) AND MACD() < Signal() OR Close < EMA(C, 17) AND MACD() > Signal();
cond3 = Close < EMA(C, 17) AND MACD() < Signal();


Period = Optimize("Period", 17, 2, 200, 1);
EMACALC = EMA(C, Period);


_SECTION_BEGIN("Price");
SetChartOptions(0,chartShowArrows|chartShowDates);
_N(Title = StrFormat("{{NAME}} - {{INTERVAL}} {{DATE}} Open %g, Hi %g, Lo %g, Close %g (%.1f%%) {{VALUES}}", O, H, L, C, SelectedValue( ROC( C, 1 ) ) ));
Plot( C, "Close", ParamColor("Color", colorDefault ), styleNoTitle | ParamStyle("Style") | GetPriceStyle() );
_SECTION_END();


//============== TITLE ==============
_SECTION_BEGIN("Title");


Title = EncodeColor(colorGold)+ "GRAFICO BASICO" + EncodeColor(colorRose)+" (" +  Name() + ") " + EncodeColor(colorGold)+ Interval(2) +
 "  " + Date() +" " +" •  Open "+WriteVal(O,1.20)+"  •  "+"High "+WriteVal(H,1.20)+"  •  "+"Low "+WriteVal(L,1.20)+"  •  "+
"Close "+WriteVal(C,1.20)+"  • Variação R$ = " +WriteVal(C-Ref(C,-1),1.20,0)+"  • Variação % = " +WriteVal((C-Ref(C,-1))*100/Ref(C,-1),1.2)+ "%  •  Volume = "+ WriteVal(V,1.0);


upbar = COND1;
downbar = COND3;

/* Colourized price bars drawn here */
Graph0 = Close;
Graph0Style = 64;//number 64 = candlestick or 128 = bar;

barcolor = IIf( downbar, 4, IIf( upbar, 5, 42 ) );//number 4 = red, number 5 = green and number 42 = yellow;
Graph0BARColor = ValueWhen( barcolor != 0, barcolor );
// Only allowed in recent Beta
//SetBarFillColor = ValueWhen( barcolor != 0, barcolor );

 _SECTION_END();

 Plot(EMACALC, "EMACALC", COLORWHITE, styleLine,0,0,0,0,2);
2 comments
Leave Comment
Please login here to leave a comment.
Back
To improve visualization of green candles replace the line 19 by this:
It shows Error.