Stock Portfolio Organizer
The ultimate porfolio management solution.
Shares, Margin, CFD's, Futures and Forex
EOD and Realtime
Dividends and Trust Distributions
And Much More ....
WiseTrader Toolbox
#1 Selling Amibroker Plugin featuring:
Advanced Adaptive Indicators
Advanced Pattern Exploration
Neural Networks
And Much More ....
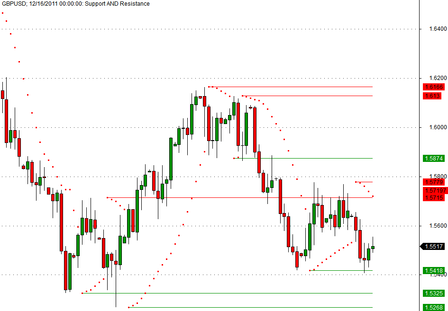
Support and resistance levels using SAR for Amibroker (AFL)
Rating:
3 / 5 (Votes 2)
Tags:
amibroker, support, resistance, sar
Support and resistance levels using SAR
Screenshots
Indicator / Formula
Copy & Paste Friendly
1 2 3 4 5 6 7 8 9 10 11 12 13 14 15 16 17 18 19 20 21 22 23 24 25 26 27 28 29 | _SECTION_BEGIN("Support and resistance levels using SAR"); //Support and resistance levels using SAR.//ABUSLIMAN //Load into Indicator Builder//Sensitivity of the levels can be changed with the variables//Can test different numbers live with the Param function ctrl-R with open paneacc = Param("Acceleration", 0.02, 0, 1, 0.001 );accm = Param("Max. acceleration", 0.2, 0, 1, 0.001 );NumLine = Param("Num Lines",8,1,20,1); Base = SAR( acc, accm );GraphXSpace=0.5;Plot(C,"",colorBlack,styleCandle);Plot( SAR( acc, accm ), _DEFAULT_NAME(), ParamColor( "Color", colorCycle ), ParamStyle("Style", styleDots | styleNoLine, maskDefault | styleDots | styleNoLine ) ); for( i = 1; i <= numline; i++ ){ResBase = LastValue(ValueWhen(BASE>O AND Ref(BASE,-1)<O,BASE,i));SupBase = LastValue(ValueWhen(BASE<O AND Ref(BASE,-1)>O,BASE,i));Plot(ValueWhen( ResBase==BASE, BASE,1 ), "Resist Level", colorRed,styleLine);Plot(ValueWhen( supbase==BASE, BASE,1 ), "Support Level", colorGreen,styleLine);}Title = Name() + "; " + Date() + ": Support AND Resistance"; _SECTION_END(); |
1 comments
Leave Comment
Please login here to leave a comment.
Back
sir
how to trade and which time frame
which time frame for crudeoil and banknifty is best