Stock Portfolio Organizer
The ultimate porfolio management solution.
Shares, Margin, CFD's, Futures and Forex
EOD and Realtime
Dividends and Trust Distributions
And Much More ....
WiseTrader Toolbox
#1 Selling Amibroker Plugin featuring:
Advanced Adaptive Indicators
Advanced Pattern Exploration
Neural Networks
And Much More ....
Day tranding System for Amibroker (AFL)
Rating:
4 / 5 (Votes 4)
Tags:
trading system, amibroker
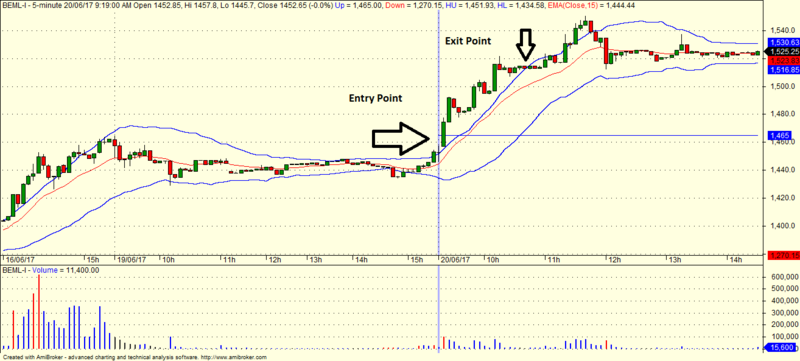
This is a Day trading system.
Explore the AFL in daily time frame and watch it in 5 min Chart.
if Stock breaking out is above or below Blue band than enter the trade and exit if close below EMA line or price enters again in Band according to your risk profile.
Screenshots
Indicator / Formula
Copy & Paste Friendly
_SECTION_BEGIN("Price");
SetChartOptions(0,chartShowArrows|chartShowDates);
_N(Title = StrFormat("{{NAME}} - {{INTERVAL}} {{DATE}} Open %g, Hi %g, Lo %g, Close %g (%.1f%%) {{VALUES}}", O, H, L, C, SelectedValue( ROC( C, 1 ) ) ));
Plot( C, "Close", ParamColor("Color", colorBlack ), styleNoTitle | ParamStyle("Style") | GetPriceStyle() );
_SECTION_END();

_SECTION_BEGIN("Brk Line");
H1 = TimeFrameGetPrice("H",inDaily,-1);
H2 = TimeFrameGetPrice("H",inDaily,-2);
H3 = TimeFrameGetPrice("H",inDaily,-3);
H4 = TimeFrameGetPrice("H",inDaily,-4);
H5 = TimeFrameGetPrice("H",inDaily,-5);
H6 = TimeFrameGetPrice("H",inDaily,-6);
H7 = TimeFrameGetPrice("H",inDaily,-7);

L1 = TimeFrameGetPrice("L",inDaily,-1);
L2 = TimeFrameGetPrice("L",inDaily,-2);
L3 = TimeFrameGetPrice("L",inDaily,-3);
L4 = TimeFrameGetPrice("L",inDaily,-4);
L5 = TimeFrameGetPrice("L",inDaily,-5);
L6 = TimeFrameGetPrice("L",inDaily,-6);
L7 = TimeFrameGetPrice("L",inDaily,-7);

du = Max(Max(Max(Max(Max(Max(H1,H2),H3),H4),H5),H6),H7);
dl = Min(Min(Min(Min(Min(Min(L1,L2),L3),L4),L5),L6),L7);

x = BarIndex();
x1 = (BarCount -1);
xL = SelectedValue(ValueWhen((Day()!=Ref(Day(),-1)),x,1));
yy = Status( "pxchartheight" ) ;

Plot(LineArray(xL,SelectedValue(du),x1,SelectedValue(du),1),"Up",colorBlue,styleThick|styleNoRescale);
Plot(LineArray(xL,SelectedValue(dl),x1,SelectedValue(dl),1),"Down",colorRed,styleThick|styleNoRescale);
_SECTION_END();

_SECTION_BEGIN("Hadley");
//Headley Band
length=Param("Length",20,0,10000000);
ub=(High*(1+2*((((High-Low)/((High+Low)/2))*1000)*0.001)));
su=MA(ub, length );
Lb=(Low*(1-2*((((High-Low)/((High+Low)/2))*1000)*0.001)));
sl=MA(Lb, length );
Plot(su, "HU", colorBlue,styleThick);
Plot(sl, "HL", colorBlue,styleThick);
//Plot((su+sl)/2, "", colorBlue);
_SECTION_END();

_SECTION_BEGIN("EMA");
P = ParamField("Price field",-1);
Periods = Param("Periods", 15, 2, 300, 1, 10 );
Plot( EMA( P, Periods ), _DEFAULT_NAME(), ParamColor( "Color", colorCycle ), ParamStyle("Style") );
_SECTION_END();


_SECTION_BEGIN("Explore");
pds= Param("Period",7,1,1000000);
du = HHV(Ref(H,-1),pds);
dl = LLV(Ref(L,-1),pds);
Cond1 = Cross(C,du);
Cond3 = Cross(dl,C);

Filter = Cond1 OR Cond3 ;
AddColumn(IIf(Cond1,1,Null),"B1",1.2);
AddColumn(IIf(Cond3,1,Null),"S1",1.2);
_SECTION_END();
4 comments
Leave Comment
Please login here to leave a comment.
Back
hello sir red line what uses
sir signal ok but how to trade blue line red line detail tell me sir
in 5min
-blue line niche se up cross kare tab buy entry and red line uper se niche cross kare tab short…. and trade entry ke bad jab ema line opposite direction se cross ho tab trade se exit… hope now clear yor doubts ..Red line is for exit purpose and if you have some other exit criteria you can definitely use it.