Stock Portfolio Organizer
The ultimate porfolio management solution.
WiseTrader Toolbox
#1 Selling Amibroker Plugin featuring:
ADX of Vortex for Amibroker (AFL)
I found Vortex on www.wisestocktrader.com
I have added some calculations to generate ADX from it. It is smooth but sensitive.
.
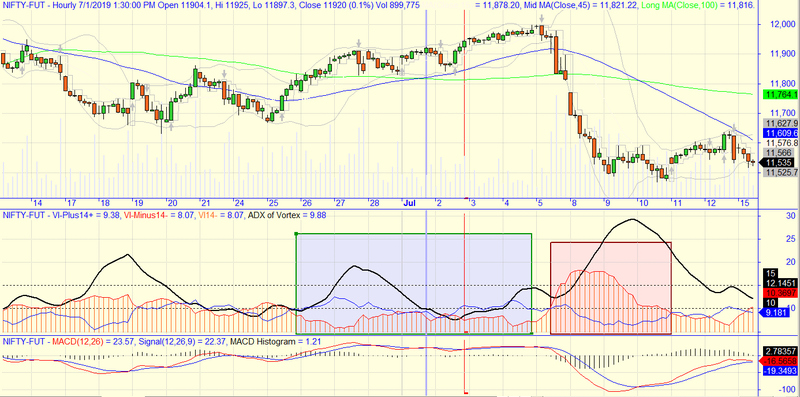
1) Rising ADX of Vortex from 10 to 15 is trend building area to be noticed.
.
2) Cross of Vi-Plus and VI-Minus is similar to MDI & PDI so when blue line goes above orange/red it is buy signal and visa-versa.
.
3) If ADX of Vortex is falling but above 10 and below 15 avoid trade in such case because even if signal is generated by cross over of Vi-Plus and VI-Minus it may not give good profit.
.
4) Once the position is taken and Price is steady but ADX of Vortex is falling then keep eye on cross over of Vi-Plus and VI-Minus to exit from trade.
.
5) VI-Minus is also plotted in histogram mode so bearish trend can be noticed quickly.
ADX of Vortex by Mr. Abhimanyu Yashwant Altekar
Email@abhimanyu.altekar@gmail.com
Screenshots
Indicator / Formula
/*---------------------------------------------------------------------------------------------------------------------------------------------------------------
I found Vortex on https://www.wisestocktrader.com
I have added some calculations to generate ADX from it. It is smooth but sensitive.
.
1) Rising ADX of Vortex  from 10 to 15 is trend building area to be noticed.
.
2) Cross of Vi-Plus and VI-Minus is similar to MDI & PDI so when blue line goes above orange/red it is buy signal and visa-versa.
.
3) If ADX of Vortex  is falling but above 10 and below 15 avoid trade in such case because even if signal is generated by cross over of  Vi-Plus and VI-Minus it may not give good profit.
.
4) Once the position is taken and Price is steady but ADX of Vortex is falling then keep eye on cross over of  Vi-Plus and VI-Minus to exit from trade.
.
5) VI-Minus is also plotted in histogram mode so bearish trend can be noticed quickly.
.
ADX of Vortex by Mr. Abhimanyu Yashwant Altekar Email@abhimanyu.altekar@gmail.com
 ----------------------------------------------------------------------------------------------------------------------------------------------------------------*/


period = Param("Period" , 14, 2 );

VMP = Sum( abs( H - Ref( L, -1 ) ), period );
VMM = Sum( abs( L - Ref( H, -1 ) ), period );
STR = Sum( ATR( 1 ), period );
VIP = VMP / STR;
VIM = VMM / STR;

DIDif=abs(VIP-VIM)*10;
DISum=(VIP+VIM)*10;
ADXofVortex=100*Wilders(DIDif/DISum,period);
Plot( VIP*10, "VI-Plus"+period, colorBlue | styleThick );
Plot( VIM*10, "VI-Minus"+period, colorRed  );
Plot( VIM*10, "", colorOrange , styleClipMinMax |  styleNoLabel | styleHistogram  );
Plot(ADXofVortex,"ADX of Vortex", colorBlack, styleThick | styleLine);
Plot(15,"",colorBlack,styleDashed   );
Plot(10,"",colorBlack,styleDashed   );


_SECTION_END();
8 comments
Leave Comment
Please login here to leave a comment.
Back
thanks
This indicator is very nice and useful.
is it possible to convert that to exploration and scanner? I tried but not successful (i am a newbie in AFL).
here is my code.
it did not have an error but no output!!!!
@_SECTION_BEGIN(“MA of ADX of VOrtex”);
// v 0.001 2
// MA of ADX of VOrtex
// Developed by Mehdi based on the ADX of Vortex download from internet
// ****************************************************************************************
// MAIN CODE
// ****************************************************************************************
period = Param(“Period” , 14, 2 );
period2 = Param(“Period2” , 3, 2 );
VMP = Sum( abs( H – Ref( L, -1 ) ), period );
VMM = Sum( abs( L – Ref( H, -1 ) ), period );
STR = Sum( ATR, period );
VIP = VMP / STR;
VIM = VMM / STR;
DIDif=abs(VIP-VIM)10;
DISum=(VIP+VIM)10;
ADXofVortex=100*Wilders(DIDif/DISum,period);
VIPD= VIP*10; // VIP Data
VIMD=VIM*10; //VIM Data
Plot( VIPD, “VI-Plus”period, colorBlue | styleThick );
Plot( VIMD, “VI-Minus”period, colorRed );
Plot(ADXofVortex,“ADX of Vortex”, colorWhite, styleThick | styleLine);
MAADXV= MA; // moving average of ADX of Vortex
Plot (MA, “MAADXV”, colorYellow, styleThick | styleLine);
Plot(15,"",colorWhite,styleLine);
Plot(10,"",colorWhite,styleDashed);
// END OF “MAIN CODE” SECTION
// ****************************************************************************************
// TRADING SYSTEM ENTRY FORMULAS
// ****************************************************************************************
Buy = Cross(ADXofVortex, MAADXV) AND VIP > VIM;
Short = Cross(MAADXV, ADXofVortex);
// Exploration in Amibroker
Filter = 1;
AddColumn(VIP,“VIP”,format=1.4);
AddColumn(VIM, “VIM”, format=1.4);
AddColumn(Buy, “Buy”, format=1.0);
AddColumn(Short, “Short”, format=1.0);
//AddColumn(BuyPrice, “BuyPrice”, format=1.2);
//AddColumn(ShortPrice, “ShortPrice”, format=1.2);
// END OF “TRADING SYSTEM ENTRY FORMULAS” SECTION
// ****************************************************************************************
// TRADING SYSTEM EXIT FORMULAS
// ****************************************************************************************
Sell = Short;
Cover = Buy;
// Exploration in Amibroker
AddColumn(Sell, “Sell”, format=1.0);
AddColumn(Cover, “Cover”, format=1.0);
//AddColumn(SellPrice, “SellPrice”, format=1.2);
//AddColumn(CoverPrice, “CoverPrice”, format=1.2);
// END OF “TRADING SYSTEM EXIT FORMULAS” SECTION
// ****************************************************************************************
// TRADING SYSTEM EXCESSIVE ENTRY/EXIT SIGNALS REMOVING FORMULAS
// ****************************************************************************************
Buy = ExRem(Buy, Sell);
Sell = ExRem(Sell, Buy);
Short = ExRem(Short, Cover);
Cover = ExRem(Cover, Short);
// END OF “TRADING SYSTEM EXCESSIVE ENTRY/EXIT SIGNALS REMOVING FORMULAS” SECTION
// ****************************************************************************************
// END OF CODE (BBFEAR.AFL)
// ****************************************************************************************
/**/
_SECTION_END();
@
@makhlaghi
I have not tried it.
@makhlaghi
makhlaghi
don’t mix this code with other code use it as separate indicator chart
@makhlaghi
Hello,
Frankly speaking I do not use Scanners, Generated + plotted Buy/Sell Signals and auto trading logic.
.
I Rather prefer to see patterns, beginning of patterns and peak of patterns visually/Manually on charts. Signal will come with some logic, but its development starts much before it. Some times you get signals when Trend is about to end so plotted signal and scanners are not effective every time .
.
IN ADX of Vortex already Wilders MA is used.
If you use average on any indicator it will be slow and you will get late results.
.
This indicator should not be used alone with price, it is not signal generator,
it is a Trend indicator. For signals you can use cross over of your favorite averages, as and when trend is established and shown by this indicator.
.
It will help you to avoid false signals in sideways market.
- Regards
@makhlaghi
Code Pasting is not proper here in comments
@makhlaghi
Tried to paste modified code of scanner and explorer but it does not accept it properly.
@makhlaghi
Send me email on abhimanyu.altekar@gmail.com, I’ll send you the modified code of scanner and explorer, It works but I can not ensure about signal quality and delay of signals.