Stock Portfolio Organizer
The ultimate porfolio management solution.
Shares, Margin, CFD's, Futures and Forex
EOD and Realtime
Dividends and Trust Distributions
And Much More ....
WiseTrader Toolbox
#1 Selling Amibroker Plugin featuring:
Advanced Adaptive Indicators
Advanced Pattern Exploration
Neural Networks
And Much More ....
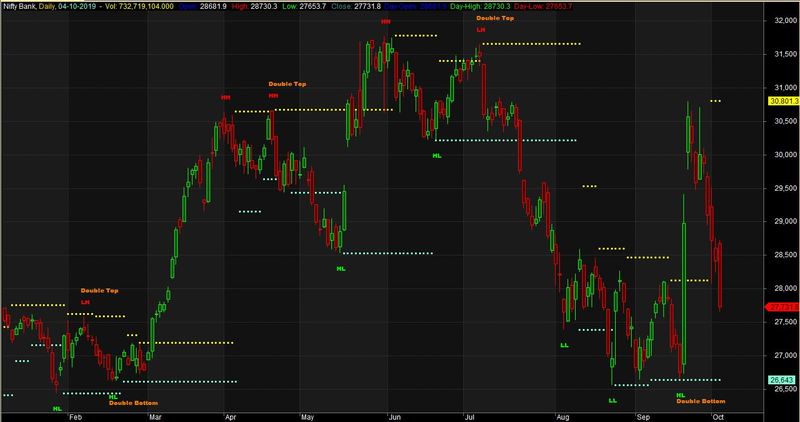
Double Top & Double Bottom Indicator for Amibroker (AFL)
Rating:
5 / 5 (Votes 5)
Tags:
amibroker, pattern
Double Top(DT) or Double Bottom (DB) indicator, is the best Price Action Pattern on longer time frame that makes money always. Best used on EOD chart.
Trading logic is, if DB is confirmed in EOD chart, buy next day & vice-versa for DT.
Screenshots
Indicator / Formula
Copy & Paste Friendly
_SECTION_BEGIN("DBDT");
GraphXSpace = 5;
SetChartBkColor( colorBlack );
SetChartOptions( 1, chartShowDates, chartGridMiddle, 0, 0, 0 );
SetChartOptions(0,chartShowArrows|chartShowDates);
SetBarFillColor( IIf( C > O, ColorRGB( 0, 75, 0 ), IIf( C <= O, ColorRGB( 75, 0, 0 ), colorLightGrey ) ) );

_SECTION_BEGIN("Title");
DODay = TimeFrameGetPrice("O", inDaily);
DHiDay = TimeFrameGetPrice("H", inDaily);
DLoDay = TimeFrameGetPrice("L", inDaily);
Title = EncodeColor(colorWhite)+  Name() + ", " + EncodeColor(colorGold)+ Interval(2) + ", " + EncodeColor(colorAqua)+Date() + EncodeColor(colorWhite)+"  -  " +
EncodeColor(colorYellow)   + "Vol: "+ WriteVal(V) +
EncodeColor(colorBlue)   +  "   Open: " + EncodeColor(colorWhite) + O +
EncodeColor(colorRed)+ "   High: "   +EncodeColor(colorWhite) + H +
EncodeColor(colorBrightGreen)+ "   Low: " +EncodeColor(colorWhite) + L +
EncodeColor(colorTeal) +"   Close: "  + EncodeColor(colorWhite) +C +
EncodeColor(colorBlue)+ "  Day-Open: " +DODay + EncodeColor(colorBrightGreen)+"  Day-High: " +DHiDay +EncodeColor(colorRed)+ "  Day-Low: " + DLoDay;
_SECTION_END();

Plot( C, "", IIf( C > O, ColorRGB( 0, 255, 0 ), IIf( C <= O, ColorRGB( 255, 0, 0 ), colorLightGrey ) ), 64, Null, Null, 0, 0, 1 );

// Fractal Pivots, E.M.Pottasch 2/2018
bi = BarIndex();
fvb = FirstVisibleValue( bi );
lvb = LastVisibleValue( bi );

rightstrength = Param( "Right Strength", 5, 1, 50, 1 );
leftstrength = Param( "Left Strength", 5, 1, 50, 1 );
fact = Param( "Chart Time Frame Factor", 2, 1, 10, 1 );

rightStrength = rightStrength * fact;
leftStrength = leftStrength * fact;

pk = H == HHV( H, leftstrength ) AND Ref( HHV( H, rightstrength ), rightstrength ) < H;
tr = L == LLV( L, leftstrength ) AND Ref( LLV( L, rightstrength ), rightstrength ) > L;
pkl = H == HHV( H, leftstrength );
trl = L == LLV( L, leftstrength );

for( i = 0; i < 3; i++ )
{
    VarSet( "px" + i, ValueWhen( pk, bi, i ) );
    VarSet( "tx" + i, ValueWhen( tr, bi, i ) );
    VarSet( "ph" + i, ValueWhen( pk, H, i ) );
    VarSet( "tl" + i, ValueWhen( tr, L, i ) );
}

ll = tr AND tl1 < tl2;
hl = tr AND tl1 > tl2;
hh = pk AND ph1 > ph2;
lh = pk AND ph1 < ph2;
dt = pk AND ph1 == ph2;
db = tr AND tl1 == tl2;

//PlotShapes( shapeSmallCircle * trl, ColorRGB( 80, 0, 0 ), 0, L, -10 );
//PlotShapes( shapeSmallCircle * pkl, ColorRGB( 0, 80, 0 ), 0, H, 10 );
//PlotShapes( shapeSmallCircle * tr, ColorRGB( 0, 255, 0 ), 0, L, -10 );
//PlotShapes( shapeSmallCircle * pk, ColorRGB( 255, 0, 0 ), 0, H, 10 );

doubleTopThreshold = 0.75 * Ref( ATR( 20 ), -1 );
doubleTop = pk && abs( ph1 - ph2 ) < doubleTopThreshold;

doubleBottomThreshold = 0.75 * Ref( ATR( 20 ), -1 );
doubleBottom = tr && abs( tl1 - tl2 ) < doubleBottomThreshold;

for( i = lvb; i > fvb; i-- )
{
    sz = 8;

    // troughs
    if( ll[i] )
    {
        str = "LL";
        PlotTextSetFont( str, "Arial Black", sz, i, L[i], ColorRGB( 0, 250, 0 ), colorDefault, -30 );
    }

    if( hl[i] )
    {
        str = "HL";
        PlotTextSetFont( str, "Arial Black", sz, i, L[i], ColorRGB( 0, 250, 0 ), colorDefault, -30 );
    }

    if( db[i] )
    {
        str = "DB";
        PlotTextSetFont( str, "Arial Black", sz, i, L[i], ColorRGB( 0, 250, 0 ), colorDefault, -30 );
    }

    //peaks
    if( hh[i] )
    {
        str = "HH";
        PlotTextSetFont( str, "Arial Black", sz, i, H[i], ColorRGB( 250, 0, 0 ), colorDefault, 20 );
    }

    if( lh[i] )
    {
        str = "LH";
        PlotTextSetFont( str, "Arial Black", sz, i, H[i], ColorRGB( 250, 0, 0 ), colorDefault, 20 );
    }

    if( dt[i] )
    {
        str = "DT";
        PlotTextSetFont( str, "Arial Black", sz, i, H[i], ColorRGB( 250, 0, 0 ), colorDefault, 20 );
    }

    if( doubleTop[i] )
    {
        str = "Double Top";
        PlotTextSetFont( str, "Arial Black", sz, i, H[i], ColorRGB( 250, 125, 0 ), colorDefault, 40 );
    }

     if( doubleBottom[i] )
    {
        str = "Double Bottom";
        PlotTextSetFont( str, "Arial Black", sz, i, L[i], ColorRGB( 250, 125, 0 ), colorDefault, -40 );
    }

}

writeif( highest( doubleTop ) == 1, "\nAmiBroker has detected some possible Double Top patterns for " + name() + "\n\nLook for TAG on the price chart.", "\n\nThere are no double top patterns for " + name() );
writeif( highest( doubleBottom ) == 1, "\n\nAmiBroker has detected some possible Double Bottom patterns for " + name() + "\n\nLook for TAG on the price chart.", "\nThere are no double top patterns for " + name() );

_SECTION_END();
8 comments
Leave Comment
Please login here to leave a comment.
Back
pls correct coding apply.
showing errors in the AFL. please correct.
hi niladri sir is this code looks future or it will give current bar signals without looking future
See comments below::
Exploration added. Just paste the below code for historic exploration on EOD data & back-testing.
=======
=======
Warning on the code was due to excessive parameter used in the title.
A fixed version of the Title section could be as follows:
==========
==========
Also, changed to price plot, to get the OHLC values from the candle directly.
Now this code can be used as an independent indicator on it’s own, for pure Price Action Play.
Happy Trading!!
Hi, again i’m facing some syntax errors.
PlotTextSetFont( str, “Arial Black”, sz, i, L[i], ColorRGB( 0, 250, 0 ), colorDefault, -30 );
Error 32, syntax error in the AFL, after corrected one also.
please look it once. Thank you.
Hello,
I have one doubt, is this AFL works only Advanced version of Amibroker? I’m using 5.40 version.
Please use Amibroker 6.02 or above.