Stock Portfolio Organizer
The ultimate porfolio management solution.
Shares, Margin, CFD's, Futures and Forex
EOD and Realtime
Dividends and Trust Distributions
And Much More ....
WiseTrader Toolbox
#1 Selling Amibroker Plugin featuring:
Advanced Adaptive Indicators
Advanced Pattern Exploration
Neural Networks
And Much More ....
50 Moving Average Pull Back for Amibroker (AFL)
Rating:
5 / 5 (Votes 1)
Tags:
moving average, amibroker
Use 15min chart.
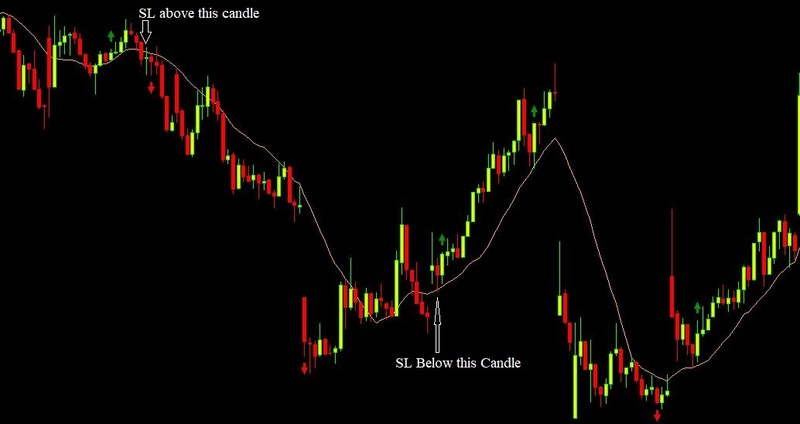
Buy few points above the Buy Arrow Candle
Sell few points below the Sell Arrow Candle.
StopLoss
If u r in Buy put SL below the Buy arrow candle r previous candle which ever is low.
If u r in Sell Put SL above the Sell Arrow Candle r previous candle which ever is high.
Target:
Keep Target as nearest Support OR Resistance Level.
Select the code and run ANALYSIS every 15min to get the latest arrow formed stocks.
Avoid 9.15 and 9.30 candle arrows.
For more accuracy call should b activated immediately to the arrow candle.
Screenshots
Indicator / Formula
Copy & Paste Friendly
_SECTION_BEGIN("Price");
SetChartOptions(0,chartShowArrows|chartShowDates);
_N(Title = StrFormat("{{NAME}} - {{INTERVAL}} {{DATE}} Open %g, Hi %g, Lo %g, Close %g (%.1f%%) {{VALUES}}", O, H, L, C, SelectedValue( ROC( C, 1 ) ) ));
Plot( C, "Close", ParamColor("Color", colorDefault ), styleNoTitle | ParamStyle("Style") | GetPriceStyle() );
_SECTION_END();

_SECTION_BEGIN("MA");
P = ParamField("Price field",-1);
Periods = Param("Periods", 15, 2, 300, 1, 10 );
Plot( MA50 = MA( P, Periods ), _DEFAULT_NAME(), ParamColor( "Color", colorCycle ), ParamStyle("Style") );

MCH1=TimeFrameGetPrice( "H", in15Minute, -1);
MCH2=TimeFrameGetPrice( "H", in15Minute, -2);
MCL1=TimeFrameGetPrice( "L", in15Minute, -1);
MCL2=TimeFrameGetPrice( "L", in15Minute, -2);
MCO1=TimeFrameGetPrice( "O", in15Minute, -1);
MCO2=TimeFrameGetPrice( "O", in15Minute, -2);
MCC1=TimeFrameGetPrice( "C", in15Minute, -1);
MCC2=TimeFrameGetPrice( "C", in15Minute, -2);


Buy = MA50 <= MCH1 && MA50 >= MCL1 && MCO1 > MA50 && MCO1 > MCC1 && MA50 < MCC1 && O < C && MCH1 < H;
Sell = MA50 <= MCH1 && MA50 >= MCL1 && MCO1 < MA50 && MCO1 < MCC1 && MA50 > MCC1 && O > C && MCL1 > L;


shape = Buy * shapeUpArrow + Sell * shapeDownArrow;	//Set Order Shape

	//Plot Order Signal
	PlotShapes( shape, IIf( Buy, colorGreen, colorRed), 0,IIf( Buy, High, Low), 15);

_SECTION_END();
1 comments
Leave Comment
Please login here to leave a comment.
Back
MA50 = MA ( P, Periods ) by Periods = 15 ?