Stock Portfolio Organizer
The ultimate porfolio management solution.
Shares, Margin, CFD's, Futures and Forex
EOD and Realtime
Dividends and Trust Distributions
And Much More ....
WiseTrader Toolbox
#1 Selling Amibroker Plugin featuring:
Advanced Adaptive Indicators
Advanced Pattern Exploration
Neural Networks
And Much More ....
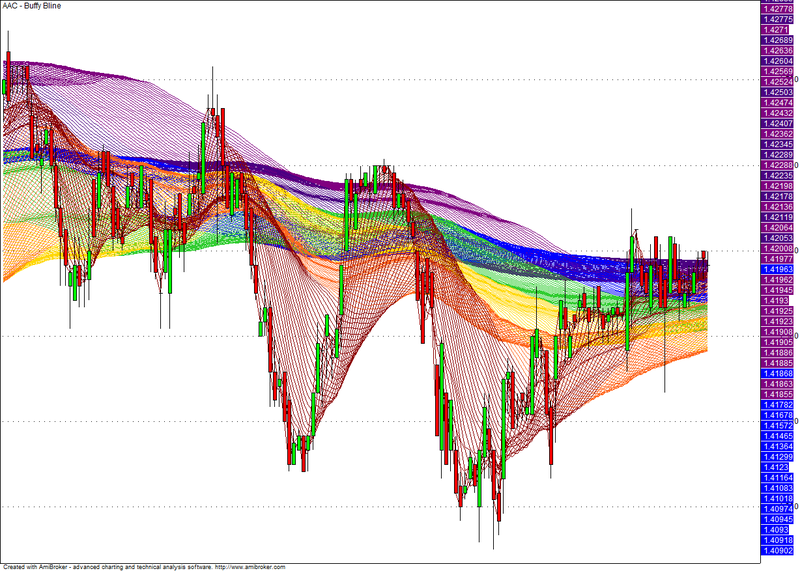
Fishnet Rainbow Chart for Amibroker (AFL)
Rating:
4 / 5 (Votes 2)
Tags:
amibroker, moving average
Fishnet rainbow chart. Basically plots heaps of different moving averages that produces a result that looks like a rainbow chart.
Screenshots
Similar Indicators / Formulas
Hull Moving Average (HMA)
Submitted
by kaiji over 15 years ago
Smoothed MA (SSMA)
Submitted
by kelvinhand almost 12 years ago
Trend Scalping System
Submitted
by esnataraj almost 15 years ago
TD DeMarker Plane
Submitted
by extremist almost 14 years ago
Buff Volume Weighted Moving Averages
Submitted
by kaiji about 15 years ago
Indicator / Formula
Copy & Paste Friendly
1 2 3 4 5 6 7 8 9 10 11 12 13 14 15 16 17 18 19 20 21 22 23 24 25 26 27 28 29 30 31 32 33 34 35 36 37 38 39 40 41 42 43 44 45 46 47 48 49 50 51 52 53 54 55 56 57 | /* This code plot fishnet with rainbow colors. I use 30 MA per color.*/_SECTION_BEGIN("");Plot( C, "Close", ParamColor("Color", colorBlack ), styleNoTitle | ParamStyle("Style", styleCandle, maskPrice ) );net= 30; // This value can be changed. It`s how many MA:s every color have.for (i=1; i<net;i++) {Plot(MA(Close,i),"",colorDarkRed,styleLine);}for (i=net; i<2*net;i++) {Plot(MA(Close,i),"",colorOrange,styleLine);}for (i=2*net; i<3*net;i++) {Plot(MA(Close,i),"",colorGold,styleLine);}for (i=3*net; i<4*net;i++) {Plot(MA(Close,i),"",colorLime,styleLine);}for (i=4*net; i<5*net;i++) {Plot(MA(Close,i),"",colorBlue,styleLine);}for (i=5*net; i<6*net;i++) {Plot(MA(Close,i),"",colorIndigo,styleLine);}for (i=6*net; i<7*net;i++) {Plot(MA(Close,i),"",colorViolet,styleLine);}_SECTION_END(); |
1 comments
Leave Comment
Please login here to leave a comment.
Back
good indicator