Rockwell style v1 for Amibroker (AFL)
tomsky almost 15 years ago Amibroker (AFL)
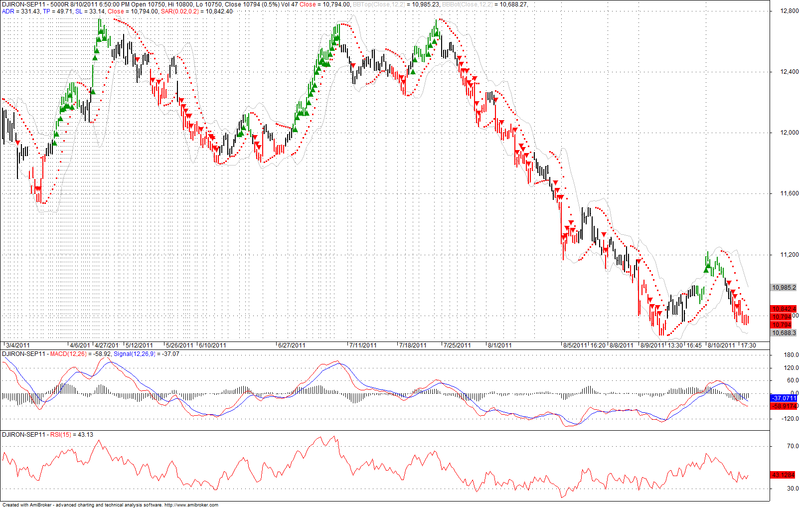
This collection of indicators is made after rockwelltrading.com setup. It consists of MACD, RSI, BB and range bars.
Trading is simple, buy when the bars are green and an arrow under and sell when are red and the arrow above. Parabolic SAR was added for SL&TP. Enjoy!
Screenshots
Indicator / Formula
Copy & Paste Friendly
_SECTION_BEGIN("Price");
SetChartOptions(0,chartShowArrows|chartShowDates);
_N(Title = StrFormat("{{NAME}} - {{INTERVAL}} {{DATE}} Open %g, Hi %g, Lo %g, Close %g (%.1f%%) Vol " +WriteVal( V, 1.0 ) +" {{VALUES}}", O, H, L, C, SelectedValue( ROC( C, 1 )) ));

trendup = IIf(MACD(12,26) > 0 AND MACD(12,26) > Signal(12,26,9), colorGreen, colorBlack);
trendcolor = IIf(MACD(12,26) < 0 AND MACD(12,26) < Signal(12,26,9), colorRed, trendup);
Plot( C, "Close", trendcolor, styleBar | styleThick );

//RSIup = RSI(7) > 70;
//RSIdown = RSI(7) < 30;

sp = Param( "RSI Period", 7, 1, 100 );
r = RSI( sp );
RSIup = r > 70;
RSIdown = r < 30;

shape = RSIup * shapeSmallUpTriangle + RSIdown * shapeSmallDownTriangle;
PlotShapes(shape, IIf( RSIup, colorGreen, colorRed ), 0, IIf( RSIup, Low, High ) );

if( ParamToggle("Tooltip shows", "All Values | Only Prices" ) )
{
 ToolTip=StrFormat("Open: %g\nHigh:  %g\nLow:   %g\nClose:  %g (%.1f%%)\nVolume: "+NumToStr( V, 1 ), O, H, L, C, SelectedValue( ROC( C, 1 )));
}
_SECTION_END();


_SECTION_BEGIN("BBands");
P = ParamField("Price field",-1);
Periods = Param("Periods", 12, 2, 100, 1 );
Width = Param("Width", 2, 0, 10, 0.05 );
Color = ParamColor("Color", colorLightGrey );
Style = ParamStyle("Style") | styleNoRescale;
Plot( BBandTop( P, Periods, Width ), "BBTop" + _PARAM_VALUES(), Color, Style );
Plot( BBandBot( P, Periods, Width ), "BBBot" + _PARAM_VALUES(), Color, Style );

// calcul average daily range pe ultimele 7 zile

HD1 = TimeFrameGetPrice("H", inDaily, -1);
LD1 = TimeFrameGetPrice("L", inDaily, -1);
M1 = HD1 - LD1;
HD2 = TimeFrameGetPrice("H", inDaily, -2);
LD2 = TimeFrameGetPrice("L", inDaily, -2);
M2 = HD2 - LD2;
HD3 = TimeFrameGetPrice("H", inDaily, -3);
LD3 = TimeFrameGetPrice("L", inDaily, -3);
M3 = HD3 - LD3;
HD4 = TimeFrameGetPrice("H", inDaily, -4);
LD4 = TimeFrameGetPrice("L", inDaily, -4);
M4 = HD4 - LD4;
HD5 = TimeFrameGetPrice("H", inDaily, -5);
LD5 = TimeFrameGetPrice("L", inDaily, -5);
M5 = HD5 - LD5;
HD6 = TimeFrameGetPrice("H", inDaily, -6);
LD6 = TimeFrameGetPrice("L", inDaily, -6);
M6 = HD6 - LD6;
HD7 = TimeFrameGetPrice("H", inDaily, -7);
LD7 = TimeFrameGetPrice("L", inDaily, -7);
M7 = HD7 - LD7;

//ADR = MA(High - Low,7);
ADR = (M1+M2+M3+M4+M5+M6+M7)/7;
tp = ADR*0.15;
sl = ADR*0.1;
//TimeFrameRestore();
Plot(ADR, "\nADR", colorBlue, styleNoLine | styleNoRescale | styleNoLabel);
Plot(tp, "TP", colorBlue, styleNoLine | styleNoRescale | styleNoLabel);
Plot(sl, "SL", colorBlue, styleNoLine | styleNoRescale | styleNoLabel);

// ----------------

_SECTION_END();

_SECTION_BEGIN("Price");
SetChartOptions(0,chartShowArrows|chartShowDates);
_N(Title = StrFormat("{{NAME}} - {{INTERVAL}} {{DATE}} Open %g, Hi %g, Lo %g, Close %g (%.1f%%) Vol " +WriteVal( V, 1.0 ) +" {{VALUES}}", O, H, L, C, SelectedValue( ROC( C, 1 )) ));

trendup = IIf(MACD(12,26) > 0 AND MACD(12,26) > Signal(12,26,9), colorGreen, colorBlack);
trendcolor = IIf(MACD(12,26) < 0 AND MACD(12,26) < Signal(12,26,9), colorRed, trendup);
Plot( C, "Close", trendcolor, styleBar | styleThick );

//RSIup = RSI(7) > 70;
//RSIdown = RSI(7) < 30;

sp = Param( "RSI Period", 7, 1, 100 );
r = RSI( sp );
RSIup = r > 70;
RSIdown = r < 30;

shape = RSIup * shapeSmallUpTriangle + RSIdown * shapeSmallDownTriangle;
PlotShapes(shape, IIf( RSIup, colorGreen, colorRed ), 0, IIf( RSIup, Low, High ) );

if( ParamToggle("Tooltip shows", "All Values | Only Prices" ) )
{
 ToolTip=StrFormat("Open: %g\nHigh:  %g\nLow:   %g\nClose:  %g (%.1f%%)\nVolume: "+NumToStr( V, 1 ), O, H, L, C, SelectedValue( ROC( C, 1 )));
}
_SECTION_END();

_SECTION_BEGIN("SAR");
acc = Param("Acceleration", 0.02, 0, 1, 0.001 );
accm = Param("Max. acceleration", 0.2, 0, 1, 0.001 );
Plot( SAR( acc, accm ), _DEFAULT_NAME(), ParamColor( "Color", colorCycle ), ParamStyle("Style", styleDots | styleNoLine, maskDefault | styleDots | styleNoLine ) );
_SECTION_END();
8 comments
Leave Comment
Please login here to leave a comment.
thank you plz Trading time
They advise to trade on range/tick bars: ES (mini S&P futures)-8 tick range bars, YM (Dow Indu futures)-16 tick range bars etc (in AB you can set this in Preferences-Intraday). If you trade different instruments you should find a setup that works for you or just use it on normal bars (time based) and see if it fits. GL!
LE: Seems i forgot to change the RSI period, should be set to 7 !!! Maybe admin cand post this comment in the description?
Hi Guys
TKs for the AB Formula, has anyone have this formula in MT4 format
Ed
I see that the bars are not range bars. If we have range bars, will the code still hold good for the indicators (MACD, BB and RSI)? Will it be as explained by rockwell.com?
AB has an awkward style of plotting range bars that’s why when i’m trading with this setup i’m using normal bars (5m, 1h etc).
It shouldn’t be ahrd to “translate” it in other formats as the rules are simple: red bars when MACD<0 and it’s signal, green when above 0 and signal and triangles are ploted when RSI is above 70 or below 30. Add Bolinger bands and Parabolic SAR and this is it!
Hi i am getting error 32 syntax error its unable to insert this alf kindly tell me the solution
Nice afl
NICE AFL