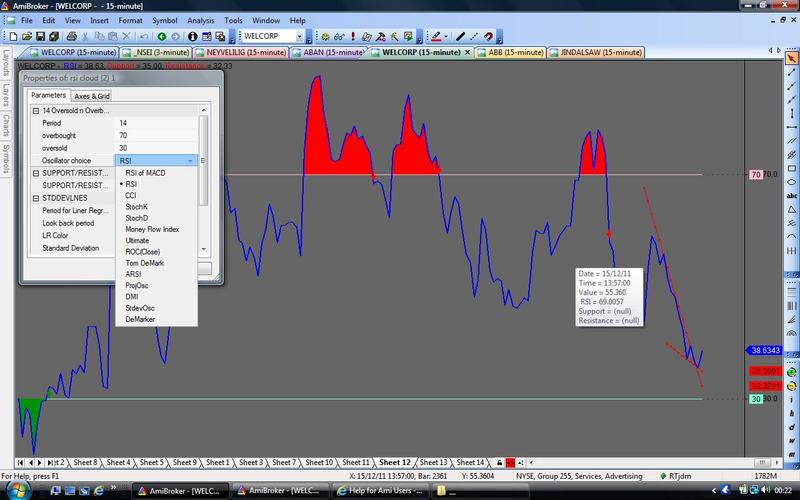
14 Oversold n Overbought indicators with Support n Resistance for Amibroker (AFL)
ankit dargan over 14 years ago Amibroker (AFL)
These codes consist day to day 14 trading formulas namely
MACD
RSI
CCI
StochK
StochD
Money Flow Index
Ultimate
ROC
Tom DeMark range expansion
ARSI
Projection Oscillator
DMI
Stdeviation Oscillator
DeMarker
mostly in range of 0-100 that we use along with price charts n that execute our trade n along with these indicators i also put support n resistace zones for comfort of a trader namely trendlines, Fibonacc lines n standard deviation line
plus overbought n oversold zone(custom) in clouded area
note – these indicators gives real time buy n sell signals without future reference or doesnot change signals as when future close changes so plz check use bar reply option n doing paper traders first
Screenshots
Indicator / Formula
/*These codes consist day to day 14 trading formulas namely

MACD,RSI,CCI,StochK,StochD,Money Flow Index,Ultimate,ROC(Close),Tom DeMark,ARSI,ProjOsc,DMI,StdevOsc,DeMarker

mostly in range of 0-100 that we use along with price charts n that execute our trade n along with these indicators i also put support n resistace zones for comfort of a trader namely trendlines, Fibonacc lines n standard deviation line
plus overbought n oversold zone(custom) in clouded area
plotted by - ankit dargan
*/

_SECTION_BEGIN("14 Oversold n Overbought indicators with Support n Resistance");
SetChartBkColor( colorGrey40 ) ;
SetChartOptions(0,0,ChartGrid30 | ChartGrid70 );

Pds=Param("Period",14,7,33,1);
Ob=Param("overbought",70,-200,200,5);
Os=Param("oversold",30,-200,200,5);

/****Dimitri Code***********/
/*14-Day RSI of MACD()*/
//t=14; Replaced with pds= statement
Var=MACD();
Up=IIf(Var>Ref(Var,-1),abs(Var-Ref(Var,-1)),0);
Dn=IIf(Var<Ref(Var,-1),abs(Var-Ref(Var,-1)),0);
Ut=Wilders(Up,Pds);
Dt=Wilders(Dn,Pds);
RSIt=100*(Ut/(Ut+Dt));
/************End Code*************************/

/****Tom DeMark's Range Expansion Index***********/
HighMom = H - Ref( H, -2 );
LowMom = L - Ref( L, -2 );
Cond1 = ( H >= Ref( L,-5) OR H >= Ref( L, -6 ) );
Cond2 = ( Ref( H, -2 ) >= Ref( C, -7 ) OR Ref( H, -2 ) >= Ref( C, -8 ) );
Cond3 = ( L <= Ref( H, -5 ) OR L <= Ref( H, -6) );
Cond4 = ( Ref( L, -2 ) <= Ref( C, -7 ) OR Ref( L, -2 ) <= Ref( C, -8 ) );
Cond = ( Cond1 OR Cond2 ) AND ( Cond3 OR Cond4 );
Num = IIf( Cond, HighMom + LowMom, 0 );
Den = abs(  HighMom ) + abs( LowMom );
TDREI = 100 * Sum( Num, 5 )/Sum( Den, 5 ) ;
/************End Code*************************/


/****Tom DeMark's DeMarker***********/

highm = IIf( H > Ref( H, -1 ), H - Ref( H, - 1), 0 );
lowm = IIf( L < Ref( L, -1 ), Ref( L, - 1 ) - L, 0 );

DeMarker = 100 *  Sum( highm, 13 )/( Sum( lowm, 13 ) + Sum( highm, 13 ) );


/****ARSI formula***********/
// variable  period version (backtest-safe)
Chg = C - Ref( C, -1 );
UpCount = Sum( Chg >= 0, Pds );
DnCount = Pds - UpCount;
UpMove = AMA( Max( Chg, 0 ), 1/UpCount );
DnMove = AMA( Max( -Chg, 0 ), 1/DnCount );
RS = UpMove/DnMove;
ARSI = 100-(100/(1+RS));
/************End Code*************************/


/****Projection Oscillator***********/

function ProjOsc(Pds) {

// Slope of High {n period regression line of High)}
SlopeHigh = ((Pds * (Sum( Cum(1) * High, Pds))) - (Sum( Cum(1),Pds) * (
Sum(High, Pds)))) / ((Pds * Sum( Cum(1) ^ 2 , Pds)) - (Sum(Cum(1),Pds) ^
2));

//Slope of Low {n period regression line of Low}
SlopeLow = ((Pds * (Sum( Cum(1) * Low, Pds))) - (Sum( Cum(1), Pds) * (
Sum(Low, Pds)))) / ((Pds * Sum( Cum(1)^ 2, Pds)) - ( Sum(Cum(1),Pds) ^
2));

//Upper Projection Band
UpProjBand = 0;
for (i=0; i<Pds-1; i++)
{
UpProjBand =
Max(Max(Ref(High,-i)+i*slopehigh,Ref(High,-i-1)+(i+1)*slopehigh),UpProjBand);
}

//Lower Projection Band
LoProjBand = 10000;
for (i=0; i<Pds-1; i++)
{
LoProjBand =
Min(Min(Ref(Low,-i)+i*slopelow,Ref(Low,-i-1)+(i+1)*slopelow),LoProjBand);
}

//Projection Oscillator
ProOsc = 100 * (Close - LoProjBand) / (UpProjBand - LoProjBand);

return ProOsc;

}
aa= ProjOsc(Pds);
//bb= MA(ProjOsc(Pds),av);

//Plot(aa,"Projection Osc",colorBrightGreen,styleLine);
//Plot(bb,"MA ProjOsc",colorRed,styleLine);

/************End Code*************************/


/****Dynamic Momentum Index***********/

//period = Param( "RSI Period", 13, 1, 100, 1 );
//MAperiod = Param( "MA Period", 5, 1, 100, 1 );
//StDevperiod = Param( "StDev Period", 8, 1, 100, 1 );

upday=IIf(C>Ref(C,-1),C-Ref(C,-1),0);
downday=IIf(Ref(C,-1)> C,Ref(C,-1)-C,0);

Stda=MA(StDev(C,8),5);//by default 5 is maperiod n 8 is stdevperiod
V1=StDev(C,8)/Stda;
TD=int(Pds/V1);

Su=Sum(upday,TD);
Sd=Sum(downday,TD);
M1=(Su-Sd);
M2=abs(Su+Sd);
DMI=50*(M1+M2)/M2;
//xs=Param("Smoothing",3,1,10,1);
//xs1=Param("Trigger Line",5,1,10,1);
//Plot(EMA(DMI,xs),"Dynamic Momentum Index ",colorRed,1);
//Plot(MA(DMI,xs1),"trigger",colorBlue,1);

/************End Code*************************/

/****Stddev Oscillator***********/

StdevOsc=( ( C+2 * StDev( C,pds ) - MA( C,pds ) ) / ( 4 * StDev( C,pds ) ) ) * 100;


/************End Code*************************/


/*******Variables******************/

A1=RSIt; B2=RSI(pds); C3=CCI(pds); D4=StochK(pds); E5=StochD(pds);
F6=MFI(pds); G7=Ultimate(pds); H8=ROC(C,pds); I9=TDREI; J10=ARSI; K11=ProjOsc(Pds); L12= DMI; M13=StdevOsc ; N14 =DeMarker;//DO HERE


oc=ParamList("Oscillator choice","RSI of MACD|RSI|CCI|StochK|StochD|Money Flow Index|Ultimate|ROC(Close)|Tom DeMark|ARSI|ProjOsc|DMI|StdevOsc|DeMarker",1);
Osc=
IIf(oc=="RSI of MACD",A1,
IIf(oc=="RSI",B2,
IIf(oc=="CCI",C3,
IIf(oc=="StochK",D4,
IIf(oc=="StochD",E5,
IIf(oc=="Money Flow Index",F6,
IIf(oc=="Ultimate",G7,
IIf(oc=="ROC(Close)",H8,
IIf(oc=="Tom DeMark",I9,
IIf(oc=="ARSI",J10,
IIf(oc=="ProjOsc",K11,
IIf(oc=="DMI",L12,
IIf(oc=="StdevOsc",M13,N14))))))))))))); //  /*insert variable by Identifier*/
/*Value of Osc*/
Value1 = Osc;

Header=WriteIf(Osc==A1," RSI Of MACD",WriteIf(Osc==b2," RSI",WriteIf(Osc==C3," CCI",WriteIf(Osc==D4,"STOCHK",WriteIf(Osc==E5,"STOCHD",WriteIf(Osc==F6," MONEY FLOW INDEX",WriteIf(Osc==G7," ULTIMATE",WriteIf(Osc==H8," ROC(CLOSE)",WriteIf(Osc==I9," Tom DeMark",WriteIf(Osc==J10," ARSI",WriteIf(Osc==K11," ProjOsc",WriteIf(Osc==L12," DMI",WriteIf(Osc==M13," StdevOsc",WriteIf(Osc==N14," DeMarker",""))))))))))))));//DO HERE


Plot(Value1, Header,6,1+4); /*BLUE*/

//Plot( Osc, "+Osc+", colorBlack );
PlotOHLC( Osc,Osc,50,Osc, "", IIf( Osc > 50, colorRed, colorGreen ), styleCloud | styleClipMinMax|styleNoLabel, Os, Ob );
Buy = Cross (Osc, Os);
Sell = Cross (Ob, Osc);
PlotShapes(Buy*shapeUpArrow,colorGreen);
PlotShapes(Sell*shapeDownArrow,colorRed);
Plot(Os,"",colorAqua,1+4);
Plot(Ob,"",colorPink,1+4);
_SECTION_END();
_SECTION_BEGIN("SUPPORT/RESISTANCE");


SelectedIndicator = ParamList( "SUPPORT/RESISTANCE", "Trendlines_Wedge,fibo,STDDEVLNES", 0);


_SECTION_BEGIN("STDDEVLNES");
Daysback = Param("Period for Liner Regression Line",21,1,44000,1);
shift = Param("Look back period",0,0,240,1);
LRColor = ParamColor("LR Color", colorRed );
SDP = Param("Standard Deviation", 1.3, 0, 13, 0.1);
SDColor = ParamColor("SD Color", colorYellow );
SDP2 = Param("2d Standard Deviation", 2.1, 0, 13, 0.1);
SDColor2 = ParamColor("2 SD Color", colorBrightGreen );
SDP3 = Param("3d Standard Deviation", 3.4, 0, 13, 0.1);
SDColor3 = ParamColor("3 SD Color", colorRed );
_SECTION_END();


switch ( SelectedIndicator )
{

case "STDDEVLNES":
_SECTION_BEGIN("STDDEVLNES");

P = Value1;

//  =============================== Math Formula =============================================================

x = BarIndex();
lastx = LastValue( x ) - shift;
aa = LastValue( Ref(LinRegIntercept( p, Daysback), -shift) );
bb = LastValue( Ref(LinRegSlope( p, Daysback ), -shift) );
y = Aa + bb * ( x - (Lastx - DaysBack +1 ) );


// ==================Plot the Linear Regression Line ==========================================================


LRLine =  IIf( x > (lastx - Daysback) AND x < Lastx, y, Null );
Plot( LRLine , "LinReg", LRCOLOR, styleLine+4 ); //  styleDots );

// ==========================  Plot 1st SD Channel ===============================================================

SD = SDP/2;

width = LastValue( Ref(SD*StDev(p, Daysback),-shift) );   // THIS IS WHERE THE WIDTH OF THE CHANELS IS SET
SDU = IIf( x > (lastx - Daysback) AND x < Lastx, y+width , Null ) ;
SDL = IIf( x > (lastx - Daysback) AND x < Lastx, y-width , Null ) ;

Plot( SDU , "Upper Lin Reg", SDColor,styleLine );
Plot( SDL , "Lower Lin Reg", SDColor,styleLine );

//  ==========================  Plot 2d SD Channel ===============================================================

SD2 = SDP2/2;

width2 = LastValue( Ref(SD2*StDev(p, Daysback),-shift) );   // THIS IS WHERE THE WIDTH OF THE CHANELS IS SET
SDU2 = IIf( x > (lastx - Daysback) AND x < Lastx, y+width2 , Null ) ;
SDL2 = IIf( x > (lastx - Daysback) AND x < Lastx, y-width2 , Null ) ;

Plot( SDU2 , "Upper Lin Reg", SDColor2,styleLine );
Plot( SDL2 , "Lower Lin Reg", SDColor2,styleLine );


//  ==========================  Plot 3d SD Channel ===============================================================

SD3 = SDP3/2;

width3 = LastValue( Ref(SD3*StDev(p, Daysback),-shift) );   // THIS IS WHERE THE WIDTH OF THE CHANELS IS SET
SDU3 = IIf( x > (lastx - Daysback) AND x < Lastx, y+width3 , Null ) ;
SDL3 = IIf( x > (lastx - Daysback) AND x < Lastx, y-width3 , Null ) ;

Plot( SDU3 , "Upper Lin Reg", SDColor3,styleDashed+4 );
Plot( SDL3 , "Lower Lin Reg", SDColor3,styleDashed+4 );

_SECTION_END();

break;

case "Trendlines_Wedge":
_SECTION_BEGIN("Trendlines_Wedge");
G=0;// set G=1, 2, 3, ... to see previous Resistance trendlines
GG=0;// set G=1, 2, 3, ... to see previous Support trendlines
x = Cum(1);
per = 1;// sensitivity calibration
s1=Value1;s11=Value1;
pS = TroughBars( s1, per, 1 ) == 0;
endt= LastValue(ValueWhen( pS, x, 1+GG ));
startt=LastValue(ValueWhen( pS, x, 2+GG ));
dtS =endt-startt;
endS = LastValue(ValueWhen( pS, s1, 1+GG ) );
startS = LastValue( ValueWhen( pS, s1, 2+GG  ));
aS = (endS-startS)/dtS;
bS = endS;
trendlineS = aS * ( x  -endt ) + bS;// the Support trendline equation
Plot(IIf(x>startt-6 AND TRENDLINES>0 AND TRENDLINES<100,trendlineS,-1e10),"Support",IIf(as>0,5,4),8);
pR = PeakBars( s11, per, 1 ) == 0;
endt1= LastValue(ValueWhen( pR, x, 1+G ));
startt1=LastValue(ValueWhen( pR, x, 2+G ));
dtR =endt1-startt1;
endR = LastValue(ValueWhen( pR, s11, 1+G ) );
startR = LastValue( ValueWhen( pR, s11, 2 +G ));
aR = (endR-startR)/dtR;
bR = endR;
trendlineR = aR * ( x  -endt1 ) + bR;// the Resistance trendline equation
Plot(IIf(x>startT1-6  AND TRENDLINER>0 AND TRENDLINER<100,trendlineR,-1e10),"Resistance",IIf(Ar>0,5,4),8);
Ascwedge=Ar>0.5  AND As>sqrt(2)*Ar AND trendlineR>trendlineS;
Descwedge= As<-0.5 AND As>Ar/sqrt(2) AND trendlineR>trendlineS;
_SECTION_END();
break;

case "fibo":
_SECTION_BEGIN("fibo");
barvisible = Status("barvisible");
r = Value1;
maxr = LastValue( Highest( IIf( barvisible, r, 0 ) ) );
minr = LastValue( Lowest( IIf( barvisible, r, 100 ) ) );
ranr = maxr - minr;
Plot( maxr , "0%", colorGrey50,styleDashed );
Plot( maxr - 0.236 * ranr, "-23.6%", colorViolet,styleDashed+4 );
Plot( maxr - 0.382 * ranr, "-38.2%", colorYellow,styleDashed );
Plot( maxr - 0.50 * ranr, "-50.0%", colorOrange,styleDashed,styleDashed );
Plot( maxr - 0.618 * ranr, "-61.8%", colorViolet,styleDashed+4 );
Plot( minr , "-100%", colorGrey50,styleDashed );
GraphXSpace = 3;
_SECTION_END();

break;
}

_SECTION_END();
6 comments
Leave Comment
Please login here to leave a comment.
From the one hand is nothing new, from the other very nice. Good work.
ARSI code section had error & caused no plot.
Suggest the following changes:
UpMove = AMA, Nz(1/UpCount) );
DnMove = AMA, Nz(1/DnCount) );
Source: http://www.traders.com/Documentation/FEEDbk_docs/2010/10/TradersTips.html
ARSI = Asymmetrical RSI
I found the ARSI plots to be better than normal RSI.
Hi,
How do I get the indicator into my platform?
Thanks.
Use the ‘Copy & Paste Friendly’ link just above the code.
looking to the future is very dangerous
nice thank uuu