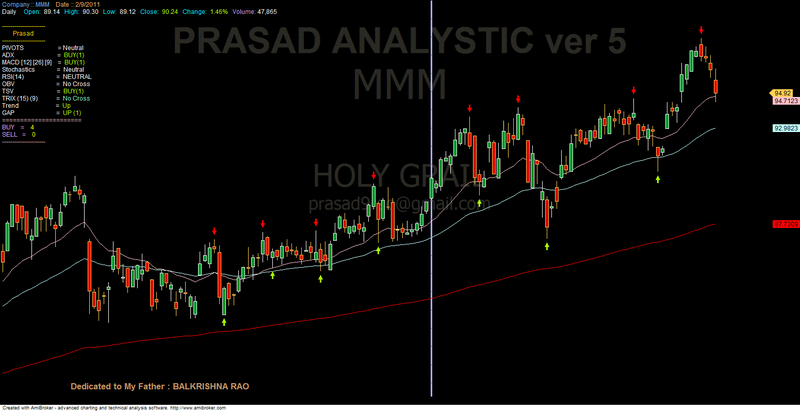
HOLY GRAIL for Amibroker (AFL)
prasadbrao about 14 years ago Amibroker (AFL)
After lots of requests I received I put it here the 5th version of my programme HOLY GRAIL …
I am still refining it in its further 8th version.
Screenshots
Indicator / Formula
Copy & Paste Friendly
_SECTION_BEGIN("PRASAD SYSTEMS");
Param("DEDICATED TO MY FATHER",5);
_SECTION_END();

_SECTION_BEGIN("BACK COLR");
SetChartBkColor( ParamColor("Chart Color", colorBlack));
SetChartOptions(0,chartShowArrows|chartShowDates);
GfxSetOverlayMode(1);
GfxSelectFont("Tahoma", Status("pxheight")/13 );
GfxSetTextAlign( 6 );// center alignment
GfxSetTextColor( ParamColor("Text Color", ColorHSB( 42, 42, 42 ) ));
GfxSetBkMode(0); // transparent
GfxTextOut( Name(), Status("pxwidth")/2, Status("pxheight")/7);

GfxSelectFont("Tahoma", Status("pxheight")/17 );
GfxTextOut( "HOLY GRAIL", Status("pxwidth")/2, Status("pxheight")/2.6 );

GfxSelectFont("Tahoma", Status("pxheight")/30 );
GfxTextOut( "prasad9rao@gmail.com", Status("pxwidth")/2, Status("pxheight")/2.1);

GfxSelectFont("Arial Bold", Status("pxheight")/15);
GfxTextOut( "PRASAD ANALYSTIC ver 5", Status("pxwidth")/2, Status("pxheight")/20);
_SECTION_END();

GfxSetTextColor(ColorRGB(200, 150, 100) );
GfxSelectFont("Arial BOLD", Status("pxheight")/60);
 GfxTextOut( "Dedicated to My Father : BALKRISHNA RAO",Status("pxwidth")/5, Status("pxheight")/1.06);

SetBarFillColor( IIf(O>C,ColorRGB(217,0,0),ColorRGB(1,149,38)) );
Plot( C, "Price", IIf( O>C,ColorRGB(255,208,82), ColorRGB(255,255,255)), styleCandle );

/******************FIXED TITLES**************/
Chg=Ref(C,-1);
Title = EncodeColor(colorYellow)+ "Company :: " +Title = Name() + "    " + EncodeColor(colorLightOrange) + "Date :: "  + Date() +EncodeColor(11) + EncodeColor(colorWhite) + "\n{{INTERVAL}}  " +
   EncodeColor(55)+ "   Open:  "+ EncodeColor(colorWhite)+ WriteVal(O,format=1.2) +
   EncodeColor(55)+ "   High:  "+ EncodeColor(colorWhite) + WriteVal(H,format=1.2) +
   EncodeColor(55)+ "   Low:  "+ EncodeColor(colorWhite)+ WriteVal(L,format=1.2) +
   EncodeColor(55)+ "   Close:  "+ WriteIf(C> Chg,EncodeColor(colorBrightGreen),EncodeColor(colorRed))+ WriteVal(C,format=1.2)+
   EncodeColor(55)+ "   Change:  "+ WriteIf(C> Chg,EncodeColor(colorBrightGreen),EncodeColor(colorRed))+ WriteVal(ROC(C,1),format=1.2)+ "%"+
   EncodeColor(55)+ "   Volume: "+ EncodeColor(colorWhite)+ WriteVal(V,1);


/************************************************************
             SUPPORTS & RESISTANCE
*************************************************************/

HaClose =EMA((O+H+L+C)/4,3);
HaOpen = AMA( Ref( HaClose, -1 ), 0.5 );
HaHigh = Max( H, Max( HaClose, HaOpen ) );
HaLow = Min( L, Min( HaClose, HaOpen ) );


_SECTION_BEGIN("Support and Resistance");

supres=ParamToggle("Display(ON - OFF)","Off|On",0);
if(supres)
{


Prd1=Param("Resistance Period",2,0,200,1);

test   = TEMA  ( High , Prd1 ) ;

PK = test > Ref(test,-1) AND Ref(test,1) < High;//Peak
PKV0 = ValueWhen(PK,haHigh,0);//PeakValue0
PKV1 = ValueWhen(PK,haHigh,1);//PeakValue1
PKV2 = ValueWhen(PK,haHigh,2);//PeakValue2

MPK = PKV2 < PKV1 AND PKV1 > PKV0 ;//MajorPeak

MPKV = ValueWhen(Ref(MPK,-1) == 0 AND MPK == 1, PKV1,1); //MajorPeakValue
MPKD = ValueWhen(Ref(MPK,-1) == 0 AND MPK == 1, DateNum(),1); //MajorPeakDate
SD = IIf(DateNum() < LastValue(MPKD,lastmode = True ), Null, LastValue(MPKV,Lastmode = True));//SelectedDate
Plot(SD, "Resist1",   colorDarkRed,styleDots|styleDashed|styleThick|styleNoTitle,maskAll);


MPKV2 = ValueWhen(Ref(MPK,-1) == 0 AND MPK == 1, PKV1,2); //MajorPeakValue
MPKD2 = ValueWhen(Ref(MPK,-1) == 0 AND MPK == 1, DateNum(),2); //MajorPeakDate
SD2 = IIf(DateNum() < LastValue(MPKD2,lastmode = True ), Null, LastValue(MPKV2,Lastmode = True));//SelectedDate
Plot(SD2, "Resist2",   colorDarkRed,styleDots|styleDashed|styleThick|styleNoTitle,maskAll);


MPKV3 = ValueWhen(Ref(MPK,-1) == 0 AND MPK == 1, PKV1,3); //MajorPeakValue
MPKD3 = ValueWhen(Ref(MPK,-1) == 0 AND MPK == 1, DateNum(),3); //MajorPeakDate
SD3 = IIf(DateNum() < LastValue(MPKD3,lastmode = True ), Null, LastValue(MPKV3,Lastmode = True));//SelectedDate
Plot(SD3, "Resist3",  colorDarkRed,styleDots|styleDashed|styleThick|styleNoTitle,maskAll);


MPKV4 = ValueWhen(Ref(MPK,-1) == 0 AND MPK == 1, PKV1,4); //MajorPeakValue
MPKD4 = ValueWhen(Ref(MPK,-1) == 0 AND MPK == 1, DateNum(),4); //MajorPeakDate
SD4 = IIf(DateNum() < LastValue(MPKD4,lastmode = True ), Null, LastValue(MPKV4,Lastmode = True));//SelectedDate
Plot(SD4, "Resist4",   colorDarkRed,styleDots|styleDashed|styleThick|styleNoTitle,maskAll);


MPKV5 = ValueWhen(Ref(MPK,-1) == 0 AND MPK == 1, PKV1,5); //MajorPeakValue
MPKD5 = ValueWhen(Ref(MPK,-1) == 0 AND MPK == 1, DateNum(),5); //MajorPeakDate
SD5 = IIf(DateNum() < LastValue(MPKD5,lastmode = True ), Null, LastValue(MPKV5,Lastmode = True));//SelectedDate
Plot(SD5, "Resist5",   colorDarkRed,styleDots|styleDashed|styleThick|styleNoTitle,maskAll);


MPKV6 = ValueWhen(Ref(MPK,-1) == 0 AND MPK == 1, PKV1,6); //MajorPeakValue
MPKD6 = ValueWhen(Ref(MPK,-1) == 0 AND MPK == 1, DateNum(),6); //MajorPeakDate
SD6 = IIf(DateNum() < LastValue(MPKD6,lastmode = True ), Null, LastValue(MPKV6,Lastmode = True));//SelectedDate
Plot(SD6, "Resist6", colorDarkRed,styleDots|styleDashed|styleThick|styleNoTitle,maskAll);


//SP=L > Ref(L,-1) AND Ref(L,1) < L;//Peak

Prd2=Param("Suppport Period",2,0,200,1);

test2   = TEMA ( Low , Prd2 ) ;

SP = Ref(test2,1) > Low AND test2 < Ref(test2,-1);//Peak
SPV0 = ValueWhen(SP,haLow,0);//PeakValue0
SPV1 = ValueWhen(SP,haLow,1);//PeakValue1
SPV2 = ValueWhen(SP,haLow,2);//PeakValue2

//PKV5 = ValueWhen(PK,haHigh,5);//PeakValue5
//PKV6 = ValueWhen(PK,haHigh,6);//PeakValue6

MSP = SPV2 > SPV1 AND SPV1 < SPV0 ;//MajorPeak

MSPV = ValueWhen(Ref(MSP,-1) == 0 AND MSP == 1, SPV1,1);
MSPD = ValueWhen(Ref(MSP,-1) == 0 AND MSP == 1, DateNum(),1);
SD = IIf(DateNum() < LastValue(MSPD,lastmode = True ), Null, LastValue(MSPV,Lastmode = True));
Plot(SD,"Support1",  colorYellow,styleDots|styleDashed|styleThick|styleNoTitle,maskAll);


MSPV2 = ValueWhen(Ref(MSP,-1) == 0 AND MSP == 1, SPV1,2);
MSPD2 = ValueWhen(Ref(MSP,-1) == 0 AND MSP == 1, DateNum(),2);
SD2 = IIf(DateNum() < LastValue(MSPD2,lastmode = True ), Null, LastValue(MSPV2,Lastmode = True));
Plot(SD2,"Support2",  colorYellow,styleDots|styleDashed|styleThick|styleNoTitle,maskAll);


MSPV3 = ValueWhen(Ref(MSP,-1) == 0 AND MSP == 1, SPV1,3);
MSPD3 = ValueWhen(Ref(MSP,-1) == 0 AND MSP == 1, DateNum(),3);
SD3 = IIf(DateNum() < LastValue(MSPD3,lastmode = True ), Null, LastValue(MSPV3,Lastmode = True));
Plot(SD3,"Support3", colorYellow,styleDots|styleDashed|styleThick|styleNoTitle,maskAll);


MSPV4 = ValueWhen(Ref(MSP,-1) == 0 AND MSP == 1, SPV1,4);
MSPD4 = ValueWhen(Ref(MSP,-1) == 0 AND MSP == 1, DateNum(),4);
SD4 = IIf(DateNum() < LastValue(MSPD4,lastmode = True ), Null, LastValue(MSPV4,Lastmode = True));
Plot(SD4,"Support4",  colorYellow,styleDots|styleDashed|styleThick|styleNoTitle,maskAll);


MSPV5 = ValueWhen(Ref(MSP,-1) == 0 AND MSP == 1, SPV1,5);
MSPD5 = ValueWhen(Ref(MSP,-1) == 0 AND MSP == 1, DateNum(),5);
SD5 = IIf(DateNum() < LastValue(MSPD5,lastmode = True ), Null, LastValue(MSPV5,Lastmode = True));
Plot(SD5,"Support5",  colorYellow,styleDots|styleDashed|styleThick|styleNoTitle,maskAll);


MSPV6 = ValueWhen(Ref(MSP,-1) == 0 AND MSP == 1, SPV1,6);
MSPD6 = ValueWhen(Ref(MSP,-1) == 0 AND MSP == 1, DateNum(),6);
SD6 = IIf(DateNum() < LastValue(MSPD6,lastmode = True ), Null, LastValue(MSPV6,Lastmode = True));
Plot(SD6,"Support6", colorYellow,styleDots|styleDashed|styleThick|styleNoTitle,maskAll);


}

_SECTION_END();


  /* **********************************
PIVOTS
********************************** */


_SECTION_BEGIN("PIVOT Average ");
P = ParamField("Field");
Type = ParamList("Type", "Weighted,Lagless-21,Hull-26,Linear Regression-45,Exponential,Double Exponential,Tripple Exponential,Wilders,Simple");
Periods = Param("Periods", 9, 2, 100 );
Displacement = Param("Displacement", 1, -50, 50 );
m = 0;

if( Type == "Weighted" ) 				m=  WMA( P, Periods );
if( Type == "Lagless-21"  )				m=  2*EMA(P, Periods)-EMA(EMA(P, Periods), Periods);
if( Type == "Hull-26"  )				m=  WMA(2*(WMA(P, Periods/2))-WMA(P, Periods) ,4 );
if( Type == "Linear Regression-45"  ) m=  LinearReg( P, Periods );
if( Type == "Exponential" ) 			m = EMA( P, Periods );
if( Type == "Double Exponential" ) 	m = DEMA( P, Periods );
if( Type == "Tripple Exponential" ) 	m = TEMA( P, Periods );
if( Type == "Wilders" ) 				m = Wilders( P, Periods );
if( Type == "Simple" ) 					m = MA( P, Periods );


_SECTION_BEGIN("Pivot Finder");

  /* **********************************

Code to automatically identify pivots

********************************** */

// -- what will be our lookback range for the hh and ll?
farback=Param("How Far back to go",100,50,5000,10);
nBars = Param("Number of bars", 12, 5, 40);


"BIdxJJJ = " + BarIndex() +

"\n" + "OGGGGGGGGGGG = " + O + "\n"+"H = "+ H + "\n"+"L = " + L

+ "\n"+"C " ;

GraphXSpace=7;

// -- Create 0-initialized arrays the size of barcount

aHPivs = H - H;

aLPivs = L - L;

// -- More for future use, not necessary for basic plotting

aHPivHighs = H - H;

aLPivLows = L - L;

aHPivIdxs = H - H;

aLPivIdxs = L - L;

nHPivs = 0;

nLPivs = 0;

lastHPIdx = 0;

lastLPIdx = 0;

lastHPH = 0;

lastLPL = 0;

curPivBarIdx = 0;

aHHVBars = HHVBars(H, nBars);

aLLVBars = LLVBars(L, nBars);

aHHV = HHV(H, nBars);

aLLV = LLV(L, nBars);

aVisBars = Status("barvisible");

nLastVisBar = LastValue(Highest(IIf(aVisBars, BarIndex(), 0)));

_TRACE("Last visible bar: " + nLastVisBar);

// -- Initialize value of curTrend

curBar = (BarCount-1);

curTrend = "";

if (aLLVBars[curBar] <

aHHVBars[curBar]) {

curTrend = "D";

}

else {

curTrend = "U";

}


if (BarCount > farback)
{
for (i=0; i<farback; i++) {

curBar = (BarCount - 1) - i;

// -- Have we identified a pivot? If trend is down...

if (aLLVBars[curBar] < aHHVBars[curBar]) {

// ... and had been up, this is a trend change

if (curTrend == "U") {

curTrend = "D";

// -- Capture pivot information

curPivBarIdx = curBar - aLLVBars[curBar];

aLPivs[curPivBarIdx] = 1;

aLPivLows[nLPivs] = L[curPivBarIdx];

aLPivIdxs[nLPivs] = curPivBarIdx;

nLPivs++;

}

// -- or current trend is up

} else {

if (curTrend == "D") {

curTrend = "U";

curPivBarIdx = curBar - aHHVBars[curBar];

aHPivs[curPivBarIdx] = 1;

aHPivHighs[nHPivs] = H[curPivBarIdx];

aHPivIdxs[nHPivs] = curPivBarIdx;

nHPivs++;

}

// -- If curTrend is up...else...

}

// -- loop through bars

}
}


curBar = (BarCount-1);

candIdx = 0;

candPrc = 0;

lastLPIdx = aLPivIdxs[0];

lastLPL = aLPivLows[0];

lastHPIdx = aHPivIdxs[0];

lastHPH = aHPivHighs[0];

if (lastLPIdx > lastHPIdx) {

// -- Bar and price info for candidate pivot

candIdx = curBar - aHHVBars[curBar];

candPrc = aHHV[curBar];

if (

lastHPH < candPrc AND

candIdx > lastLPIdx AND

candIdx < curBar) {


// -- OK, we'll add this as a pivot...

aHPivs[candIdx] = 1;

// ...and then rearrange elements in the

// pivot information arrays

for (j=0; j<nHPivs; j++) {

aHPivHighs[nHPivs-j] = aHPivHighs[nHPivs-

(j+1)];

aHPivIdxs[nHPivs-j] = aHPivIdxs[nHPivs-(j+1)];

}

aHPivHighs[0] = candPrc ;

aHPivIdxs[0] = candIdx;

nHPivs++;

}

} else {


// -- Bar and price info for candidate pivot

candIdx = curBar - aLLVBars[curBar];

candPrc = aLLV[curBar];

if (

lastLPL > candPrc AND

candIdx > lastHPIdx AND

candIdx < curBar) {


// -- OK, we'll add this as a pivot...

aLPivs[candIdx] = 1;


for (j=0; j<nLPivs; j++) {

aLPivLows[nLPivs-j] = aLPivLows[nLPivs-(j+1)];

aLPivIdxs[nLPivs-j] = aLPivIdxs[nLPivs-(j+1)];

}

aLPivLows[0] = candPrc;

aLPivIdxs[0] = candIdx;

nLPivs++;

}

}


PlotShapes(

IIf(aHPivs==1,shapeDownArrow, shapeNone), colorRed, 0,High, Offset=-15);

PlotShapes(IIf(aLPivs==1,shapeUpArrow , shapeNone), ColorRGB(168,255,0), 0, Low, Offset=-15);


printf("\n Buuuy pivotss %g", aLPivs);
printf("\n Seel pivotss %g \n",aHPivs);


IIf( (aHPivs==1 AND aLPivs==0),PIVOT_SELL = 5, PIVOT_SELL = 0 );

IIf( aLPivs==1 AND aHPivs==0, PIVOT_BUY = 0, PIVOT_BUY = 5 );

PIVOT_BUY  = IIf(aLPivs==1, 5, 0);
PIVOT_SELL = IIf(aHPivs==1, 5, 0);


printf("\n Buuuy pivotss %g", PIVOT_BUY);
printf("\n Seel pivotss %g \n",PIVOT_SELL);


PIVOT_status = WriteIf(PIVOT_BUY,"Buy["+PIVOT_BUY+"]",WriteIf(PIVOT_SELL,"Sell["+PIVOT_SELL+"]","NA"));
PIVOT_col = IIf (PIVOT_BUY,colorGreen, IIf (PIVOT_SELL,colorRed,colorLightGrey));


_SECTION_END();


/************************************************************
              VOLUMES INCLUDED IN CHART
*************************************************************/
_SECTION_BEGIN("Volume");
VOLUME_TOGGLE = ParamToggle("Plot Volume","Off|On",0);
minimum = LastValue( Lowest( Volume ) );
maximum = LastValue( Highest( Volume ) )*10;


Period = Param("Period", 10, 2, 300, 1, 10 );
Volumeclimaxup = colorRed;
HighVolumeChurnbars = colorLime;
Lowvolumebars = colorYellow;
Volumeclimaxdn = colorWhite;
ClimaxChurnColor=colorBlue;

Value1 = V;
Value2 = V*(H-L);
Value3 = V/(H-L);

SetBarFillColor(IIf( (Value2 == HHV(Value2,Period)),ColorRGB(255,0,0),
IIf( (Value3 == HHV(Value3,Period)), ColorRGB(0, 142,0),
IIf( (Value1 == LLV(Value1,Period)), ColorRGB(255,255,0),
IIf( ((Value2 == HHV(Value2,Period) AND (Value3 == HHV(Value3,Period)))), ClimaxChurnColor,
IIf( (Value3 == LLV(Value3,Period)), Volumeclimaxdn, ColorRGB(0, 206, 255 )))))));


BarColor = IIf( (Value2 == HHV(Value2,Period)),ColorRGB(255,0,0),
IIf( (Value3 == HHV(Value3,Period)),ColorRGB(0, 142,0),
IIf( (Value1 == LLV(Value1,Period)), ColorRGB(255,255,0),
IIf( ((Value2 == HHV(Value2,Period) AND (Value3 == HHV(Value3,Period)))), ClimaxChurnColor,
IIf( (Value3 == LLV(Value3,Period)), Volumeclimaxdn,  ColorRGB(0, 206, 255))))));
if(VOLUME_TOGGLE==1)
{

Plot( Volume, "Volume", Barcolor, styleCandle | styleThick | styleOwnScale, minimum, maximum);
_SECTION_END();

}


/************************************************************
              EMA 21 50 crossover
*************************************************************/
_SECTION_BEGIN("EMA");
EMA_TOGGLE = ParamToggle("Plot EMA","Off|On",1);

LOW_EMA= Param("Lower EMA",21,21,49,1);
L_EMA = EMA(C,LOW_EMA);
HIGH_EMA= Param("Higher EMA",50,50,199,1);
H_EMA = EMA(C,HIGH_EMA);
HIGHEST_EMA= Param("Highest EMA",200,200,365,1);
HT_EMA = EMA(C,HIGHEST_EMA);

if(EMA_TOGGLE==1)
{
Plot( EMA( C, LOW_EMA), _DEFAULT_NAME(), ParamColor("Lower EMA Color", colorPink ), ParamStyle("Style") );
Plot( EMA( C, HIGH_EMA), _DEFAULT_NAME(), ParamColor("Higher EMA Color", colorSkyblue), ParamStyle("Style") );
Plot( EMA( C, HIGHEST_EMA), _DEFAULT_NAME(), ParamColor("Highest EMA Color", colorRed ), ParamStyle("Style") );

}

_SECTION_END();


/**********************************************************
 /ADX
***********************************************************/

range = Param("Range",14,3,60,1);

px = PDI(range);
nx = MDI(range);
ax = ADX(range);

Line_Control = 20;

up_adx = Ref(ADX(range),-1) < ADX(range);
dw_adx = Ref(ADX(range),-1) > ADX(range);


// ADX Trends
Notrend = ADX(range) < 20;

ModerateTrend =  ADX(range) >= 20 AND ADX(range) < 40 AND up_adx ;

StrongTrend =  ADX(range) >= 40 AND ADX(range) < 60 AND up_adx ;

VeryStrongTrend =  ADX(range) >= 60 AND ADX(range) < 80 AND up_adx ;

ExtremelyStrongTrend =  ADX(range) >= 80 AND up_adx ;


// Buy Conditions

bcon1 = Cross(px,ax) AND nx < px AND  ax > Ref(ax,-1);
scon1 = Cross(nx,ax) AND px < nx AND ax > Ref(ax,-1);

adbuy = ax < 20 AND ax > Ref(ax,-1) AND ( Cross(px,nx) OR nx < px) ;
adsell = ax < 20 AND ax > Ref(ax,-1) AND ( Cross(nx,px) OR nx > px) ;

adbuy1 = Cross(px,ax) AND nx < px AND  ax > Ref(ax,-1) AND px > ax;
adsell1 = Cross(nx,ax) AND nx > px AND  ax > Ref(ax,-1) AND nx > ax;

BUY_ADX = bcon1 + adbuy + adbuy1;
SELL_ADX =  scon1 + adsell + adsell1;


ADX_status = WriteIf(BUY_ADX,"Buy["+BUY_ADX+"]",WriteIf(SELL_ADX,"Sell["+SELL_ADX+"]","NA"));
ADX_col = IIf (BUY_ADX,colorGreen, IIf (SELL_ADX,colorRed,colorLightGrey));


/**********************************************************
 /MACD Cross
***********************************************************/
_SECTION_BEGIN("MACD");
MACD_TOGGLE = ParamToggle("Plot MACD","Off|On",0);

r1 = Param( "Fast avg", 12, 2, 200, 1 );
r2 = Param( "Slow avg", 26, 2, 200, 1 );
r3 = Param( "Signal avg", 9, 2, 200, 1 );

m1 = MACD(r1, r2);
s1 = Signal(r1,r2,r3);
difference = m1-s1;


mycolor=IIf(m1<0 AND m1>s1,51,IIf(m1>0 AND m1>s1,colorBrightGreen,IIf(m1>0 AND m1<s1,colorLightOrange,colorRed)));

// **********************
//MACD crossing zero

B_MACD_0 =  Cross(MACD(r1, r2),0);


S_MACD_0 =  Cross(0,MACD(r1, r2));


// **********************
//Bullish - Bearish MACD crossing signal above zero or below zero plane


BULL_CROSS_ABOVE_ZERO = Cross (MACD(r1, r2),Signal(r1,r2,r3)) AND MACD(r1, r2) > 0;


BEAR_CROSS_ABOVE_ZERO = Cross (Signal(r1,r2,r3),MACD(r1, r2)) AND MACD(r1, r2) > 0;


// **********************
//bELOW ZERO Bullish - Bearish MACD crossing signal above zero or below zero plane

BULL_CROSS_BELOW_ZERO  = Cross (MACD(r1, r2),Signal(r1,r2,r3)) AND MACD(r1, r2)<0;


BEAR_CROSS_BELOW_ZERO  = Cross(Signal(r1,r2,r3),MACD(r1, r2)) AND MACD(r1, r2)<0;


// **********************
//Zero line reject ZLR


BEAR_ZLR = BarsSince(B_MACD_0);
BEAR_ZLR1 = (BEAR_ZLR < 6) AND (S_MACD_0);


BULL_ZLR = BarsSince(S_MACD_0);
BULL_ZLR1 = (BULL_ZLR < 6) AND (B_MACD_0);


// **********************
//HOOKS

BULL_HOOK1 = BarsSince(BEAR_CROSS_ABOVE_ZERO);
BULL_HOOK = (BULL_HOOK1<6) AND BULL_CROSS_ABOVE_ZERO ;


BEAR_HOOK1 = BarsSince(BULL_CROSS_ABOVE_ZERO);
BEAR_HOOK = (BEAR_HOOK1<6) AND BEAR_CROSS_ABOVE_ZERO ;


BUY_MACD = B_MACD_0 + BULL_CROSS_ABOVE_ZERO + BULL_CROSS_BELOW_ZERO + BULL_ZLR1 + BULL_HOOK;
SELL_MACD = S_MACD_0 + BEAR_CROSS_ABOVE_ZERO + BEAR_CROSS_BELOW_ZERO + BEAR_ZLR1 + BEAR_HOOK;

/*
if(MACD_TOGGLE==1)
{
GraphX = 5;
Plot( m1, StrFormat(_SECTION_NAME()+"(%g,%g)", r1, r2), ParamColor("MACD color", colorRed ),ParamStyle("MACD style") );
Plot( s1 ,"Signal" + _PARAM_VALUES(), ParamColor("Signal color", colorBlueGrey ), ParamStyle("Signal style") );

Color =IIf(difference > 0,colorLime,colorRed);

Plot(m1-s1, "MACD Histogram", mycolor, styleHistogram | styleThick | styleNoLabel, styleOwnScale);

PlotShapes(IIf(B_MACD_0,shapeDigit1 ,Null),colorYellow,0,Min(0,0),Min(0,0));
PlotShapes(IIf(B_MACD_0,shapeUpArrow,Null),colorGreen,0,Min(0,0),-20);

PlotShapes(IIf(S_MACD_0,shapeDigit2 ,Null),colorOrange,0,Min(0,0),0);
PlotShapes(IIf(S_MACD_0,shapeDownArrow,Null),colorRed,0,Min(0,0),-20);

PlotShapes(IIf(BULL_CROSS_ABOVE_ZERO,shapeDigit3 ,Null),colorYellow,0,Min(0,0),Min(0,0));
PlotShapes(IIf(BULL_CROSS_ABOVE_ZERO,shapeUpArrow,Null),colorGreen,0,Min(0,0),-20);

PlotShapes(IIf(BEAR_CROSS_ABOVE_ZERO ,shapeDigit4 ,Null),colorOrange,0,Min(0,0),Min(0,0));
PlotShapes(IIf(BEAR_CROSS_ABOVE_ZERO ,shapeDownArrow,Null),colorRed,0,Min(0,0),-20);

PlotShapes(IIf(BULL_CROSS_BELOW_ZERO,shapeDigit5 ,Null),colorYellow,0,Min(0,0),Min(0,0));
PlotShapes(IIf(BULL_CROSS_BELOW_ZERO,shapeUpArrow,Null),colorGreen,0,Min(0,0),-20);

PlotShapes(IIf(BEAR_CROSS_BELOW_ZERO,shapeDigit6 ,Null),colorOrange,0,Min(0,0),Min(0,0));
PlotShapes(IIf(BEAR_CROSS_BELOW_ZERO,shapeDownArrow,Null),colorRed,0,Min(0,0),-20);

PlotShapes(IIf(BEAR_ZLR1,shapeStar+shapePositionAbove,shapeNone),colorRed,0,0,-30);
PlotShapes(IIf(BULL_ZLR1,shapeStar+shapePositionAbove,shapeNone),colorGold,0,0,30);

PlotShapes(IIf(BULL_HOOK,shapeStar+shapePositionAbove,shapeNone),colorGold,0,0,30);
PlotShapes(IIf(BEAR_HOOK,shapeStar+shapePositionAbove,shapeNone),colorRed,0,0,-30);
}
*/
_SECTION_END();

BUY_MACD = B_MACD_0 + BULL_CROSS_ABOVE_ZERO + BULL_CROSS_BELOW_ZERO + BULL_ZLR1 + BULL_HOOK ;
SELL_MACD = S_MACD_0 + BEAR_CROSS_ABOVE_ZERO + BEAR_CROSS_BELOW_ZERO + BEAR_ZLR1 + BEAR_HOOK ;

MACD_status = WriteIf(BUY_MACD,"Buy["+BUY_MACD+"]",WriteIf(SELL_MACD,"Sell["+SELL_MACD+"]","NA"));
MACD_col = IIf (BUY_MACD,colorGreen, IIf (SELL_MACD,colorRed,colorLightGrey));


/**************************************************
                Stochastics
***************************************************/
_SECTION_BEGIN("STOCHASTICS");
STOC_TOGGLE = ParamToggle("Plot STOCHASTICS","Off|On",0);


SP = Param( "Periods", 10, 1, 200, 1 );
Ksmooth = Param( "%K avg", 5, 1, 200, 1 );
Dsmooth = Param( "%D avg", 5, 1, 200, 1 );
StochDval = StochD( SP , Ksmooth, DSmooth );
StochKval = StochK( SP , Ksmooth);

Overbought = 80;
Oversold = 20;

/*
if(STOC_TOGGLE==1)
{
GraphX = 5;
Plot( StochD( SP , Ksmooth, DSmooth), _DEFAULT_NAME(), ParamColor( "ColorD", colorTurquoise ), ParamStyle("Style") );
Plot( StochK( SP , Ksmooth), _DEFAULT_NAME(), ParamColor( "ColorK", colorPaleGreen ), ParamStyle("Style") );

Plot(Overbought,"Overbought Level",colorRed);
Plot(Oversold,"Oversold Level",colorGreen);
}
*/

StochBuy = Cross(StochK(SP,Ksmooth), StochD(SP,Ksmooth, DSmooth)) AND
(StochD(SP,Ksmooth, DSmooth) > 20) AND (StochK(SP,Ksmooth) > 20) AND
(StochD(SP,Ksmooth, DSmooth) < 80) AND (StochK(SP,Ksmooth) < 80);

StochSell = Cross (StochD(SP,Ksmooth, DSmooth), StochK(SP,Ksmooth)) AND
(StochD(SP,Ksmooth, DSmooth) > 20) AND (StochK(SP,Ksmooth) > 20) AND
(StochD(SP,Ksmooth, DSmooth) < 80) AND (StochK(SP,Ksmooth) < 80);

StochStrongBuy = Cross(StochK(SP,Ksmooth),StochD(SP,Ksmooth, DSmooth)) AND
(StochD(SP,Ksmooth, DSmooth) < 20) AND (StochK(SP,Ksmooth) < 20) ;

StochStrongSell = Cross (StochD(SP,Ksmooth,DSmooth), StochK(SP , Ksmooth));
(StochD(SP,Ksmooth, DSmooth) > 80) AND (StochK(SP,Ksmooth) > 80);


BUY_STOCH = StochBuy + StochStrongBuy;
SELL_STOCH = StochSell + StochStrongSell;
printf("sto %g",BUY_STOCH);

_SECTION_END();

STOCH_status = WriteIf(BUY_STOCH,"Buy["+BUY_STOCH+"]",WriteIf(SELL_STOCH,"Sell["+SELL_STOCH+"]","NA"));
STOCH_col = IIf (BUY_STOCH,colorGreen, IIf (SELL_STOCH,colorRed,colorLightGrey));


/**************************************************
                TREND DETECTOR
***************************************************/

_SECTION_BEGIN("Trend Detector");
TREND_TOGGLE = ParamToggle("Plot Trend","Off|On",0);
A = (H+C+L)/3;
B=MA(A,5)-EMA(A,34);
D = EMA(A,34)-MA(A,5);
Bcolor=IIf(B>D,25,39);
Dcolor=IIf(D<B,25,39);
Up = B > D;
down = B < D;
TREND_B = Cross(B,D);
TREND_S = Cross(D,B);
if(TREND_TOGGLE==1)
{
Plot(B,"B ",Bcolor,styleLine|styleThick);
Plot(D,"D ",Dcolor,styleLine|styleThick);
Plot(B,"",Bcolor,styleHistogram|styleThick);
Plot(D,"",Dcolor,styleHistogram|styleThick);
Plot(0,"",colorWhite,styleLine);
PlotShapes(IIf(TREND_S, shapeHollowDownArrow , shapeNone), colorRed,0,0,-8);
PlotShapes(IIf(TREND_B, shapeHollowUpArrow , shapeNone), colorGreen,0,0,-8);

}

_SECTION_END();
TREND_status = WriteIf(TREND_B,"Buy",WriteIf(TREND_S ,"Sell","NA"));
TREND_col = IIf (TREND_B,colorGreen, IIf (TREND_S ,colorRed,colorLightGrey));


/**************************************************
               RSI
***************************************************/
_SECTION_BEGIN("RSI");


Rperiods = Param( "Periods", 14, 1, 200, 1 );
OB = Param("OverBrought Line",70,70,100,1);
OS = Param("OverSold Line",30,20,40,1);
CentreRSI = 50;
Overbought = OB;
Oversold = OS;

RSI_PERIODS = Prec(RSI( Rperiods),1);


//******* RSI Cross 30 or 70**//

B_RSI = RSI_CROSS_30 = Cross(RSI_PERIODS,OS);

S_RSI = RSI_CROSS_70 = Cross(OB,RSI_PERIODS);


//******* RSI < 30 or > 70**//

RSI_BELOW_30 = RSI_PERIODS < OS ;

RSI_ABOVE_70 = RSI_PERIODS > OB ;


//******* RSI > OR < IN LAST 14 DAYS***//

RSI_14_GREATEST = RSI_PERIODS>=HHV( RSI_PERIODS, 14);

RSI_14_LOWEST = RSI_PERIODS<=LLV( RSI_PERIODS, 14);


//******* RSI DIVERGENCE***//

RSI_BEAR_DIV = Close >= HHV( Close, 14 ) AND RSI_PERIODS < HHV( RSI_PERIODS, 14 );

RSI_BULL_DIV = RSI_PERIODS >= HHV( RSI_PERIODS, 14 ) AND Close < HHV( Close, 14 );

RSI_BULL_DIV1 = Close <= LLV( Close, 14 ) AND RSI_PERIODS > LLV(RSI_PERIODS, 14 );

RSI_BEAR_DIV1 = RSI_PERIODS <= LLV( RSI_PERIODS, 14) AND Close > LLV(Close,14);
/*****/////////


RSI_BUY = B_RSI ;
RSI_SELL =S_RSI ;


_SECTION_END();
RSI_status = WriteIf(RSI_BUY,"Buy["+RSI_BUY+"]",WriteIf(RSI_SELL,"Sell["+RSI_SELL+"]","NA"));
RSI_col = IIf (RSI_BUY,colorGreen, IIf (RSI_SELL,colorRed,colorLightGrey));

/**************************************************
             OBV
***************************************************/
_SECTION_BEGIN("OBV");


MA_OBV_Period = Param("OBV_MA Period",10,10,21,1);


/***********OBV CROSS MA************/
OBV_BUY = Cross(OBV(),MA(OBV(),MA_OBV_Period));
OBV_SELL = Cross(MA(OBV(),MA_OBV_Period),OBV());

_SECTION_END();


OBV_status = WriteIf(OBV_BUY,"Buy",WriteIf(OBV_SELL,"Sell","NA"));
OBV_col = IIf (OBV_BUY,colorGreen, IIf (OBV_SELL,colorRed,colorLightGrey));


/**************************************************
            TSV = SIMILAR TO WORDEN
***************************************************/
_SECTION_BEGIN("TSV");
Period = Param("Period for FVE", 22, 5, 80, 1 );
Coeff = Param("Coeff for Cutoff", 0.1, 0, 2, 0.01 );

intra=log(H)-log(L);
Vintra = StDev(intra, period );
inter = log(Avg)-log(Ref(Avg,-1));
Vinter = StDev(inter,period);
Cutoff = Coeff * (Vinter+Vintra)*C;
MF = C- (H+L)/2 + Avg - Ref( Avg, -1 );
VC = IIf( MF > Cutoff, V,
IIf( MF < -Cutoff, -V, 0 ));
FVE = 100 * Sum( VC, Period )/(MA( V, Period ) * Period );

// Momemtum Indicator by William Blau

TSI = 100 * ( EMA( EMA( C - Ref( C, -1 ) ,25 ) ,13)
/ EMA( EMA( abs( C - Ref( C, -1) ),25 ), 13 ) );


TSI_BUY = Cross(TSI,EMA(TSI,7));
TSI_SELL = Cross(EMA(TSI,7),TSI);
_SECTION_END();

TSI_status = WriteIf(TSI_BUY,"Buy",WriteIf(TSI_SELL,"Sell","NA"));
TSI_col = IIf (TSI_BUY,colorGreen, IIf (TSI_SELL,colorRed,colorLightGrey));


/**************************************************
              TRIX
***************************************************/
_SECTION_BEGIN("TRIX");
// TRIX - 15 Periods, 9 Signal Periods
tPeriods = Param("Periods", 15, 2, 100, 1 );
tSig = Param("Signal", 9, 2, 100, 1);

Zero = 0;

TRIX_VAL = Trix(tPeriods);
SIG_TRIX = EMA(Trix(tPeriods),tSig);


/***********TRIX & Signal Line cross ************/
TRIX_SIGNAL_BUY = Cross(TRIX_VAL, SIG_TRIX) AND TRIX_VAL < 0;
TRIX_SIGNAL_SELL = Cross(SIG_TRIX, TRIX_VAL)AND TRIX_VAL > 0;


/***********TRIX & Zero Line cross ************/
TRIX_ZERO_BUY = Cross(TRIX_VAL, Zero);
TRIX_ZERO_SELL = Cross(Zero, TRIX_VAL);


TRIX_BUY = TRIX_SIGNAL_BUY + TRIX_ZERO_BUY;
TRIX_SELL = TRIX_SIGNAL_SELL + TRIX_ZERO_SELL;


_SECTION_END();


TRIX_status = WriteIf(TRIX_BUY,"Buy",WriteIf(TRIX_SELL,"Sell","NA"));
TRIX_col = IIf (TRIX_BUY,colorGreen, IIf (TRIX_SELL,colorRed,colorLightGrey));


/************************************************
                 Gap
*************************************************/

GAP_UP = GapUp();
GAP_DW = GapDown();

GAP_status = WriteIf(GAP_UP,"Buy",WriteIf(GAP_DW ,"Sell","NA"));
GAP_col = IIf (GAP_UP,colorGreen, IIf (GAP_DW ,colorRed,colorLightGrey));


/************************************************
            Total of Bullish/Bearish
*************************************************/


Total_Buy  = PIVOT_BUY + BUY_ADX + BUY_MACD + BUY_STOCH+ TREND_B + GAP_UP + RSI_BUY + OBV_BUY + TSI_BUY + TRIX_BUY;
Total_Sell = PIVOT_SELL + SELL_ADX + SELL_MACD + SELL_STOCH + TREND_S + GAP_DW + RSI_SELL + OBV_SELL +TSI_SELL+TRIX_SELL;


printf("B OIVOTS %g\n",PIVOT_BUY);
printf("SELL PIVOTS %g\n",PIVOT_SELL);
printf("BUY GAP %g\n",TREND_B);
printf("BUY TREND %g\n",GAP_UP);

printf("BUY RSI %g\n",B_RSI + RSI_14_GREATEST + RSI_BULL_DIV1 + RSI_BULL_DIV);


/****************************************************
                   CHART TITLES
****************************************************/
_SECTION_BEGIN("ANALYSIS");
ANALYSIS_TOGGLE = ParamToggle("ON - OFF","Off|On",1);
if(ANALYSIS_TOGGLE==1)
{
Chg=Ref(C,-1);
Title = EncodeColor(ColorRGB(109,178,255))+ "Company :: " +Title = Name() + "    " + EncodeColor(colorLightOrange) + "Date :: "  + Date() +EncodeColor(11) + EncodeColor(colorWhite) + "\n{{INTERVAL}}  " +
   EncodeColor(ColorRGB(0,240,255))+ "   Open:  "+ EncodeColor(colorWhite)+ WriteVal(O,format=1.2) +
   EncodeColor(ColorRGB(0,240,255))+ "   High:  "+ EncodeColor(colorWhite) + WriteVal(H,format=1.2) +
   EncodeColor(ColorRGB(0,240,255))+ "   Low:  "+ EncodeColor(colorWhite)+ WriteVal(L,format=1.2) +
   EncodeColor(ColorRGB(0,240,255))+ "   Close:  "+ WriteIf(C> Chg,EncodeColor(ColorRGB(168,255,0)),EncodeColor(colorRed))+ WriteVal(C,format=1.2)+
   EncodeColor(ColorRGB(0,240,255))+ "   Change:  "+ WriteIf(C> Chg,EncodeColor(ColorRGB(168,255,0)),EncodeColor(colorRed))+ WriteVal(ROC(C,1),format=1.2)+ "%"+
   EncodeColor(ColorRGB(195,158,255))+ "   Volume: "+ EncodeColor(colorWhite)+ WriteVal(V,1)


+"\n"
+"\n"+EncodeColor(colorYellow) +"---------------------"
+"\n"+EncodeColor(colorGold)+   "       Prasad        "
+"\n"+EncodeColor(colorYellow) +"---------------------"


/**************** PIVOTS***************************/
+ "\n"
+EncodeColor(colorWhite)+"PIVOTS                      = " +
WriteIf (aLPivs,EncodeColor(ColorRGB(168,255,0))+" BUY("+PIVOT_BUY+")",WriteIf (aHPivs,EncodeColor(colorRed)+ " SELL("+PIVOT_SELL+")","Neutral"))


/**************** ADX***************************/
+ "\n"
+EncodeColor(colorWhite)+"ADX                            =  " +
WriteIf (BUY_ADX,EncodeColor(ColorRGB(168,255,0))+"BUY("+BUY_ADX+")",WriteIf (SELL_ADX,EncodeColor(colorRed)+ " SELL("+SELL_ADX+")","Neutral"))


/**************** MACD ***************************/

+ "\n" +
EncodeColor(colorWhite)+"MACD "+"["+r1+"]"+" " +"["+r2+"]"+" " +"["+r3+"]    =  " +
WriteIf (BUY_MACD,EncodeColor(ColorRGB(168,255,0))+"BUY("+BUY_MACD+")",WriteIf (SELL_MACD,EncodeColor(colorRed)+ "SELL("+SELL_MACD+")","Neutral"))


/********************STOChASTICS*********************/

+"\n"+EncodeColor(colorWhite)+"Stochastics              =  "
+ WriteIf(BUY_STOCH,EncodeColor(ColorRGB(168,255,0))+"BUY ("+BUY_STOCH+")",WriteIf(SELL_STOCH,EncodeColor(colorRed)+"SELL("+SELL_STOCH+")","Neutral"))


/********************RSI*********************/
+"\n" + EncodeColor(colorWhite)+"RSI"+"("+Rperiods+")                     =  "
+WriteIf(B_RSI,EncodeColor(ColorRGB(168,255,0))+"BUY("+RSI_BUY+")",WriteIf (S_RSI,EncodeColor(colorRed)+"SELL("+RSI_SELL+")","NEUTRAL"))


/********************OBV********************/
+"\n"
+EncodeColor(colorWhite)+"OBV                           =  "+
WriteIf(OBV_BUY,EncodeColor(ColorRGB(168,255,0))+"BUY(1)",WriteIf(OBV_SELL,EncodeColor(colorRed)+"SELL(1)",""))+
WriteIf(NOT OBV_BUY AND NOT OBV_SELL,"No Cross","")


/********************TSV********************/

+"\n"
+EncodeColor(colorWhite)+"TSV                            =  "  +
WriteIf(TSI_BUY,EncodeColor(ColorRGB(168,255,0))+"BUY(1)",
WriteIf(TSI_SELL,EncodeColor(colorRed)+"SELL(1)",""))+
WriteIf(NOT TSI_BUY AND NOT TSI_SELL,EncodeColor(colorAqua)+"NA","")


/********************TRIX*********************/
+"\n"
+EncodeColor(colorWhite)+"TRIX "+ "("+tPeriods+") "+"(" +tSig+ ")            =  "

+EncodeColor(ColorRGB(168,255,0))+
WriteIf (TRIX_BUY, "BUY ("+TRIX_BUY+")","")
+EncodeColor(colorRed)+
WriteIf (TRIX_SELL, "SELL("+TRIX_SELL+")","")
+EncodeColor(colorAqua)+
WriteIf (NOT TRIX_SELL AND NOT TRIX_BUY, "No Cross","")


/**************TREND*********************************/


+"\n" +EncodeColor(colorWhite)+"Trend                        =  "
+WriteIf(Up AND NOT TREND_B,EncodeColor(ColorRGB(168,255,0))+"Up ",WriteIf(Up AND TREND_B,EncodeColor(colorBrightGreen)+ "BUY(1)",
WriteIf(Down AND NOT TREND_S,EncodeColor(colorRed)+"Down",WriteIf(Down AND TREND_S,EncodeColor(colorRed)+"SELL(1)","."))))


/**************GAPS *********************************/


+"\n"+EncodeColor(colorWhite)+"GAP                           =  "
+WriteIf(GAP_UP,EncodeColor(ColorRGB(168,255,0))+"UP (1)",WriteIf(GAP_DW,EncodeColor(colorRed)+"DOWN (1)", EncodeColor(colorAqua)+"Neutral"))


+"\n"+EncodeColor(colorPink) +"======================"
+"\n"+EncodeColor((ColorRGB(242,157,255)))+"BUY    =    "+EncodeColor(colorYellow)+Total_Buy
+"\n"+EncodeColor((ColorRGB(242,157,255)))+"SELL   =    "+EncodeColor(colorYellow)+Total_Sell
+"\n"+EncodeColor(colorPink) +"---------------------";


}
_SECTION_END();


//**************************************************************************************
//												EXPLORATION COLUMNS
//***********************************************************************************/

Filter =  Total_Buy OR Total_Sell;


SetOption("NoDefaultColumns", True);

AddTextColumn( Name(), "Security", 1, textColor=colorBlack, bkgndColor=colorSkyblue);

AddColumn( DateTime(), "Date", formatDateTime, colorBlack, colorTan);

AddTextColumn(PIVOT_status, "MACD", 1, colorWhite,PIVOT_col);

AddTextColumn(MACD_status, "MACD", 1, colorWhite, MACD_col);

AddTextColumn(STOCH_status, "STOCH", 1, colorWhite, STOCH_col);

AddTextColumn(RSI_status, "RSI", 1, colorWhite, RSI_col);

AddTextColumn(OBV_status, "OBV", 1, colorWhite, OBV_col);

AddTextColumn(TSI_status, "TSV", 1, colorWhite, TSI_col);

AddTextColumn(TRIX_status, "TRIX", 1, colorWhite, TRIX_col);

AddTextColumn(TREND_status, "TREND", 1, colorWhite, TREND_col);

AddTextColumn(GAP_status, "GAP", 1, colorWhite, GAP_col);


AddColumn(Total_Buy,"Ttl Buy",1.2,colorBlack);
AddColumn(Total_Sell,"Ttl Sell",1.2,colorBlack);
33 comments
Leave Comment
Please login here to leave a comment.
It seems very good!!! Thank you very much!!
There is no holy grail available in the earth.
It refers to future quotes.Arrows will disappear.
Not meant for trading.
Admin should remove all the future looking codes from the site.
THere are always some pessimists and sadists available on d earth. People who havent done a deep digging into technical analysis.
As I mentioned this was a very initial version of what I designed. And there are no future looking indicators here in this version.
The Parabolic and Volume Zig Zag are future looking indicators which are not there in this version.
Currently I am refining my 9 th version of HOLY GRAIL and am happy with the results.
I dont have the time to do R&D on the existence of HOLY GRAIL , but I am happy as long it produces profitable trades…. U call it BULL SHIT or HOLY GRAIL is immaterial.
Last but not the least I have not come here to argue or to prove ne thing………..
You may happy with your future looking code. ok.
Change the name of afl. Its not holy grail.Its a utter crap.
@prakash2009 There is no need to put down other peoples work.
It was provided here free for everyone. If you do not like it then leave a constructive comment and use the rating system.
Pivots are always future looking. The formula looks like it shows a summary of buy and sell signals from many different systems and also allows you to explore for those signals. Pivots are displayed with arrows and they are future looking.
A system must be a risk calculated bet. If you wait for a well confirmed signal you loose half of the gain.
Thanks a lot Prasad for sharing this code.
I strongly agree with admin specially….
//administrator
@prakash2009 There is no need to put down other peoples work.//
Nice comment, we should be make the ppl underestimated…we may differ in our opinion but that should be focused in a polite and nice way.
I am appreciating and encouraging PRASAD for doing and sharing such a nice work. I found this afl is useful with me.
thanks a lot for nice afl.volume bar size /length is too small .is there any option to increase volume bar size to clear visualization?
Dear Prasad B Rao,
I m newbie in Ami paltform as well as in AFL.
But whn i downloaded & saw in Live…it’s showing good results.
Thanks to u as well as admin to support u.
~hyraj
Ghanta Holy Grail Lol Nowadays People Everyday Shout I Found Holy Grail And Put His Name AFter Making Colorfull Some Other’s System
This is something to look at it, but not use it!
Fooly Grail
Bravo
I checked out this code but signals r nt trust worthy as Butterworth with setting 29…….. I changed no’s of bars to 23 & 33…. it given signals low points,but later disappears……which is not gng to happen….pls sir make it more accurate…..
Prasad,
Thanks you for sharing this formula.
Please design a stock screen AFL based on Holy Grail .
regards
tuhin
dear peasad rao garu,
i am happy with the results of holy grail , but looking forward to your new version..
pls share your mail-id if you don;t mind..
Hi Mr. Prasad Rao,
Thanks for sharing the afl, your hard work.
pls share the upgraded version.
Technical Analysis is not a monkeys play…
@prasadbrao,
Hi bhai, Please note that you can check your afl, whether its look into future or not, by opening it in formula editor >tools>code check & profile.
Now, Future looking may be for say two bar, so, if any afl looks in to future for two bar you can delay your trade for 2 bars to check whether it change signal or not.
BTW, Below is the report given by afl check:-
“It seems that the formula references FUTURE quotes.
If you backtest this system you may receive outstanding results
that CAN NOT be reproduced in real trading.
19724 data bars used during this check. Total execution time: 0.142598 sec.
*Approximately ALL past and ALL future quotes are needed *to calculate the formula properly
(This statement is automated rough estimate and does not take into account functions exported by plugins or scripting parts of your formula)".
:( Its fully useless. Please don’t mind but why I am saying is not to feel you down but to save peoples from making losses who are not aware of this.
Hope you understand.
johnnypareek
dear prasad rao
i agree with your hard work and back testing one thing is true there is no indicator in the world which can give more than 70% accuracy if we find that magic indicator it takes lot of effort and market psychology to trade in that time frame and what we behave during intraday only market experience with many many years and with strict money management can only help not with indicators
dear fellow members and dont go for magic indicators and ther is no holy grail
if any fellow members made consistant profit without losing capital plz post your comments to my mail santkmys@yahoo.com
thanks
Mr Prasad I like your AFL, Pls. share with me on my mail manojin1@gmail.com, Thanks
Hi, I am new user to this website. I do not understand people that call this good AFL as shit. For me that work correct at the first try. Then maybe these people not happy have to check their knowledge about how to install AFL in their software. Anyway PRASADBRAO You are a very good person for to share this wonderful AFL. Thank You Very Very Very Much!!!!!!!!!!!!!!!!!
Using arrows to indicate pivot points (which are not buy signals) may confuse people into thinking this is a real holy grail.
dear prasad dont care about what others say they themselves are jealous of you. i like this afl v much. thanku for sharing. i like your work. thnks v much. its v helpful. plz update if possible
Dear Prasad ! I am really grateful to you for such a beautiful and useful code and really appreciate your hard working. If you have upgraded/updated this system then please let us be beneficieries of the same.
Hi Prasad,
Can you please share your holy grail system? my mail id kacraj@gmail.com
Regards,
kacraj
Its repainting one……..Not holy Grail its only Tail
how to scan with this AFL?
thanks for AFL
signal are late
need to improve
please share new ver.
como se descarga
really super sir , thank u
It’s been 7 years or more, have you come out with the 8th version as you promised? Can’t wait to see it coming!