CROSS OVER BUY AND SELL VER 2 for Amibroker (AFL)
prasadmuni almost 14 years ago Amibroker (AFL)
Dear friends,
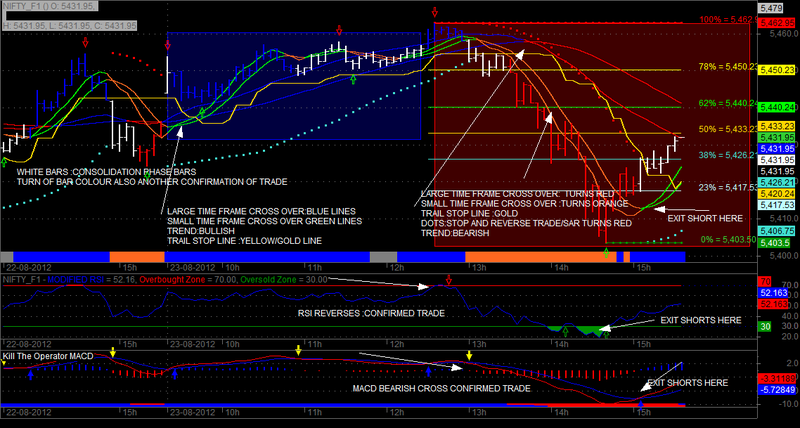
Thanks for the response for the cross over buy sell.In this version the lag in the colour change of bar has been reduced.A trail stop is added and stop and reverse dots have been added and to be doubly sure look for the trending ribbon at the bottom.Let me name it as cross over buy and sell vertion 2.Best results will be achived in 5 min time frame and use the 15 min tf for confirmation of the trend only.After taking the trade a buy or sell the previous pivot arrow will act as the stoploss and keep trailing stops as per the gold line.Dont trade on higher time frames.Use of rsi and macd and trading with divergences will give excellent profitable trades.I am not a coder but i have tweaked a lot of the codes and tested before contributing the same.With due thanks to the great afl codeing gurus this piece of marvel could be achived.It is a must in a traders arsenal.
I trade with this same system with Bollinger bands added.Hope you all will enjoy trading.Good luck
Screenshots
Indicator / Formula
_SECTION_BEGIN("Price");
SetChartOptions(0,chartShowArrows|chartShowDates);
_N(Title = StrFormat("{{NAME}} - {{INTERVAL}} {{DATE}} Open %g, Hi %g, Lo %g, Close %g (%.1f%%) Vol " +WriteVal( V, 1.0 ) +" {{VALUES}}", O, H, L, C, SelectedValue( ROC( C, 1 )) ));

trendup = IIf(MACD(12,26) > 0 AND MACD(12,26) > Signal(12,26,9), colorBlue, colorWhite);
trendcolor = IIf(MACD(12,26) < 0 AND MACD(12,26) < Signal(12,26,9), colorRed, trendup);
Plot( C, "Close", trendcolor, styleBar | styleThick );

//RSIup = RSI(7) > 70;
//RSIdown = RSI(7) < 30;

sp = Param( "RSI Period", 7, 1, 100 );
r = RSI( sp );
RSIup = r > 70;
RSIdown = r < 30;

shape = RSIup * shapeNone + RSIdown * shapeNone;
PlotShapes(shape, IIf( RSIup, colorBrightGreen, colorRed ), 0, IIf( RSIup, Low, High ) );

if( ParamToggle("Tooltip shows", "All Values | Only Prices" ) )
{
 ToolTip=StrFormat("Open: %g\nHigh:  %g\nLow:   %g\nClose:  %g (%.1f%%)\nVolume: "+NumToStr( V, 1 ), O, H, L, C, SelectedValue( ROC( C, 1 )));
}
_SECTION_END();

SetChartBkColor(ParamColor("Panel color ",colorBlack));

PlotOHLC( Open,  High,  Low,  Close, "", colorLime, styleBar| styleThick   );


_SECTION_BEGIN("trailstops");
EntrySignal = C > ( LLV( L, 20 ) + 2 * ATR( 10 ) );
ExitSignal = C < ( HHV( H, 20 ) - 2 * ATR( 10 ) );
Color = IIf( EntrySignal, colorBlue, IIf( ExitSignal, colorOrange, colorGrey50 ));
TrailStop = HHV( C - 2 * ATR(10), 15 );
ProfitTaker = EMA( H, 13 ) + 2 * ATR(10);

/* plot price chart and stops */
Plot( TrailStop, "Trailing stop", colorGold, styleThick | styleLine  );
Plot( C, "Price", color, styleBar  );

/* plot color ribbon */
Plot( 2, "", Color, styleArea | styleOwnScale | styleNoLabel, -0.1, 50 );


_SECTION_BEGIN("GFX EMA");
procedure Plotlinewidth(pvalue,ptitle,pcolor,pstyle,pmin,pmax,pxshift,plinewidth,pshowdate)
{
local pvalue,ptitle,pcolor,pstyle,pmin,pmax,pxshift,plinewidth,ppenstyle,pshowdate;
local Miny,Maxy; local Lvb,fvb; local pxwidth,pxheight; local TotalBars,axisarea; local i,x,y;
if(plinewidth>0 && Status("action") == 1 && (pstyle & styleLine==styleLine)){
GfxSetOverlayMode(0);
Miny=Status("axisminy"); Maxy=Status("axismaxy");
lvb=Status("lastvisiblebar"); fvb=Status("firstvisiblebar");
pxwidth=Status("pxwidth"); pxheight=Status("pxheight");
TotalBars=Lvb-fvb; xaxisarea=56;
if(pshowdate)yaxisarea=10;
else
yaxisarea=0; i=0;
x=5+i*(pxwidth-xaxisarea-10)/( TotalBars+1);
y=5+yaxisarea+(pvalue[i+fvb]-Miny)*(pxheight-yaxisarea-10)/(Maxy-Miny);
GfxMoveTo(x,pxheight - y);
for(i=1; i<TotalBars AND i<(BarCount-fvb); i++)
{
GfxSelectPen(pcolor[i + fvb],plinewidth,0);
x=5+i*(pxwidth-xaxisarea-10)/(TotalBars+1);
y=5+yaxisarea+(pvalue[i+fvb]-Miny)*(pxheight-yaxisarea-10)/(Maxy-Miny);
GfxLineTo(x,pxheight - y);
}}}
RequestTimedRefresh(2);
_SECTION_END();


_SECTION_BEGIN("Small Triggers");
p1 = Param("TL 1 Periods", 20, 5, 50, 1);
p2 = Param("TL 2 Periods", 5, 3, 25, 1);
TL1 = LinearReg(C, p1);
TL2 = EMA(TL1, p2);
Col1 = IIf(TL1 > TL2, ParamColor("TL Up Colour", colorBrightGreen), ParamColor("TL Dn Colour", colorCustom12));
Plot(TL1, "TriggerLine 1", Col1, styleLine|styleThick|styleNoLabel);
Plot(TL2, "TriggerLine 2", Col1, styleLine|styleThick|styleNoLabel);
_SECTION_END();

_SECTION_BEGIN("Large Triggers");
p3 = Param("TL 3 Periods", 80, 5, 100, 1);
p4 = Param("TL 4 Periods", 20, 3, 100, 1);
TL3 = LinearReg(C, p3);
TL4 = EMA(TL3, p4);
Col1 = IIf(TL3 > TL4, ParamColor("TLL Up Colour", colorBlue), ParamColor("TLL Dn Colour", colorRed));
Plot(TL3, "TriggerLine 3", Col1, styleLine|styleThick|styleNoLabel);
Plot(TL4, "TriggerLine 4", Col1, styleLine|styleThick|styleNoLabel);
_SECTION_END();

_SECTION_BEGIN("Fibo Retrace and Extensions");
	fibs = ParamToggle("Plot Fibs","Off|On",1);
	pctH = Param ("Pivot Hi %", 0.325,0.001,2.0,0.002);
	HiLB = Param ("Hi LookBack",1,1,BarCount-1,1);
	pctL = Param ("Pivot Lo %", 0.325,0.001,2.0,0.002);
	LoLB = Param ("Lo LookBack",1,1,BarCount-1,1);
	Back = Param ("Extend Left = 2",1,1,500,1);
	Fwd  = Param("Plot Forward", 0, 0, 500, 1);
	text = ParamToggle("Plot Text","Off|On",1);
	hts  = Param ("Text Shift", -33.5,-50,50,0.10);
	style =ParamStyle("Line Style",styleLine,styleNoLabel);
x = BarIndex();
pRp  = PeakBars( H, pctH, 1) == 0;
yRp0 = SelectedValue(ValueWhen( pRp, H, HiLB));
xRp0 = SelectedValue(ValueWhen( pRp, x, HiLB));
pSp  = TroughBars( L, pctL, 1) == 0;
ySp0 = SelectedValue(ValueWhen( pSp, L, LoLB));
xSp0 = SelectedValue(ValueWhen( pSp, x, LoLB));
Delta = yRp0 - ySp0;

function fib(ret)
{
retval = (Delta * ret);
Fibval = IIf(ret < 1.0
AND xSp0 < xRp0, yRp0 - retval, IIf(ret < 1.0
AND xSp0 > xRp0, ySp0 + retval,IIf(ret > 1.0
AND xSp0 < xRp0, yRp0 - retval, IIf(ret > 1.0
AND xSp0 > xRp0, ySp0 + retval, Null))));
return FibVal;
}

x0 = Min(xSp0,xRp0)-Back;
x1 = (BarCount -1);

r236 = fib(0.236);	r236I = LastValue (r236,1);
r382 = fib(0.382);	r382I = LastValue (r382,1);
r050 = fib(0.50);		r050I = LastValue (r050,1);
r618 = fib(0.618);	r618I = LastValue (r618,1);
r786 = fib(0.786);	r786I = LastValue (r786,1);
e127 = fib(1.27);		e127I = LastValue (e127,1);
e162 = fib(1.62);		e162I = LastValue (e162,1);
e200 = fib(2.00);		e200I = LastValue (e200,1);
e262 = fib(2.62);		e262I = LastValue (e262,1);
e424 = fib(4.24);		e424I = LastValue (e424,1);

p00 = IIf(xSp0 > xRp0,ySp0,yRp0); 	p00I = LastValue (p00,1);
p100 = IIf(xSp0 < xRp0,ySp0,yRp0); 	p100I = LastValue (p100,1);
color00 =IIf(xSp0 > xRp0,colorLime,colorRed);
color100 =IIf(xSp0 < xRp0,colorLime,colorRed);

numbars = LastValue(Cum(Status("barvisible")));
fraction= IIf(StrRight(Name(),3) == "", 3.2, 3.2);

if(fibs==1)
{
Plot(LineArray(xRp0-Fwd,yRp0,x1,yRp0,Back),"PR",32,8|styleNoRescale,Null, Null,Fwd);
Plot(LineArray(xSp0-Fwd,ySp0,x1,ySp0,Back),"PS",27,8|styleNoRescale,Null, Null,Fwd);
Plot(LineArray(x0-Fwd,r236,x1,r236,Back),"",45,style|styleNoRescale,Null, Null,Fwd);
Plot(LineArray(x0-Fwd,r382,x1,r382,Back),"",44,style|styleNoRescale,Null, Null,Fwd);
Plot(LineArray(x0-Fwd,r050,x1,r050,Back),"",41,style|styleNoRescale,Null, Null,Fwd);
Plot(LineArray(x0-Fwd,r618,x1,r618,Back),"",43,style|styleNoRescale,Null, Null,Fwd);
Plot(LineArray(x0-Fwd,r786,x1,r786,Back),"",42,style|styleNoRescale,Null, Null,Fwd);
Plot(LineArray(x0-Fwd,e127,x1,e127,Back),"e127",47,style|styleNoRescale,Null, Null,Fwd);
Plot(LineArray(x0-Fwd,e162,x1,e162,Back),"e162",47,style|styleNoRescale,Null, Null,Fwd);
Plot(LineArray(x0-Fwd,e200,x1,e200,Back),"p200",47,style|styleNoRescale,Null, Null,Fwd);
Plot(LineArray(x0-Fwd,e262,x1,e262,Back),"p262",47,style|styleNoRescale,Null, Null,Fwd);
Plot(LineArray(x0-Fwd,e424,x1,e424,Back),"p424",25,style|styleNoRescale,Null, Null,Fwd);
}

if(text==1)
{
PlotText(" 0% = " + WriteVal(p00,fraction), 	LastValue(BarIndex())-(numbars/hts), p00I  + 0.05, color00);
PlotText("23% = " + WriteVal(r236,fraction), LastValue(BarIndex())-(numbars/hts), r236I + 0.05, 45);
PlotText("38% = " + WriteVal(r382,fraction), LastValue(BarIndex())-(numbars/hts), r382I + 0.05, 44);
PlotText("50% = " + WriteVal(r050,fraction), LastValue(BarIndex())-(numbars/hts), r050I + 0.05, 41);
PlotText("62% = " + WriteVal(r618,fraction), LastValue(BarIndex())-(numbars/hts), r618I + 0.05, 43);
PlotText("78% = " + WriteVal(r786,fraction), LastValue(BarIndex())-(numbars/hts), r786I + 0.05, 42);
PlotText("100% = " + WriteVal(p100,fraction), LastValue(BarIndex())-(numbars/hts),p100I + 0.05, color100);
PlotText("127% = " + WriteVal(e127,fraction), LastValue(BarIndex())-(numbars/hts),e127I + 0.05, 47);
PlotText("162% = " + WriteVal(e162,fraction), LastValue(BarIndex())-(numbars/hts),e162I + 0.05, 47);
PlotText("200% = " + WriteVal(e200,fraction), LastValue(BarIndex())-(numbars/hts),e200I + 0.05, 47);
PlotText("262% = " + WriteVal(e262,fraction), LastValue(BarIndex())-(numbars/hts),e262I + 0.05, 47);
PlotText("424% = " + WriteVal(e424,fraction), LastValue(BarIndex())-(numbars/hts),e424I + 0.05, 25);
}
_SECTION_END();

  /* **********************************

Code to automatically identify pivots

********************************** */

// -- what will be our lookback range for the hh and ll?
farback=Param("How Far back to go",100,50,5000,10);
nBars = Param("Number of bars", 12, 5, 40);

// -- Title.

Title = Name() + " (" + StrLeft(FullName(), 15) + ") O: " + Open + ",

H: " + High + ", L: " + Low + ", C: " + Close;

// -- Plot basic candle chart

PlotOHLC(Open, High, Low, Close,

"BIdx = " + BarIndex() +

"\n" + "O = " + O + "\n"+"H = "+ H + "\n"+"L = " + L

+ "\n"+"C ",

colorBlack, styleBar);

GraphXSpace=7;

// -- Create 0-initialized arrays the size of barcount

aHPivs = H - H;

aLPivs = L - L;

// -- More for future use, not necessary for basic plotting

aHPivHighs = H - H;

aLPivLows = L - L;

aHPivIdxs = H - H;

aLPivIdxs = L - L;

nHPivs = 0;

nLPivs = 0;

lastHPIdx = 0;

lastLPIdx = 0;

lastHPH = 0;

lastLPL = 0;

curPivBarIdx = 0;

// -- looking back from the current bar, how many bars

// back were the hhv and llv values of the previous

// n bars, etc.?

aHHVBars = HHVBars(H, nBars);

aLLVBars = LLVBars(L, nBars);

aHHV = HHV(H, nBars);

aLLV = LLV(L, nBars);

// -- Would like to set this up so pivots are calculated back from

// last visible bar to make it easy to "go back" and see the pivots

// this code would find. However, the first instance of

// _Trace output will show a value of 0

aVisBars = Status("barvisible");

nLastVisBar = LastValue(Highest(IIf(aVisBars, BarIndex(), 0)));

_TRACE("Last visible bar: " + nLastVisBar);

// -- Initialize value of curTrend

curBar = (BarCount-1);

curTrend = "";

if (aLLVBars[curBar] <

aHHVBars[curBar]) {

curTrend = "D";

}

else {

curTrend = "U";

}

// -- Loop through bars. Search for

// entirely array-based approach

// in future version

for (i=0; i<farback; i++) {

curBar = (BarCount - 1) - i;

// -- Have we identified a pivot? If trend is down...

if (aLLVBars[curBar] < aHHVBars[curBar]) {

// ... and had been up, this is a trend change

if (curTrend == "U") {

curTrend = "D";

// -- Capture pivot information

curPivBarIdx = curBar - aLLVBars[curBar];

aLPivs[curPivBarIdx] = 1;

aLPivLows[nLPivs] = L[curPivBarIdx];

aLPivIdxs[nLPivs] = curPivBarIdx;

nLPivs++;

}

// -- or current trend is up

} else {

if (curTrend == "D") {

curTrend = "U";

curPivBarIdx = curBar - aHHVBars[curBar];

aHPivs[curPivBarIdx] = 1;

aHPivHighs[nHPivs] = H[curPivBarIdx];

aHPivIdxs[nHPivs] = curPivBarIdx;

nHPivs++;

}

// -- If curTrend is up...else...

}

// -- loop through bars

}

// -- Basic attempt to add a pivot this logic may have missed

// -- OK, now I want to look at last two pivots. If the most

// recent low pivot is after the last high, I could

// still have a high pivot that I didn't catch

// -- Start at last bar

curBar = (BarCount-1);

candIdx = 0;

candPrc = 0;

lastLPIdx = aLPivIdxs[0];

lastLPL = aLPivLows[0];

lastHPIdx = aHPivIdxs[0];

lastHPH = aHPivHighs[0];

if (lastLPIdx > lastHPIdx) {

// -- Bar and price info for candidate pivot

candIdx = curBar - aHHVBars[curBar];

candPrc = aHHV[curBar];

if (

lastHPH < candPrc AND

candIdx > lastLPIdx AND

candIdx < curBar) {


// -- OK, we'll add this as a pivot...

aHPivs[candIdx] = 1;

// ...and then rearrange elements in the

// pivot information arrays

for (j=0; j<nHPivs; j++) {

aHPivHighs[nHPivs-j] = aHPivHighs[nHPivs-

(j+1)];

aHPivIdxs[nHPivs-j] = aHPivIdxs[nHPivs-(j+1)];

}

aHPivHighs[0] = candPrc ;

aHPivIdxs[0] = candIdx;

nHPivs++;

}

} else {


// -- Bar and price info for candidate pivot

candIdx = curBar - aLLVBars[curBar];

candPrc = aLLV[curBar];

if (

lastLPL > candPrc AND

candIdx > lastHPIdx AND

candIdx < curBar) {


// -- OK, we'll add this as a pivot...

aLPivs[candIdx] = 1;

// ...and then rearrange elements in the

// pivot information arrays

for (j=0; j<nLPivs; j++) {

aLPivLows[nLPivs-j] = aLPivLows[nLPivs-(j+1)];

aLPivIdxs[nLPivs-j] = aLPivIdxs[nLPivs-(j+1)];

}

aLPivLows[0] = candPrc;

aLPivIdxs[0] = candIdx;

nLPivs++;

}

}

// -- Dump inventory of high pivots for debugging

/*

for (k=0; k<nHPivs; k++) {

_TRACE("High pivot no. " + k

+ " at barindex: " + aHPivIdxs[k] + ", "

+ WriteVal(ValueWhen(BarIndex()==aHPivIdxs[k],

DateTime(), 1), formatDateTime)

+ ", " + aHPivHighs[k]);

}

*/

// -- OK, let's plot the pivots using arrows

PlotShapes(

IIf(aHPivs==1, shapeHollowDownArrow, shapeNone), colorRed, 0,

High, Offset=-15);

PlotShapes(

IIf(aLPivs==1, shapeHollowUpArrow , shapeNone), colorBrightGreen, 0,

Low, Offset=-15);
_SECTION_END();

_SECTION_BEGIN("Dots Color");
acc = Param("Acceleration", 0.01, 0, 1, 0.001 );
accm = Param("Max. acceleration", 0.1, 0, 1, 0.001 );
myColor = IIf (C > SAR( acc, accm ) , colorTurquoise , colorRed);
Plot( SAR( acc, accm ), _DEFAULT_NAME(), myColor , ParamStyle("Style", styleDots |styleThick | styleNoLine, maskDefault | styleDots | styleThick | styleNoLine ) );
_SECTION_END();

SetChartBkGradientFill( ParamColor("BgTop", ColorRGB( 172,172,172 )),

ParamColor("BgBottom", ColorRGB( 172,172,172 )),ParamColor("titleblock",ColorRGB( 172,172,172 )));
16 comments
Leave Comment
Please login here to leave a comment.
Hello Prasad Muni, It would be gr8 help if u could Add EXPLORATION (SCANNING) to this afl for Long term and short term buy/sell(Keep up ur good work).
Hi Prasadmuni
Good Work. Please provide Kill The Operator MACD AFL. Thanks in advance.
Hi Prasadmuni
Please also post RSI AFL shown in picture.
hi Prasadmuni sir
pls give me RSI AFL & Kill The Operator MACD AFL
waiting 4 ur afls
thank u sir
HI I HAVE POSTED KILL THE OPERATOR MACD AND ADMINISTRATOR MAY POST THE AFL SOON.WISHING YOU ALL GOOD LUCK AND HAPPY TRADING
PRASAD MUNI
HI..Boss prasadmuni,many traders are searching the rare afl ‘kill the operator’ which is not available in net and thanks for sharing…waiting for admin’s action.
sir could you also post colour modified rsi.
provide, operator kill macd
love it if it dont look at future price
Thanks a lot, it’s great.
not working white page sir
Tested 58 AFL and this one is BesT
looks into the future …..
This seems to be working well with daily bars too. I mean time frame as day. Is there a reason why you mentioned dont use it for higher time frames ?
Many thanks for the code.
But can we run with either scan or exploration? How can we do that?
Please help!
thanks bro