fibonacci extension updown for Amibroker (AFL)
vijaybaroda over 13 years ago Amibroker (AFL)
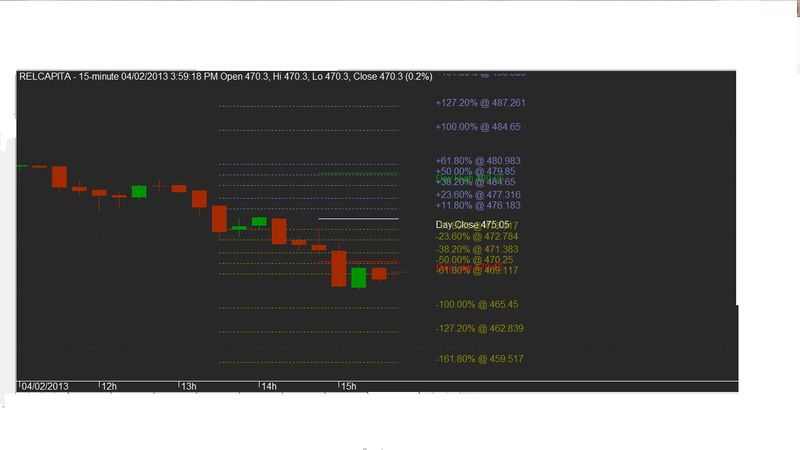
using fibonacci of last day week ,month range..plotting fib lines,usefull levels for intraday as well as swing trade..
buy when price enter above 38.2 level and sell whenprice enter in lower 38.2 level below..
Screenshots
Indicator / Formula
Copy & Paste Friendly
_SECTION_BEGIN("Price");
SetChartOptions(0,chartShowArrows|chartShowDates);
_N(Title = StrFormat("{{NAME}} - {{INTERVAL}} {{DATE}} Open %g, Hi %g, Lo %g, Close %g (%.1f%%) {{VALUES}}", O, H, L, C, SelectedValue( ROC( C, 1 ) ) ));
Plot( C, "Close", ParamColor("Color", colorBlack ), styleNoTitle | ParamStyle("Style") | GetPriceStyle() );
_SECTION_END();

_SECTION_BEGIN("fib extn up down vijay");
// Setup for Daily Range

TimeFrameSet(inDaily);
TOP_        = Open;
PDH_        = Ref(High,-1);
PDL_        = Ref(Low,-1);
PDO_        = Ref(Open,-1);
PDC_        = Ref(Close,-1);
PDM_        = (PDH_+PDL_)/2;
TimeFrameRestore();

TOP         = TimeFrameExpand(TOP_,inDaily,expandFirst);
PDH         = TimeFrameExpand(PDH_,inDaily,expandFirst);
PDL         = TimeFrameExpand(PDL_,inDaily,expandFirst);
PDO         = TimeFrameExpand(PDO_,inDaily,expandFirst);
PDC         = TimeFrameExpand(PDC_,inDaily,expandFirst);

TOP         = TimeFrameExpand(TOP_,inDaily,expandFirst);
PDH         = TimeFrameExpand(PDH_,inDaily,expandFirst);
PDL         = TimeFrameExpand(PDL_,inDaily,expandFirst);
PDO         = TimeFrameExpand(PDO_,inDaily,expandFirst);
PDC         = TimeFrameExpand(PDC_,inDaily,expandFirst);
//Bars       = BarsSince(TimeNum() >= 62900 AND TimeNum() < 64400);//,BarIndex(),1); // AND DateNum()==LastValue(DateNum());

// Day High
x0 =BarCount-5;
x1 = BarCount;
y0 = y1= pdh[BarCount-1]+1;
Plot(LineArray(x0,y0,x1,y1,0),"",colorGreen,styleLine|styleNoRescale);
// Day Close
y0 = y1= pdc[BarCount-1]+1;
Plot(LineArray(x0,y0,x1,y1,0),"",colorWhite,styleLine|styleNoRescale);
// Day Low
y0 = y1= pdl[BarCount-1]+1;
Plot(LineArray(x0,y0,x1,y1,0),"",colorRed,styleLine|styleNoRescale);

PlotText("Day High "+ pdh, BarCount+1, pdh[BarCount-1], colorGreen );
PlotText("Day Close "+ pdc, BarCount+1, pdc[BarCount-1], colorWhite );
PlotText("Day Low "+ pdl, BarCount+1, pdl[BarCount-1], colorRed );

// fib ext
base = pdh -pdl ;
fu423_6 = pdc + (base * 4.236);
fu261_8 = pdc + (base * 2.618);
fu161_8 = pdc + (base * 1.618);
fu127_2 = pdc + (base * 1.272);
fu100 = pdc + (base * 1.000);
fu61_8 = pdc + (base * 0.618);
fu50 = pdc + (base * 0.500);
fu38_2 = pdc + (base * 0.382);
fu23_6 = pdc + (base * 0.236);
fu11_8 = pdc + (base * 0.118);
fd11_8 = pdc - (base * 0.118);
fd23_6 = pdc - (base * 0.236);
fd38_2 = pdc - (base * 0.382);
fd50 = pdc - (base * 0.500);
fd61_8 = pdc - (base * 0.618);
fd100 = pdc - (base * 1.000);
fd127_2 = pdc - (base * 1.272);
fd161_8 = pdc - (base * 1.618);
fd261_8 = pdc - (base * 2.618);
fd423_6 = pdc - (base * 4.236);

x0 =BarCount-10;
x1 = BarCount;


// Up
/*
// FU423_6
y0 = y1= fu423_6[BarCount-1]+1;
Plot(LineArray(x0,y0,x1,y1,0),"",colorBlueGrey,styleLine|styleDashed ); //styleNoRescale colorLightGrey
PlotText("+423.60% @ " + fu423_6 , BarCount+1, y0, colorBlueGrey);


// FU261_8
y0 = y1= fu261_8[BarCount-1]+1;
Plot(LineArray(x0,y0,x1,y1,0),"",colorBlueGrey,styleLine|styleDashed ); //styleNoRescale colorLightGrey
PlotText("+261.80% @ " + fu261_8 , BarCount+1, y0, colorBlueGrey);
*/
// FU161_8
y0 = y1= fu161_8[BarCount-1]+1;
Plot(LineArray(x0,y0,x1,y1,0),"",colorBlueGrey,styleLine|styleDashed ); //styleNoRescale colorLightGrey
PlotText("+161.80% @ " + fu161_8 , BarCount+1, y0, colorBlueGrey);

// FU127_2
y0 = y1= fu127_2[BarCount-1]+1;
Plot(LineArray(x0,y0,x1,y1,0),"",colorBlueGrey,styleLine|styleDashed ); //styleNoRescale colorLightGrey
PlotText("+127.20% @ " + fu127_2 , BarCount+1, y0, colorBlueGrey);

// FU100
y0 = y1= fu100[BarCount-1]+1;
Plot(LineArray(x0,y0,x1,y1,0),"",colorBlueGrey,styleLine|styleDashed ); //styleNoRescale colorLightGrey
PlotText("+100.00% @ " + fu100 , BarCount+1, y0, colorBlueGrey);

// FU61_8
y0 = y1= fu61_8[BarCount-1]+1;
Plot(LineArray(x0,y0,x1,y1,0),"",colorBlueGrey,styleLine|styleDashed ); //styleNoRescale colorLightGrey
PlotText("+61.80% @ " + fu61_8 , BarCount+1, y0, colorBlueGrey);


// FU50
y0 = y1= fu50[BarCount-1]+1;
Plot(LineArray(x0,y0,x1,y1,0),"",colorBlueGrey,styleLine|styleDashed ); //styleNoRescale colorLightGrey
PlotText("+50.00% @ " + fu50 , BarCount+1, y0, colorBlueGrey);

// FU38_2
y0 = y1= fu38_2[BarCount-1]+1;
Plot(LineArray(x0,y0,x1,y1,0),"",colorBlueGrey,styleLine|styleDashed ); //styleNoRescale colorLightGrey
PlotText("+38.20% @ " + fu100 , BarCount+1, y0, colorBlueGrey);

// FU23_6
y0 = y1= fu23_6[BarCount-1]+1;
Plot(LineArray(x0,y0,x1,y1,0),"",colorBlueGrey,styleLine|styleDashed ); //styleNoRescale colorLightGrey
PlotText("+23.60% @ " + fu23_6 , BarCount+1, y0, colorBlueGrey);

// FU11_8
y0 = y1= fu11_8[BarCount-1]+1;
Plot(LineArray(x0,y0,x1,y1,0),"",colorBlueGrey,styleLine|styleDashed ); //styleNoRescale colorLightGrey
PlotText("+11.80% @ " + fu11_8 , BarCount+1, y0, colorBlueGrey);


//Down

// FD11_8
y0 = y1= fd11_8[BarCount-1]+1;
Plot(LineArray(x0,y0,x1,y1,0),"",colorDarkYellow,styleLine|styleDashed ); //styleNoRescale colorLightGrey
PlotText("-11.80% @ " + fd11_8 , BarCount+1, y0, colorDarkYellow);

// FD23_6
y0 = y1= fd23_6[BarCount-1]+1;
Plot(LineArray(x0,y0,x1,y1,0),"",colorDarkYellow,styleLine|styleDashed ); //styleNoRescale colorLightGrey
PlotText("-23.60% @ " + fd23_6 , BarCount+1, y0, colorDarkYellow);

// FD38_2
y0 = y1= fd38_2[BarCount-1]+1;
Plot(LineArray(x0,y0,x1,y1,0),"",colorDarkYellow,styleLine|styleDashed ); //styleNoRescale colorLightGrey
PlotText("-38.20% @ " + fd38_2 , BarCount+1, y0, colorDarkYellow);

// FD50
y0 = y1= fd50[BarCount-1]+1;
Plot(LineArray(x0,y0,x1,y1,0),"",colorDarkYellow,styleLine|styleDashed ); //styleNoRescale colorLightGrey
PlotText("-50.00% @ " + fd50 , BarCount+1, y0, colorDarkYellow);

// FD61_8
y0 = y1= fd61_8[BarCount-1]+1;
Plot(LineArray(x0,y0,x1,y1,0),"",colorDarkYellow,styleLine|styleDashed ); //styleNoRescale colorLightGrey
PlotText("-61.80% @ " + fd61_8 , BarCount+1, y0, colorDarkYellow);

// FD100
y0 = y1= fd100[BarCount-1]+1;
Plot(LineArray(x0,y0,x1,y1,0),"",colorDarkYellow,styleLine|styleDashed ); //styleNoRescale colorLightGrey
PlotText("-100.00% @ " + fd100 , BarCount+1, y0, colorDarkYellow);

// FD127_2
y0 = y1= fd127_2[BarCount-1]+1;
Plot(LineArray(x0,y0,x1,y1,0),"",colorDarkYellow,styleLine|styleDashed ); //styleNoRescale colorLightGrey
PlotText("-127.20% @ " + fd127_2 , BarCount+1, y0, colorDarkYellow);

// FD161_8
y0 = y1= fd161_8[BarCount-1]+1;
Plot(LineArray(x0,y0,x1,y1,0),"",colorDarkYellow,styleLine|styleDashed ); //styleNoRescale colorLightGrey
PlotText("-161.80% @ " + fd161_8 , BarCount+1, y0, colorDarkYellow);
/*
// FD261_8
y0 = y1= fd261_8[BarCount-1]+1;
Plot(LineArray(x0,y0,x1,y1,0),"",colorDarkYellow,styleLine|styleDashed ); //styleNoRescale colorLightGrey
PlotText("-261.80% @ " + fd261_8 , BarCount+1, y0, colorDarkYellow);

// FD423_6
y0 = y1= fd423_6[BarCount-1]+1;
Plot(LineArray(x0,y0,x1,y1,0),"",colorDarkYellow,styleLine|styleDashed ); //styleNoRescale colorLightGrey
PlotText("-423.60% @ " + fd423_6 , BarCount+1, y0, colorDarkYellow);
*/
/*

// Setup for Weekly Range
TimeFrameSet(inWeekly);
TOW_        = Open;
PWH_        = Ref(High,-1);
PWL_        = Ref(Low,-1);
PWO_        = Ref(Open,-1);
PWC_        = Ref(Close,-1);
TimeFrameRestore();

TOW         = TimeFrameExpand(TOW_,inDaily,expandFirst);
PWH         = TimeFrameExpand(PWH_,inDaily,expandFirst);
PWL         = TimeFrameExpand(PWL_,inDaily,expandFirst);
PWO         = TimeFrameExpand(PWO_,inDaily,expandFirst);
PWC         = TimeFrameExpand(PWC_,inDaily,expandFirst);

// Weekly High
x0 =BarCount-40;
x1 = BarCount;
y0 = y1= pwh[BarCount-1]+1;
Plot(LineArray(x0,y0,x1,y1,0),"",colorGreen,styleLine|styleNoRescale);
// Weekly Close
y0 = y1= pwc[BarCount-1]+1;
Plot(LineArray(x0,y0,x1,y1,0),"",colorWhite,styleLine|styleNoRescale);
// Weekly Low
y0 = y1= pwl[BarCount-1]+1;
Plot(LineArray(x0,y0,x1,y1,0),"",colorRed,styleLine|styleNoRescale);

PlotText("Weekly High "+ pwh, BarCount+1, pwh[BarCount-1], colorGreen );
PlotText("Weekly Close "+ pwc, BarCount+1, pwc[BarCount-1], colorWhite );
PlotText("Weekly Low "+ pwl, BarCount+1, pwl[BarCount-1], colorRed );

// Setup for Monthly Range
TimeFrameSet(inMonthly);
TOM_        = Open;
PMH_        = Ref(High,-1);
PML_        = Ref(Low,-1);
PMO_        = Ref(Open,-1);
PMC_        = Ref(Close,-1);
TimeFrameRestore();

TOM         = TimeFrameExpand(TOM_,inDaily,expandFirst);
PMH         = TimeFrameExpand(PMH_,inDaily,expandFirst);
PML         = TimeFrameExpand(PML_,inDaily,expandFirst);
PMO         = TimeFrameExpand(PMO_,inDaily,expandFirst);
PMC         = TimeFrameExpand(PMC_,inDaily,expandFirst);

// Monthly High
x0 =BarCount-20;
x1 = BarCount;
y0 = y1= pmh[BarCount-1]+1;
Plot(LineArray(x0,y0,x1,y1,0),"",colorGreen,styleLine|styleNoRescale);
// Monthly Close
y0 = y1= pmc[BarCount-1]+1;
Plot(LineArray(x0,y0,x1,y1,0),"",colorWhite,styleLine|styleNoRescale);
// Monthly Low
y0 = y1= pml[BarCount-1]+1;
Plot(LineArray(x0,y0,x1,y1,0),"",colorRed,styleLine|styleNoRescale);

PlotText("Monthly High "+ pmh, BarCount+1, pmh[BarCount-1], colorGreen );
PlotText("Monthly Close "+ pmc, BarCount+1, pmc[BarCount-1], colorWhite );
PlotText("Monthly Low "+ pml, BarCount+1, pml[BarCount-1], colorRed );
*/
_SECTION_END();
3 comments
Leave Comment
Please login here to leave a comment.
Sir, Vijaybaroda indicates the person i m knowing ?
Multiple errors in the afl
vijay sir,
Please +38.2 is error would you corrects and in daily chart levels are little bit cramp.
please make it larger if possible and last but not least very much thankful to you for this afl as i am searching this afl for long ago.
Thanx