SARVANI.V6 for Amibroker (AFL)
chatpurpose almost 12 years ago Amibroker (AFL)
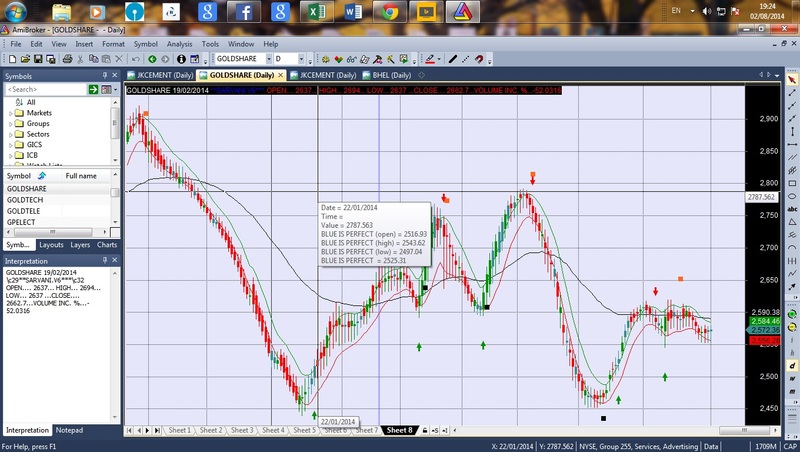
Hi…the candle colour rules are same as SARVANI.V5. Green candle kissing the green line is a good buy, Red candle kissing the red line is a good sell.Teal colour is transition between green to red and vice versa.The boxes indicate MACD crossovers.
The buy and sell logic were totally changed. The buy logic is now based on
ADX and the price crossing the resistance based on EMA. The screenshot is enclosed. The code is based on EOD data, I believe it should work for INTRADAY also. Please rate it if you like it.
Screenshots
Indicator / Formula
Copy & Paste Friendly
MYPERIOD=Param("MYPERIOD",5,5,10,1);
MYO=EMA(O,MYPERIOD);
MYH=EMA(H,MYPERIOD);
MYL=EMA(L,MYPERIOD);
MYC=EMA(C,MYPERIOD)*OBV()/Ref(OBV(),-1);
MYCC=EMA(C,MYPERIOD);
MYV=EMA(V,MYPERIOD);
MYAVG=(MYO+MYH+MYL+MYC)/4;
MYPIVOT=(MYH+MYL+MYC)/3;


PlotOHLC(MYO,MYH,MYL,MYCC,"SARVANI.V6 ",IIf((V>Ref(MYV,-1) AND MYC>MYO),colorGreen,IIf(MYC<MYO,colorRed,colorTeal)),styleCandle);
PlotPR=Param("plotperiod",6,5,10,1);
Plot(EMA(MYH,PlotPR),"",colorGreen,styleLine,0,0);
Plot(EMA(MYL,PlotPR),"",colorRed,styleLine,0,0);
RESIS=Param("MAJOR RESISTANCE",60,30,80,1);
Plot(EMA(MYC,RESIS),"",colorBlack,styleLine,0,0);

Buy=Ref( ADX(),-1)>20 AND PDI()>MDI() AND MYC>2*Ref(MYPIVOT,-1)-Ref(MYL,-1);
Sell=Cross(MDI(),PDI());
Buy=ExRem(Buy,Sell);
Sell=ExRem(Sell,Buy);


PlotShapes(Buy*shapeUpArrow,colorGreen,Layer=0,yposition=MYL,Offset=-50);
PlotShapes(Sell*shapeDownArrow,colorRed,Layer=0,yposition=MYH,Offset=-30);


IND=Cross(MACD(),Signal());
PlotShapes(IND*shapeSmallSquare,colorBlack,0,yposition=L,Offset=-30);
IND1=Cross(Signal(),MACD());
PlotShapes(IND1*shapeSmallSquare,colorOrange,0,Yposition=H,Offset=60);


Title = Name() + " " + Date()+" " + EncodeColor( colorBlue ) +"**SARVANI.V6***" +EncodeColor( colorRed )
+ " OPEN.... " + O + "... HIGH... " + H + "... LOW... " + L + " ...CLOSE.... "+ Close + "...VOLUME INC. %..." + ((V-EMA(V,3))/EMA(V,3))*100 + "\n";
13 comments
Leave Comment
Please login here to leave a comment.
Looks good. Will try ii out. Thanks
gacsekar
@chatpurpose : how is the black line formed in the chart? in many charts the black lines dont appear at all.wondering y its so? wud appreciate if u cud find some time to reply to this :).. thx in advance :)
hi ..nareshpriya , i think your problem is with chart background color. Change the background color to white via tools, preference, axis/grids. you can now see the black line. In some of the charts, chart back ground color is predefined in the afl code itself. In such a case, you have to edit the afl code and change the colour to your preferred colour.
…
hi…the boxes formed by black lines are one feature of amibroker 5.70. I didnt do any thing.
ok.
OK shall reply
Nice AFL , Sir.
You have plotted major resistance line in your AFL ,
Sir also plot major support line . That shall help at buy signal.
Kindly reply.
sure sir, i will look into it. At present, very busy due to EAMCET counselling etc…
good job
thanks
good afl sir.thankz
good job