Volume + Info for Amibroker (AFL)
BrockQAW almost 12 years ago Amibroker (AFL)
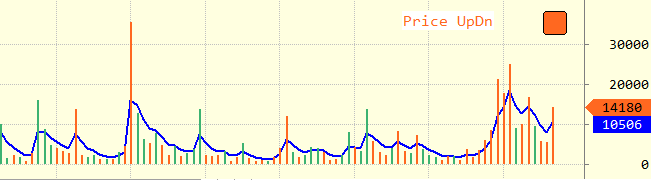
This Chart Plot any styles of realtime volume and somу Info.
Screenshots
Indicator / Formula
Copy & Paste Friendly
GraphXSpace = 8;

_SECTION_BEGIN("Volume");
BarsColor = ParamList ("Chart Color", "Mono|Price|Volume|Bull+Bear");
HistThick = Param("Histogram Thickness", -30, -60, 0, 5);

BullCond  = V>Ref(V,-1) AND C>Ref(C,-1) OR V<Ref(V,-1) AND C<Ref(C,-1);
BearCond  = V>Ref(V,-1) AND C<Ref(C,-1) OR V<Ref(V,-1) AND C>Ref(C,-1);
BuBeColor = IIf(BullCond, colorseaGreen, IIf(BearCond, colorOrange, colorLightBlue));

if      (BarsColor == "Mono")		{ BarColors=colorLightBlue; Msg = "Mono"; }
else if (BarsColor == "Price")		{ BarColors=IIf(C>O, colorseaGreen, colorOrange); Msg = "Price UpDn"; }
else if (BarsColor == "Volume")		{ BarColors=IIf(V>Ref(V, -1), colorseaGreen, colorOrange);  Msg = "Volume UpDn"; }
else if (BarsColor == "Bull+Bear")	{ BarColors=BuBeColor; Msg = "Bull or Bear";  }

SetBarFillColor(BarColors);
Plot(V,"Volume", BarColors, styleHistogram, Null, Null, 0, 1, HistThick);
//VL     = LastValue(Volume);
VLCol  = LastValue(BarColors);
VAvCol = colorBlue;

VAv = (round(EMA(V,Param("Average Period", 4, 1, 100, 1)) )/10)*10;
Plot(VAv, "Volume Average", VAvCol, styleThick, Null, Null, 0, 0, width = -15);

// INFO
// If last Volume bar > Volume average, then rectangle color is infCol
// If last Volume bar < Volume average, then rectangle color is VAvCol
diffVol = V - VAv;
infCol    = LastValue( IIf(diffVol >= 0, VLCol, VAvCol) );
FillColor = LastValue(BarColors);
GfxSetTextColor(colorBlack);
GfxSelectPen(colorBlack, 1);
GfxSelectSolidBrush(infCol);
X0 = Status("pxwidth") - 110; Y0 = 10;
GfxRoundRect(X0,Y0,X0+24,Y0+24,6,6);
GfxSelectFont("Consolas", 12, 400);
GfxSetTextColor(infCol);
GfxTextOut(Msg, X0 - 140, Y0);
_SECTION_END();
4 comments
Leave Comment
Please login here to leave a comment.
Hi,
The AFL is giving the following errors which may kindly be corrected and posted back please.
LN: 17, Col: 72: Error 16. Too many arguments
LN 23, Col: 76: Error 16. Too many arguments
Best regards,
Vishnu Vandana
Hi! Thanks for your reply.
This is an original AFL 1.8 Help string for Plot operator:
Plot(array, name, color/barcolor, style = styleLine, minvalue = {empty}, maxvalue = {empty}, XShift = 0, Zorder = 0, width = 1 )
This is my adaptation to Volume script of line 17:
Plot(V,“Volume”, BarColors, styleHistogram, Null, Null, 0, 1, HistThick);
All is correct. You can modify script for previous AFL version as:
line 17:
Plot(V,“Volume”, BarColors, styleHistogram);
line 23:
Plot(VAv, “Volume Average”, VAvCol, styleThick);
Reply if you want.
still not working same error
You can replace codes as:
Line 17:
Plot(V,“Volume”, BarColors, styleHistogram); //, Null, Null, 0, 1, HistThick);
Line23:
Plot(VAv, “Volume Average”, VAvCol, styleThick); //, Null, Null, 0, 0, width = -15);