Elliott Wave with Explorations for Amibroker (AFL)
nalin Soni over 11 years ago Amibroker (AFL)
Hello,
Elliott Wave with Exploration Submitting All of You,
Here Major Elliott Wave and Minor Elliott Wave both can be Explore,
If I request All of You Please Follow Major Moves.
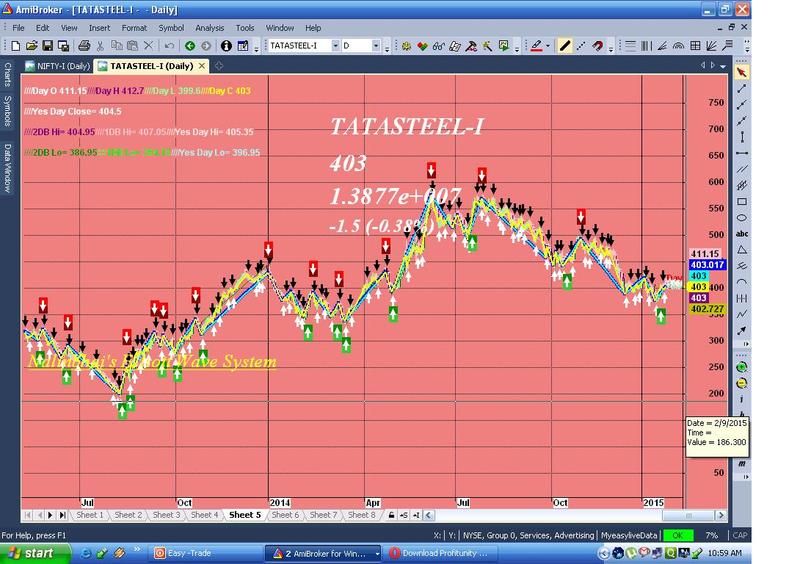
Screenshots
Indicator / Formula
Copy & Paste Friendly
//////////////////////////////////////////////////////////////////////////////////////////////////////////////////////////////////////////////

_SECTION_BEGIN( "Nalinbhai's Elliott Wave System" );

// my Mail ID  :  nalinsoni20000@gmail.com

GfxSetBkMode(1);
GfxSetTextColor( colorYellow);
GfxSelectFont( "Times New Roman", 20, 1, 500, True );
GfxTextOut( "Nalinbhai's Elliott Wave System", 10 , 375 );

_SECTION_END();

//////////////////////////////////////////////////////////////////////////////////////////////////////////////////////////////////////////////

GraphXSpace=Param("GraphXSpace",15,-50,50,1);

//////////////////////////////////////////////////////////////////////////////////////////////////////////////////////////////////////////////

_SECTION_BEGIN("ZIG-ZAG");
P = ParamField( "ZIG Price field" );
change = Param("% change",1.0,0.25,25,0.25);

Color1 =(ParamColor("Slaller Elliott Wave1",colorYellow));
Plot( zz=DEMA(Zig(P, change),1), _DEFAULT_NAME(), Color1, styleLine+styleThick) ;

Color2 =(ParamColor("Slaller Elliott Wave2",ColorRGB(195, 195, 0 )));
Plot( zz=DEMA(Zig(P, change),2), _DEFAULT_NAME(), Color2, styleLine+styleThick) ;


Buy1  = Cross(DEMA(Zig(P, change), 1), MA(Zig(P, change), 2)) OR
        DEMA(Zig(P, change), 1) > MA(Zig(P, change), 2);

Sell1 = Cross(DEMA(Zig(P, change), 2), MA(Zig(P, change), 1)) OR
        DEMA(Zig(P, change), 2) > MA(Zig(P, change), 1);


BuyPrice1 =ValueWhen(Buy1,  (H+L)/2);
SellPrice1=ValueWhen(Sell1, (H+L)/2);


Buy1  = ExRem(Buy1,Sell1);
Sell1 = ExRem(Sell1,Buy1);


PlotShapes( shapeUpArrow *    Buy1, colorWhite, 0, Low  );
PlotShapes( shapeDownArrow * Sell1, colorBlack, 0, High );


//////////////////////////////////////////////////////////////////////////////////////////////////////////////////////////////////////////////


_SECTION_BEGIN("ZIG-ZAG1");
P1 = ParamField( "ZIG Price field" );
change1 = Param("% change1",4.5,0.25,25,0.25);

Color3 =(ParamColor("Larger Elliott Wave1",colorCustom11));
Plot( zz=TEMA(Zig(P1, change1),1), _DEFAULT_NAME(), Color3, styleLine+styleThick) ;

Color4 =(ParamColor("Larger Elliott Wave2",colorBlue));
Plot( zz=TEMA(Zig(P1, change1),2), _DEFAULT_NAME(), Color4, styleLine+styleDots+styleThick) ;

/*
Buy  = Cross(TEMA(Zig(P1, change1),1), TEMA(Zig(P1, change1),2)) ;
Sell = Cross(TEMA(Zig(P1, change1),2), TEMA(Zig(P1, change1),1)) ;


PlotShapes(IIf(Buy,  shapeSquare,  shapeNone),colorGreen,     0,L, Offset=-25);
PlotShapes(IIf(Buy,  shapeSquare,  shapeNone),colorLime,      0,L, Offset=-35);
PlotShapes(IIf(Buy,  shapeUpArrow, shapeNone),colorWhite,     0,L, Offset=-30);

PlotShapes(IIf(Sell, shapeSquare,  shapeNone),colorDarkRed,   0,H, Offset= 25);
PlotShapes(IIf(Sell, shapeSquare,  shapeNone),colorRed,       0,H, Offset= 35);
PlotShapes(IIf(Sell, shapeDownArrow,shapeNone),colorWhite,    0,H, Offset=-30);


BuyPrice =ValueWhen(Buy, (L+L+L+H)/4);
SellPrice=ValueWhen(Sell,(L+H+H+H)/4);


Buy  = ExRem(Buy,Sell);
Sell = ExRem(Sell,Buy);


if(SelectedValue(Buy))
{
	StaticVarSet( "tmp", 1 );
	PlaySound("C:\\Program Files\\AmiBroker\\sound\\buy.wav");
	Say("Buy Buy buy");
	SetChartBkColor(ColorRGB(143,188,143));
}
if(SelectedValue(Sell))
{
	StaticVarSet( "tmp", 0 );
	PlaySound("C:\\Program Files\\AmiBroker\\sound\\sell.wav");
	Say("sell sell sell");
	SetChartBkColor(ColorRGB(240,128,128));
}
if(StaticVarGet("tmp")==1)
{
	SetChartBkColor(ColorRGB(143,188,143));
}
else
{
	SetChartBkColor(ColorRGB(240,128,128));
}


if(Status("action") == actionExplore)


Filter = ( Buy OR Sell ) ;


SetOption("NoDefaultColumns", True);

AddTextColumn(Name(), "  S y m b o l  ");

AddColumn(DateTime(), "  D a t e  ", formatDateTime);

AddColumn(LastValue(C),"Currant",1.0,colorBlack,colorTan);

AddColumn( IIf( Buy, BuyPrice, Null ),   "Mega Buy by Larger Wave ",  1.2, textColor = colorWhite, bkgndColor = colorDarkGreen );


AddColumn( IIf( Sell, SellPrice, Null ), "Mega Sellby Larger Wave",  1.2, colorYellow, bkgndColor = colorViolet );
*/
//////////////////////////////////////////////////////////////////////////////////////////////////////////////////////////////////////////////

_SECTION_BEGIN("AUTO SEC Version 1.2");

//--Level 3
//Kook Auto SEC
//AUTO SEC Version 1.0//
// v.1.0 Created By Kook 16 Nov 2005 //
// v.1.1 1st Update By Kook 17 Nov 2005 //
// v.1.2 2nd Update By Kook 20 Nov 2005 //Bugs(Last SEC) reported from Mink

Heading="AUTO SEC Version 1.2";

SECUpColor=ParamColor("SEC-UpColor",colorGreen);
SECDnColor=ParamColor("SEC-DownColor",colorRed);
SECLastColor=ParamColor("SEC-LastColor",10);
BckGndColor=ParamColor("BackGroundColor",colorBlack);
ZZSwitch=Param("ZZSwitch",0,0,1,1);
Sens=Param("Sens",4.75, 0.5, 15, 0.25);
SECSwitch=Param("SECSwitch",1,0,1,1);

BarPK=BarsSince(Zig(C,Sens)==Peak(C,Sens));
BarTGH= BarsSince(Zig(C,Sens)==Trough(C,Sens));
Turnpoint=Min(BarPK,BarTGH);
x = Cum(1);
lastx = ValueWhen(Turnpoint==0,( x ));
Daysback = ValueWhen(Turnpoint==0,(Max(PeakBars(C,Sens,1),TroughBars(C,Sens,1))))+1;

aa =ValueWhen(Turnpoint==0,LinRegIntercept( Close, Daysback) );
bb =ValueWhen(Turnpoint==0,LinRegSlope( Close, Daysback));
y = Aa + bb * ( x - (Lastx - DaysBack+1) );

e= ValueWhen(Turnpoint==0,StdErr(C,Daysback));
eU= y + 2*e;
eL= y - 2*e;

ColorSEC=IIf(Cross(bb,0) OR Cross(0,bb),colorBlack,IIf(bb<0,colorRose,SECUpColor));

//Plot(IIf( x >= (lastx - Daysback), IIf( Ref(C,-1) <eU AND Ref(C,-1) >eL,y,Null) ,  -1e10 ) , "LinReg", colorSEC,1 );
//Plot(IIf( x >= (lastx - Daysback), IIf( Ref(C,-1) <eU AND Ref(C,-1) >eL,eU,Null) , -1e10 ) ,"",ColorSEC,1);
//Plot(IIf( x >= (lastx - Daysback), IIf( Ref(C,-1) <eU AND Ref(C,-1) >eL,eL,Null) , -1e10 ) ,"",ColorSEC,1);


//PlotShapes(shapeUpArrow*Cross(C,eU),colorWhite,0,L,Offset=-40);
//PlotShapes(shapeDownArrow*Cross(eL,C),colorWhite,0,H,Offset=-40);
//PlotShapes(shapeDigit3*Cross(C,eU),colorWhite,0,L,Offset=-55);
//PlotShapes(shapeDigit3*Cross(eL,C),colorWhite,0,H,Offset=55);

DaysbackL = LastValue(Min(PeakBars(C,Sens,1),TroughBars(C,Sens,1)));

Slope= ValueWhen(Turnpoint==0,bb,0);
Level= ValueWhen(Turnpoint==0,aa,0);
Err= ValueWhen(Turnpoint==0,e,0);

Mback= Level + slope*( Turnpoint) ;
Uback= MBack + 2*Err;
Lback= MBack - 2*Err;

ColorSEC2=IIf(Cross(bb,0) OR Cross(0,bb),colorBlack,IIf(bb<0,SECUpColor,colorRose));

//Plot( IIf( (X>(LastValue(x)-DaysbackL) ),Null ,Uback) ,"",ColorSEC2);
Plot( IIf( (X>(LastValue(x)-DaysbackL) ),Null ,Mback) ,"",ColorSEC2);
//Plot( IIf( (X>(LastValue(x)-DaysbackL) ),Null ,Lback) ,"",ColorSEC2);


Buy  = Cross(C,eU) OR C > eU;
Sell = Cross(eL,C) OR C < eU;


BuyPrice =ValueWhen(Buy, (L+L+L+H)/4);
SellPrice=ValueWhen(Sell,(L+H+H+H)/4);


Buy  = ExRem(Buy,Sell);
Sell = ExRem(Sell,Buy);


if(SelectedValue(Buy))
{
	StaticVarSet( "tmp", 1 );
	PlaySound("C:\\Program Files\\AmiBroker\\sound\\buy.wav");
	Say("Buy Buy buy");
	SetChartBkColor(ColorRGB(143,188,143));
}
if(SelectedValue(Sell))
{
	StaticVarSet( "tmp", 0 );
	PlaySound("C:\\Program Files\\AmiBroker\\sound\\sell.wav");
	Say("sell sell sell");
	SetChartBkColor(ColorRGB(240,128,128));
}
if(StaticVarGet("tmp")==1)
{
	SetChartBkColor(ColorRGB(143,188,143));
}
else
{
	SetChartBkColor(ColorRGB(240,128,128));
}

PlotShapes(IIf(Buy,  shapeSquare,  shapeNone),colorGreen,     0,L, Offset=-25);
PlotShapes(IIf(Buy,  shapeSquare,  shapeNone),colorLime,      0,L, Offset=-35);
PlotShapes(IIf(Buy,  shapeUpArrow, shapeNone),colorWhite,     0,L, Offset=-30);

PlotShapes(IIf(Sell, shapeSquare,  shapeNone),colorDarkRed,   0,H, Offset= 25);
PlotShapes(IIf(Sell, shapeSquare,  shapeNone),colorRed,       0,H, Offset= 35);
PlotShapes(IIf(Sell, shapeDownArrow,shapeNone),colorWhite,    0,H, Offset=-30);


if(Status("action") == actionExplore)


Filter = ( Buy OR Sell ) | ( Buy1 OR Sell1 );


SetOption("NoDefaultColumns", True);


AddTextColumn(Name(), "  S y m b o l  ");


AddColumn(DateTime(), "  D a t e  ", formatDateTime);


AddColumn(LastValue(C),"Currant",1.0,colorBlack,colorTan);


AddColumn( IIf( Buy, BuyPrice, Null ),   "Mega Buy by Larger Wave ",  1.2, textColor = colorWhite, bkgndColor = colorDarkGreen );

AddColumn( IIf( Buy1, BuyPrice1, Null ),  "Buy by Smaller Wave ",  1.2, textColor = colorWhite, bkgndColor = colorGreen );


AddColumn( IIf( Sell, SellPrice, Null ), "Mega Sellby Larger Wave",  1.2, colorYellow, bkgndColor = colorViolet );

AddColumn( IIf( Sell1, SellPrice1, Null ), "Sellby Smaller Wave",  1.2, colorYellow, bkgndColor = colorBrown );

_SECTION_END();

//////////////////////////////////////////////////////////////////////////////////////////////////////////////////////////////////////////////

_SECTION_BEGIN("In Daily Price");
SetChartOptions(0,chartShowArrows|chartShowDates);
_N(Title = StrFormat("{{NAME}} - {{INTERVAL}} {{DATE}} Open %g, Hi %g, Lo %g, Close %g (%.1f%%) {{VALUES}}",
           O, H, L, C, SelectedValue( ROC( C, 1 ) ) ));

TimeFrameSet(inDaily);
MA3 = MA(C,3);
Cl = C;
TimeFrameRestore();
MA3=(TimeFrameExpand( MA3, inDaily));
Cl=(TimeFrameExpand( Cl, inDaily));
barcolor =IIf(C > O , colorPaleGreen,IIf(C < O,colorPink, colorBlack ) );

PlotOHLC( IIf(Open<Close, Open, Close),High,Low,
           IIf(Open<Close, Close, Open), "Close", barColor, styleBar+styleThick+styleNoTitle );

_SECTION_END();

//////////////////////////////////////////////////////////////////////////////////////////////////////////////////////////////////////////////

_SECTION_BEGIN("Price, Hawamer");

SetBarsRequired(sbrAll);
daynum= Now(9);//day of the week
SatSun= IIf((daynum==1 OR daynum==7),1,0);
dec= IIf(StrRight(Name(),3) == "", 3.2, 3.2);
dec= (Param("Decimals",2,0,7,1)/10)+1;
uc= ParamColor("Up Candle Fill Color",19);
dc= ParamColor("Dn Candle Fill Color",24);
nc= ParamColor("Neutral Fill Color",16);
bc= BarCount-1;
x= BarIndex();
Lx= LastValue(x);
sx= SelectedValue(x);
//==============================
SetBarFillColor(IIf(C>O,ColorRGB(0, 230, 0),IIf(C<O,ColorRGB(230, 0, 0 ),nc)));
Plot(C,"",IIf(C>O,19,IIf(C<O,38,16)),64);

_SECTION_END();

//////////////////////////////////////////////////////////////////////////////////////////////////////////////////////////////////////////////

// Current Days Hi Lo //

numbars = LastValue( Cum( Status( "barvisible" ) ) );
fraction = IIf( StrRight( Name(), 3 ) == "", 3.2, 3.2 );

//THL = ParamToggle("Todays Hi Lo","Show|Hide",1);
//if(THL==1)
{
  isRth = TimeNum() >= 084500 & TimeNum() <= 085959;
  isdRth = TimeNum() >= 084500 & TimeNum() <= 160000;
  aRthL = IIf(isRth, L, 1000000);
  aRthH = IIf(isdRth, H, Null);
  aRthLd = IIf(isdRth, L, 1000000);


  DH = TimeFrameGetPrice( "H", inDaily );
  DHI = LastValue (DH,1);
  DL = TimeFrameGetPrice( "L", inDaily );
  DLI = LastValue (DL,1);

  PlotText(" Day Hi =" + WriteVal( DHI, fraction ), 	LastValue(BarIndex())+2, DHI  +0.05, ColorRGB(210, 0, 0 ));
  PlotText(" Day Lo =" + WriteVal( DLI, fraction ), 	LastValue(BarIndex())+2, DLI  +0.05, colorPaleGreen);
 }

//////////////////////////////////////////////////////////////////////////////////////////////////////////////////////////////////////////////

//Previous Days HI LO //

numbars = LastValue( Cum( Status( "barvisible" ) ) );
fraction = IIf( StrRight( Name(), 3 ) == "", 3.2, 3.2 );

DC = TimeFrameGetPrice( "C", inDaily); // close

DH = TimeFrameGetPrice( "H", inDaily );

DL = TimeFrameGetPrice( "L", inDaily );

PP = ( DL + DH + DC ) / 3;

PPI = LastValue ( PP, 1 );   // Pivot

DayH = TimeFrameGetPrice( "H", inDaily, -1 );

DayHI = LastValue ( DayH, 1 );// yesterdays high

DayL = TimeFrameGetPrice( "L", inDaily, -1 );

DayLI = LastValue ( DayL, 1 );	// yesterdays low

DayC = TimeFrameGetPrice( "C", inDaily, -1 );

DayCI = LastValue ( DayC, 1 );	// yesterdays close

DayO = TimeFrameGetPrice( "O", inDaily );			// current day open

DayH2 = TimeFrameGetPrice( "H", inDaily, -2 );

DayH2I = LastValue ( DayH2, 1 ); // Two days before high

DayL2 = TimeFrameGetPrice( "L", inDaily, -2 );

DayL2I = LastValue ( DayL2, 1 );  // Two days before low

DayH3 = TimeFrameGetPrice( "H", inDaily, -3 );

DayH3I = LastValue ( DayH3, 1 );  // Three days before high

DayL3 = TimeFrameGetPrice( "L", inDaily, -3 );

DayL3I = LastValue ( DayL3, 1 );  // Three days before low

numbars = LastValue( Cum( Status( "barvisible" ) ) );

hts  = -33.5;

YHL = ParamToggle( "Yesterday HI LO", "Hide|Show", 1 );

if ( YHL == 1 )
{

    //Plot( DayO, "DO", colorCustom12,  styleDots | styleNoLine | styleNoRescale  );
    //Plot( DayL, "YL", colorPaleTurquoise, styleDots | styleNoLine | styleNoRescale  );
    //Plot( DayH, "YH", colorOrange,        styleDots | styleNoLine | styleNoRescale  );

    PlotText( " Yes Day High =" + WriteVal( DayH, fraction ), 	LastValue( BarIndex() ) + 1, DayHI,  colorRose );
    PlotText( " Yes Day Low  =" + WriteVal( DayL, fraction ), 	LastValue( BarIndex() ) + 1, DayLI,  colorPaleTurquoise );
    PlotText( " Yes Day C    =" + WriteVal( DayL, fraction ), 	LastValue( BarIndex() ) + 4, DayCI, colorWhite );
}

TDBHL = ParamToggle( "2/3Days before HI LO", "Hide|Show", 1 );

if ( TDBHL == 1 )
{
    //Plot( DayL2, "2DBL", colorBrightGreen, styleDots | styleNoLine | styleNoRescale  );
    //Plot( DayH2, "2DBH", colorRed, styleDots | styleNoLine | styleNoRescale  );
    //Plot( DayL3, "3DBL", colorGreen, styleDots | styleNoLine | styleNoRescale  );
    //Plot( DayH3, "3DBH", colorViolet , styleDots | styleNoLine | styleNoRescale  );

    //PlotText( " 1DB Hi =" + WriteVal( DayH2, fraction ), 	LastValue( BarIndex() ) - 3, DayH2I, colorPink );
    //PlotText( " 1DB Lo =" + WriteVal( DayL2, fraction ), 	LastValue( BarIndex() ) - 3, DayL2I, colorBrightGreen );
    //PlotText( " 2DB Hi =" + WriteVal( DayH3, fraction ), 	LastValue( BarIndex() ) - 3, DayH3I, colorViolet );
    //PlotText( " 2DB Lo =" + WriteVal( DayL3, fraction ), 	LastValue( BarIndex() ) - 3, DayL3I, colorGreen );
}

//////////////////////////////////////////////////////////////////////////////////////////////////////////////////////////////////////////////

Title =

"\n" +

EncodeColor( colorBlack ) +  //Date() + "\n" + "\n" +
EncodeColor( colorWhite)      + "////Day O " + EncodeColor(colorWhite)  + O +
EncodeColor( colorViolet)     + "////Day H " + EncodeColor(colorViolet) + DHI +
EncodeColor( colorPaleGreen)  + "////Day L " + EncodeColor(colorPaleGreen)  + DLI +
EncodeColor( colorYellow)     + "////Day C " + EncodeColor(colorYellow) + C + "\n" + "\n" +
EncodeColor( colorWhite )     + "////Yes Day Close= " + EncodeColor( colorWhite )  + DayCI + "\n" + "\n" +
EncodeColor( colorViolet )    + "////2DB Hi= " + EncodeColor( colorViolet )  + DayH3I +
EncodeColor( colorPink   )    + "////1DB Hi= " + EncodeColor( colorPink    )  + DayH2I +
EncodeColor( colorRose   )    + "////Yes Day Hi= " + EncodeColor( colorRose)  + DayHI + "\n" + "\n" +
EncodeColor( colorGreen   )   + "////2DB Lo= " + EncodeColor( colorGreen  )   + DayL3I +
EncodeColor( colorBrightGreen   )+ "////1DB Lo= " + EncodeColor( colorBrightGreen  )  + DayL2I +
EncodeColor( colorPaleTurquoise )+ "////Yes Day Lo= " + EncodeColor( colorPaleTurquoise) + DayLI ;

//////////////////////////////////////////////////////////////////////////////////////////////////////////////////////////////////////////////

_SECTION_BEGIN( "Magnified Market Price" );
//by Vidyasagar, vkunisetty@yahoo.com//
FS = Param( "Font Size", 25, 11, 100, 1 );
GfxSelectFont( "Times New Roman", FS, 700, True );
GfxSetBkMode( colorWhite );
GfxSetTextColor( ParamColor( "Color", colorWhite ) );
Hor = Param( "Horizontal Position", 420, 1, 1200, 1 );
Ver = Param( "Vertical Position", 100, 1, 830, 1 );
GfxTextOut( "" + C, Hor , Ver );
GfxTextOut( Name(), Hor, Ver-50 );

GfxSetTextColor( ParamColor( "ColorY", colorWhite ) );
GfxTextOut( "" + V, Hor , Ver + 45 );

YC = TimeFrameGetPrice( "C", inDaily, -1 );
DD = Prec( C - YC, 2 );
xx = Prec( ( DD / YC ) * 100, 2 );
GfxSelectFont( "Times New Roman", 20, 700, True );
GfxSetBkMode( colorWhite );
GfxSetTextColor( ParamColor( "Color", colorRed ) );
GfxTextOut( "" + DD + " (" + xx + "%)", Hor , Ver + 90 );

_SECTION_END();

//////////////////////////////////////////////////////////////////////////////////////////////////////////////////////////////////////////////
8 comments
Leave Comment
Please login here to leave a comment.
Thank You
Natin . . .
Please email me for some comments and optimization I did.
Thank you, RBuckGray@gmail.com
Hi Nalin,
I noticed a funny problem. The Buy/Sell arrow coming on expired candle stick. Today I noticed between 9:15 to 9:55 no arrow appeared but at 10AM suddenly SELL arrow appeared on 9:35AM candle bar, means after 25 min arrow appeared on very previous candle.
Pls see whats wrong in the AFL.
Firstly, The exploration BUY/SELL value and the BUY/SELL signal appearance on chart is totally different.
Secondly, BUY/SELL arrow not appearing on REAL TIME. There is a delay around 30-45 min.
Thirdly, Mega BUY/SELL arrow not appearing on 5/15/30/Hourly time frame. But iin Exploration it shows.
Pls review the AFL if these can be modified in that case this AFL will be superb.
thank you Nalinbhai
Future
Thank you how to do exploration it will freeze when i do it
Will you please explain, when to exit and targets for major and minor waves?