Secret Method for Amibroker (AFL)
ashetty033 about 11 years ago Amibroker (AFL)
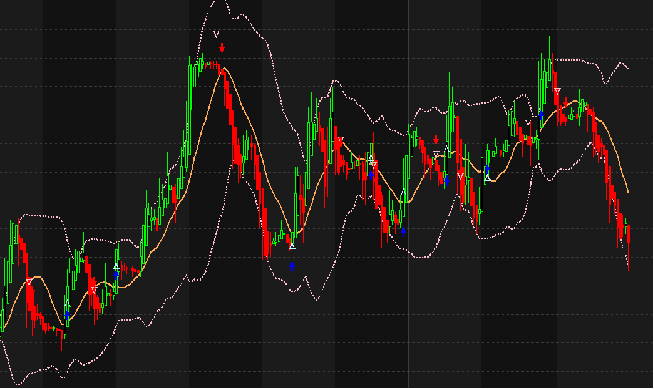
Based on Russ Horn’s Secret Method Strategy
Screenshots
Indicator / Formula
Copy & Paste Friendly
_SECTION_BEGIN("HA Looping ( no AMA() )");
///////////////////////////////////////////////////////////
// Heikin Ashi - Calculated Properly without using AMA
// JF Derzi, December 2012

HaClose[0] = (Open[0]+High[0]+Low[0]+Close[0]) / 4;
HaOpen[0]  = (HaClose[0] + Open[0]) / 2;
HaHigh[0]  = Max( High[0], Max( HaClose[0], HaOpen[0] ) );
HaLow[0]   = Min( Low[0], Min( HaClose[0], HaOpen[0] ) );

for (i = 1; i < BarCount; i++)
{
HaClose[i] = (Open[i]+High[i]+Low[i]+Close[i]) / 4;
Haopen[i]  = (HaClose[i-1] + HaOpen[i-1]) / 2;
// Here is the problem when using Arrays: Haopen always uses its own previous value
HaHigh[i]  = Max( High[i], Max( HaClose[i], HaOpen[i] ) );
Halow[i]   = Min( Low[i], Min( HaClose[i], HaOpen[i] ) );
}

PlotOHLC( HaOpen, HaHigh, HaLow, HaClose, "", colorBlack, styleCandle);
(Title = StrFormat("{{NAME}} - {{INTERVAL}} {{DATE}} Open %g, Hi %g, Lo %g, Close %g (%.1f%%) {{VALUES}}", O, H, L, C, SelectedValue( ROC( C, 1 ) ) ));
_SECTION_END();

_SECTION_BEGIN("MA");
Periods = Param("Periods", 14, 2, 300, 1, 10 );
simpleMA = MA( HaClose, Periods );
Plot( simpleMA, "MA2", ParamColor( "Color", colorCycle ), ParamStyle("Style") ); _SECTION_END();
_SECTION_END();

_SECTION_BEGIN("OSMA");
// osma implementation for Amibroker
// version 0.2 (c) 28th April 2011, xytise@gmail.com

FastEma=Param("Fast EMA", 12, 1 , 25, 1);
SlowEma=Param("Slow EMA", 26, 1 , 50, 1);
SignalEma=Param("Signal EMA", 9, 1 , 25, 1);
// signals
OsMA=MACD( FastEma, SlowEma )-Signal( FastEma, SlowEma, SignalEma );
// Plot removed
_SECTION_END();

_SECTION_BEGIN("Momentum");
momentum = HaClose * 100 / Ref(HaClose, -Param("Period", 10, 1, 100 ) );
// Plot removed
_SECTION_END();

_SECTION_BEGIN("RSIa");
periods = Param("Periods", 5, 1, 200, 1 );
rxRsi =  RSIa( HaClose, periods);
_SECTION_END();

longCond1 = Cross(HaClose, simpleMA);
longCond2 = OsMA > 0;
longCond3 = momentum > 100;
longCond4 = rxRsi > 50;
//PlotShapes(longCond1 * shapeDigit1, colorBlue, 0, HaLow - 5);
//PlotShapes(longCond2 * shapeDigit2, colorBlue, 0, HaLow - 10);
//PlotShapes(longCond3 * shapeDigit3, colorBlue, 0, HaLow - 15);
//PlotShapes(longCond4 * shapeDigit4, colorBlue, 0, HaLow - 20);

Buy = ((HaOpen < HaClose) AND (HaClose>simpleMA) AND (OsMA > 0) AND (momentum > 100) AND (rxRsi > 50));
Sell = ((HaOpen > HaClose) AND (OsMA <= 0));
Short = ((HaOpen > HaClose) AND (HaClose<simpleMA) AND (OsMA < 0) AND (momentum < 100) AND (rxRsi < 50));
Cover = ((HaOpen < HaClose) AND (OsMA >= 0));


Buy=ExRem(Buy,Sell);
Short=ExRem(Short,Cover);
Sell=ExRem(Sell,Buy);
Cover=ExRem(Cover,Short);

PlotShapes(Buy*shapeUpArrow,colorBlue,0,L,-21);
PlotShapes(Sell*shapeHollowSmallDownTriangle,colorPink,0,L,-51);
PlotShapes(Short*shapeDownArrow,colorRed,0,H,-21);
PlotShapes(Cover*shapeHollowSmallUpTriangle,colorSkyblue,0,H,-51);


Filter = Buy OR Sell OR Short OR Cover;
AddColumn(IIf(Buy, BuyPrice, 0),  "Buy", 6.2);
AddColumn(IIf(Sell, SellPrice, 0),  "Sell", 6.2);
AddColumn(IIf(Short, ShortPrice, 0),  "Short", 6.2);
AddColumn(IIf(Cover, CoverPrice, 0),  "Cover", 6.2);
AddColumn(Close,"Close",1.2);

_SECTION_BEGIN("Bollinger Bands");
P = ParamField("Price field",-1);
Periods = Param("Periods", 20, 2, 300, 1 );
Width = Param("Width", 2, 0, 10, 0.05 );
Color = ParamColor("Color", colorCycle );
Style = ParamStyle("Style");
Plot( BBandTop( P, Periods, Width ), "BBTop" + _PARAM_VALUES(), Color, Style );
Plot( BBandBot( P, Periods, Width ), "BBBot" + _PARAM_VALUES(), Color, Style );
_SECTION_END();
3 comments
Leave Comment
Please login here to leave a comment.
VERY
GOOD
AFL
VERY NICE INDEED
ARE YOU ABLE TO CODE THIS ONE
https://www.tradingview.com/script/ngr0qRmw-CM-Laguerre-PPO-PercentileRank-Mkt-Tops-Bottoms/ ?
Why the AFL was showing blank screen Please let me know how to plot the given script on candlesticks..