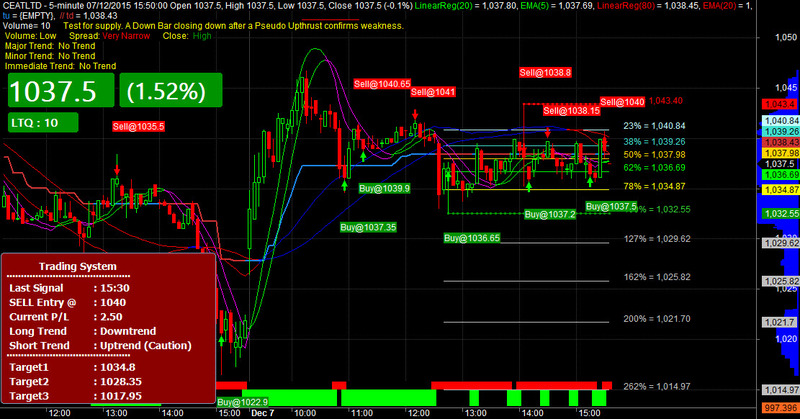
Intraday Profit Maker (Best with Automation) for Amibroker (AFL)
xesachin over 10 years ago Amibroker (AFL)
Modified version of MACD for intraday profits, especially during side trends.
Voice and popup alerts
Dashboard w/ targets
Volume profiler
Sentiments indicator
Pivot points (need to be enabled in parameters)
Analysis commentary of candle sticks
Best used for automated trade. I tested it with NEST automation. If you are not aware of NEST trade automation, please contact me.
Thanks to the authors of original code writer for base version.
Screenshots
Indicator / Formula
Copy & Paste Friendly
//================= CUSTOM STRATEGY FOR SACHIN BHATIA V1.0 ===============
//
//########################################################################
// SETUP INTIAL PARAMETERS
//########################################################################
//
DisplayAlerts = ParamToggle("Pop up Alerts","Off|On",1);
VoiceAlerts = ParamToggle("Voice Alerts","Off|On",0);

timeout = 1000;

StaticVarSetText( "CurrPos", "" );

function GetSecondNum()
{
    Time = Now( 4 );
    Seconds = int( Time % 100 );
    Minutes = int( Time / 100 % 100 );
    Hours = int( Time / 10000 % 100 );
    SecondNum = int( Hours * 60 * 60 + Minutes * 60 + Seconds );
    return SecondNum;
}

function PopupWindowEx( popupID, bodytext, captiontext, timeout, left, top )
{
    displayText = bodytext + captiontext;

    if ( ( StaticVarGetText( Name() + "prevPopup" + popupID ) != displayText ) OR ( StaticVarGet( Name() + "prevPopupTime" + popupID ) < GetSecondNum() ) )
    {
        StaticVarSetText( Name() + "prevPopup" + popupID, displayText );
        StaticVarSet( Name() + "prevPopupTime" + popupID, GetSecondNum() + timeout );
        if (DisplayAlerts ==1) {
			PopupWindow( bodytext, Captiontext + popupID, timeout, Left, top );
        	PlaySound( "c:\\windows\\media\\ding.wav" );
		 }
		 if (VoiceAlerts ==1) Say (bodytext);
    }
}


//=============================SETUP TREND======================================
//SetBarsRequired(100000,0);
pds = 20;
MAFAST = EMA( Close, 20 );
MASLOW = EMA( Close, 40 );

DonchianUpper = HHV( Ref( H, -1 ), pds ); // Highest high value of highs in last 20 periods
DonchianLower = LLV( Ref( L, -1 ), pds ); // Lowest low value of low in last 20 periods
DonchianMiddle = ( DonchianUpper + DonchianLower ) / 2;

UpTrend = C > ( LLV( L, 20 ) + 2 * ATR( 10 ) ) AND EMA( Close, 20 ) > EMA( Close, 40 );
DnTrend = C < ( HHV( H, 20 ) - 2 * ATR( 10 ) ) AND EMA( Close, 20 ) < EMA( Close, 40 );
Color = IIf( UpTrend, colorGreen, IIf( DnTrend, colorRed, colorCustom10 ) );

// Plots a 20 period Donchian channel
//Plot( C, "Price", Color, styleBar | styleThick );


//=============================DISPLAY PARAMS======================================
_SECTION_BEGIN("Price");
 Buy=Sell=Short=Cover=0;
SetChartOptions(0,chartShowArrows|chartShowDates);
_N(Title = StrFormat("{{NAME}} - {{INTERVAL}} {{DATE}} Open %g, High %g, Low %g, Close %g (%.1f%%) {{VALUES}}", O, H, L, C, SelectedValue( ROC( C, 1 ) ) ));
Plot( C, "Close", ParamColor("Color", colorBlack ), styleNoTitle | ParamStyle("Style") | GetPriceStyle() );
_SECTION_END();

_SECTION_BEGIN("Magnified Market Price");
procedure DrawData (Text, x1, y1, x2, y2, BoxColor, FontSize)
{
	GfxSetOverlayMode(0);
	GfxSelectFont("Segoe UI", FontSize, 600);
	//FS=Param("Font Size",FontSize,FontSize,100,1);
	//GfxSelectFont("Segoe UI", FS, 900, italic = False, underline = False, True );
	GfxSetBkMode(1);
	//GfxGradientRect(x1, y1, x2, y2, colorFrom, colorTo);
	GfxSelectSolidBrush( BoxColor);
	GfxRoundRect( x1, y1, x2, y2, 7, 7 );
	GfxDrawText(Text, x1, y1, x2, y2, 32|0|4|16);
}
GfxSetTextColor(colorWhite);

if(StaticVarGetText("firstflag")=="")
{
	StaticVarSetText ("firstflag","0");
}

if(StaticVarGetText("firstflag"+Name())=="")
{
	StaticVarSet(("BuyIndex" + Name()), 0);
	StaticVarSet(("BuyCount" + Name()), 0);
	StaticVarSet(("BuyFlag"  + Name()), 0);
	StaticVarSet(("BuyPrice"  + Name()), 0);
	StaticVarSet(("BuyQty"  + Name()), 0);

	StaticVarSet(("SellIndex" + Name()), 0);
	StaticVarSet(("SellCount" + Name()), 0);
	StaticVarSet(("SellFlag"  + Name()), 0);
	StaticVarSet(("SellPrice"  + Name()), 0);
	StaticVarSet(("SellQty"  + Name()), 0);

	StaticVarSet("LTPSave" + Name(), 0);
	StaticVarSet("LTQSave" + Name(), 0);
	StaticVarSet("VolumeTemp" + Name(), 0);
	StaticVarSet("AskSave" + Name(), 0);
	StaticVarSet("BidSave" + Name(), 0);

	StaticVarSet("LastLTPColor" + Name(), colorGrey40);
	StaticVarSet("LastLTQColor" + Name(), colorGrey40);
	StaticVarSet("LastAskColor" + Name(), colorGrey40);
	StaticVarSet("LastBidColor" + Name(), colorGrey40);

	StaticVarSetText("firstflag"+Name(), "0");
}

CurrentAskPrice = LastValue(Aux1);
CurrentBidPrice = LastValue(Aux2);
CurrentTradedPrice = LastValue(C);
CurrentVolume = LastValue(Volume);

LTPTemp = StaticVarGet("LTPSave" + Name());
LTQTemp = StaticVarGet("LTQSave" + Name());
VolumeTemp = StaticVarGet("VolumeTemp" + Name());
AskTemp = StaticVarGet("AskSave" + Name());
BidTemp = StaticVarGet("BidSave" + Name());

CurrentLTQ = (CurrentVolume - VolumeTemp);

if(CurrentLTQ < 0)
{
	CurrentLTQ = CurrentLTQ * -1;
}

if(CurrentLTQ == 0)
{
	CurrentLTQ = LTQTemp;
}

LTPColor = StaticVarGet("LastLTPColor" + Name());
LTQColor = StaticVarGet("LastLTQColor" + Name());
AskColor = StaticVarGet("LastAskColor" + Name());
BidColor = StaticVarGet("LastBidColor" + Name());

if(LTPTemp > CurrentTradedPrice)
{
	LTPColor = colorRed;
}
else if(LTPTemp < CurrentTradedPrice)
{
	LTPColor = colorGreen;
}

if(LTQTemp > CurrentLTQ)
{
	LTQColor = colorRed;
}
else if(LTQTemp < CurrentLTQ)
{
	LTQColor = colorGreen;
}

StaticVarSet("LastLTPColor" + Name(), LTPColor);
StaticVarSet("LastLTQColor" + Name(), LTQColor);
StaticVarSet("LastAskColor" + Name(), AskColor);
StaticVarSet("LastBidColor" + Name(), BidColor);

StaticVarSet("LTPSave" + Name(), CurrentTradedPrice);
StaticVarSet("LTQSave" + Name(), CurrentLTQ);
StaticVarSet("VolumeTemp" + Name(), CurrentVolume);
StaticVarSet("AskSave" + Name(), CurrentAskPrice);
StaticVarSet("BidSave" + Name(), CurrentBidPrice);

X0 = 10;
Y0 = 100;
YC=TimeFrameGetPrice("C",inDaily,-1);
DD=Prec(C-YC,2);
xx=Prec((DD/YC)*100,2);

//DrawData ("" + CurrentTradedPrice +" ("+xx+"%)", X0, Y0, X0+320, Y0+50, LTPColor, 30);
DrawData ("" + C, X0, Y0, X0+150, Y0+50, LTPColor, 30);
DrawData (" ("+xx+"%) ", X0+155, Y0, X0+300, Y0+50, LTPColor, 24);
DrawData (" LTQ : " + NumToStr(CurrentLTQ,1,0), X0, Y0+55, X0+100, Y0+85, LTQColor, 12);

/*
FS=Param("Font Size",30,30,100,1);
GfxSelectFont("Arial", FS, 900, italic = False, underline = False, True );
GfxSetBkMode( colorWhite );
GfxSetTextColor( ParamColor("Color",colorYellow) );
//Hor=Param("Horizontal Position",800,800,800,800);

Hor=Param("Horizontal Position",100,100,100,100);
Ver=Param("Vertical Position",25,25,250,50);
GfxTextOut(""+C,Hor , Ver );
YC=TimeFrameGetPrice("C",inDaily,-1);
DD=Prec(C-YC,2);
xx=Prec((DD/YC)*100,2);
GfxSelectFont("Arial", 12, 700, italic = False, underline = False, True );
GfxSetBkMode( colorWhite );
GfxSetTextColor(ParamColor("Color",colorYellow) );
GfxTextOut(""+DD+" ("+xx+"%)", Hor+5, Ver+45 );
*/
_SECTION_END();

/*_SECTION_BEGIN("Name");
GfxSetOverlayMode(0);
GfxSelectFont("Tahoma", Status("pxheight")/8 );
GfxSetTextAlign( 0 );// center alignment
GfxSetTextColor( ColorHSB( 42, 42, 42 ) );
GfxSetBkMode(1); // transparent
Hor=Param("Horizontal Position",100,100,100,100);
Ver=Param("Vertical Position",360,360,250,50);
GfxTextOut(""+Name(), Hor+5, Ver+45 );
_SECTION_END();
*/

_SECTION_BEGIN( "GFX EMA" );
procedure Plotlinewidth( pvalue, ptitle, pcolor, pstyle, pmin, pmax, pxshift, plinewidth, pshowdate )
{
    local pvalue, ptitle, pcolor, pstyle, pmin, pmax, pxshift, plinewidth, ppenstyle, pshowdate;
    local Miny, Maxy;
    local Lvb, fvb;
    local pxwidth, pxheight;
    local TotalBars, axisarea;
    local i, x, y;

    if ( plinewidth > 0 && Status( "action" ) == 1 && ( pstyle & styleLine == styleLine ) )
    {
        ////GfxSetOverlayMode( 0 );
        Miny = Status( "axisminy" );
        Maxy = Status( "axismaxy" );
        lvb = Status( "lastvisiblebar" );
        fvb = Status( "firstvisiblebar" );
        pxwidth = Status( "pxwidth" );
        pxheight = Status( "pxheight" );
        TotalBars = Lvb - fvb;
        xaxisarea = 56;

        if ( pshowdate )
            yaxisarea = 10;
        else
            yaxisarea = 0;

        i = 0;

        x = 5 + i * ( pxwidth - xaxisarea - 10 ) / ( TotalBars + 1 );

        y = 5 + yaxisarea + ( pvalue[i+fvb] - Miny ) * ( pxheight - yaxisarea - 10 ) / ( Maxy - Miny );

        GfxMoveTo( x, pxheight - y );

        for ( i = 1; i < TotalBars AND i < ( BarCount - fvb ); i++ )
        {
            GfxSelectPen( pcolor[i + fvb], plinewidth, 0 );
            x = 5 + i * ( pxwidth - xaxisarea - 10 ) / ( TotalBars + 1 );
            y = 5 + yaxisarea + ( pvalue[i+fvb] - Miny ) * ( pxheight - yaxisarea - 10 ) / ( Maxy - Miny );
            GfxLineTo( x, pxheight - y );
        }
    }
}

RequestTimedRefresh( 2 );
_SECTION_END();


_SECTION_BEGIN( "Small Triggers" );
p1 = Param( "TL 1 Periods", 20, 5, 50, 1 );
p2 = Param( "TL 2 Periods", 5, 3, 25, 1 );
TL1 = LinearReg( C, p1 );
TL2 = EMA( TL1, p2 );
Col1 = IIf( TL1 > TL2, ParamColor( "TL Up Colour", colorBrightGreen ), ParamColor( "TL Dn Colour", colorCustom12 ) );
ShortTrend = WriteIf( TL1 > TL2, "Uptrend", "Downtrend" );
Plot( TL1, "LinearReg(20)", Col1, styleLine | styleNoLabel );
Plot( TL2, "EMA(5)", Col1, styleLine | styleNoLabel ); // | styleThick
_SECTION_END();

_SECTION_BEGIN( "Large Triggers" );
p3 = Param( "TL 3 Periods", 80, 5, 100, 1 );
p4 = Param( "TL 4 Periods", 20, 3, 100, 1 );
TL3 = LinearReg( C, p3 );
TL4 = EMA( TL3, p4 );
Col1 = IIf( TL3 > TL4, ParamColor( "TLL Up Colour", colorBlue ), ParamColor( "TLL Dn Colour", colorRed ) );
LongTrend = WriteIf( TL3 > TL4, "Uptrend", "Downtrend" );
Plot( TL3, "LinearReg(80)", Col1, styleLine | styleNoLabel );
Plot( TL4, "EMA(20)", Col1, styleLine | styleNoLabel );
_SECTION_END();

_SECTION_BEGIN( "Fibo Retrace and Extensions" );
fibs = ParamToggle( "Plot Fibs", "Off|On", 1 );
pctH = Param ( "Pivot Hi %", 0.325, 0.001, 2.0, 0.002 );
HiLB = Param ( "Hi LookBack", 1, 1, BarCount - 1, 1 );
pctL = Param ( "Pivot Lo %", 0.325, 0.001, 2.0, 0.002 );
LoLB = Param ( "Lo LookBack", 1, 1, BarCount - 1, 1 );
Back = Param ( "Extend Left = 2", 1, 1, 500, 1 );
Fwd  = Param( "Plot Forward", 0, 0, 500, 1 );
text = ParamToggle( "Plot Text", "Off|On", 1 );
hts  = Param ( "Text Shift", -33.5, -50, 50, 0.10 );
style = ParamStyle( "Line Style", styleLine, styleNoLabel );
x = BarIndex();
pRp  = PeakBars( H, pctH, 1 ) == 0;
yRp0 = SelectedValue( ValueWhen( pRp, H, HiLB ) );
xRp0 = SelectedValue( ValueWhen( pRp, x, HiLB ) );
pSp  = TroughBars( L, pctL, 1 ) == 0;
ySp0 = SelectedValue( ValueWhen( pSp, L, LoLB ) );
xSp0 = SelectedValue( ValueWhen( pSp, x, LoLB ) );
Delta = yRp0 - ySp0;

function fib( ret )
{
    retval = ( Delta * ret );
    Fibval = IIf( ret < 1.0
                  AND xSp0 < xRp0, yRp0 - retval, IIf( ret < 1.0
                                                       AND xSp0 > xRp0, ySp0 + retval, IIf( ret > 1.0
                                                                                            AND xSp0 < xRp0, yRp0 - retval, IIf( ret > 1.0
                                                                                                                                 AND xSp0 > xRp0, ySp0 + retval, Null ) ) ) );
    return FibVal;
}

x0 = Min( xSp0, xRp0 ) - Back;
x1 = ( BarCount - 1 );

r236 = fib( 0.236 );
r236I = LastValue ( r236, 1 );
r382 = fib( 0.382 );
r382I = LastValue ( r382, 1 );
r050 = fib( 0.50 );
r050I = LastValue ( r050, 1 );
r618 = fib( 0.618 );
r618I = LastValue ( r618, 1 );
r786 = fib( 0.786 );
r786I = LastValue ( r786, 1 );
e127 = fib( 1.27 );
e127I = LastValue ( e127, 1 );
e162 = fib( 1.62 );
e162I = LastValue ( e162, 1 );
e200 = fib( 2.00 );
e200I = LastValue ( e200, 1 );
e262 = fib( 2.62 );
e262I = LastValue ( e262, 1 );
e424 = fib( 4.24 );
e424I = LastValue ( e424, 1 );

p00 = IIf( xSp0 > xRp0, ySp0, yRp0 );
p00I = LastValue ( p00, 1 );
p100 = IIf( xSp0 < xRp0, ySp0, yRp0 );
p100I = LastValue ( p100, 1 );
color00 = IIf( xSp0 > xRp0, colorLime, colorRed );
color100 = IIf( xSp0 < xRp0, colorLime, colorRed );

numbars = LastValue( Cum( Status( "barvisible" ) ) );
fraction = IIf( StrRight( Name(), 3 ) == "", 3.2, 3.2 );

if ( fibs == 1 )
{
    Plot( LineArray( xRp0 - Fwd, yRp0, x1, yRp0, Back ), "PR", 32, 8 | styleNoRescale, Null, Null, Fwd );
    Plot( LineArray( xSp0 - Fwd, ySp0, x1, ySp0, Back ), "PS", 27, 8 | styleNoRescale, Null, Null, Fwd );
    Plot( LineArray( x0 - Fwd, r236, x1, r236, Back ), "", 45, style | styleNoRescale, Null, Null, Fwd );
    Plot( LineArray( x0 - Fwd, r382, x1, r382, Back ), "", 44, style | styleNoRescale, Null, Null, Fwd );
    Plot( LineArray( x0 - Fwd, r050, x1, r050, Back ), "", 41, style | styleNoRescale, Null, Null, Fwd );
    Plot( LineArray( x0 - Fwd, r618, x1, r618, Back ), "", 43, style | styleNoRescale, Null, Null, Fwd );
    Plot( LineArray( x0 - Fwd, r786, x1, r786, Back ), "", 42, style | styleNoRescale, Null, Null, Fwd );
    Plot( LineArray( x0 - Fwd, e127, x1, e127, Back ), "e127", 47, style | styleNoRescale, Null, Null, Fwd );
    Plot( LineArray( x0 - Fwd, e162, x1, e162, Back ), "e162", 47, style | styleNoRescale, Null, Null, Fwd );
    Plot( LineArray( x0 - Fwd, e200, x1, e200, Back ), "p200", 47, style | styleNoRescale, Null, Null, Fwd );
    Plot( LineArray( x0 - Fwd, e262, x1, e262, Back ), "p262", 47, style | styleNoRescale, Null, Null, Fwd );
    Plot( LineArray( x0 - Fwd, e424, x1, e424, Back ), "p424", 25, style | styleNoRescale, Null, Null, Fwd );
}

if ( text == 1 )
{
    PlotText( " 0% = " + WriteVal( p00, fraction ),     LastValue( BarIndex() ) - ( numbars / hts ), p00I  + 0.05, color00 );
    PlotText( "23% = " + WriteVal( r236, fraction ), LastValue( BarIndex() ) - ( numbars / hts ), r236I + 0.05, 45 );
    PlotText( "38% = " + WriteVal( r382, fraction ), LastValue( BarIndex() ) - ( numbars / hts ), r382I + 0.05, 44 );
    PlotText( "50% = " + WriteVal( r050, fraction ), LastValue( BarIndex() ) - ( numbars / hts ), r050I + 0.05, 41 );
    PlotText( "62% = " + WriteVal( r618, fraction ), LastValue( BarIndex() ) - ( numbars / hts ), r618I + 0.05, 43 );
    PlotText( "78% = " + WriteVal( r786, fraction ), LastValue( BarIndex() ) - ( numbars / hts ), r786I + 0.05, 42 );
    PlotText( "100% = " + WriteVal( p100, fraction ), LastValue( BarIndex() ) - ( numbars / hts ), p100I + 0.05, color100 );
    PlotText( "127% = " + WriteVal( e127, fraction ), LastValue( BarIndex() ) - ( numbars / hts ), e127I + 0.05, 47 );
    PlotText( "162% = " + WriteVal( e162, fraction ), LastValue( BarIndex() ) - ( numbars / hts ), e162I + 0.05, 47 );
    PlotText( "200% = " + WriteVal( e200, fraction ), LastValue( BarIndex() ) - ( numbars / hts ), e200I + 0.05, 47 );
    PlotText( "262% = " + WriteVal( e262, fraction ), LastValue( BarIndex() ) - ( numbars / hts ), e262I + 0.05, 47 );
    PlotText( "424% = " + WriteVal( e424, fraction ), LastValue( BarIndex() ) - ( numbars / hts ), e424I + 0.05, 25 );
}

_SECTION_END();

_SECTION_BEGIN( "Pivot Finder for Amibroker" );
/* **********************************

Code to automatically identify pivots

********************************** */

// -- what will be our lookback range for the hh and ll?
farback = Param( "How Far back to go", 100,50, 5000, 10 );
nBars = Param( "Number of bars", 12, 5, 40 );

// -- Title.

/*Title = Name() + " (" + StrLeft( FullName(), 15 ) + ") O: " + Open + ",

        H: " + High + ", L: " + Low + ", C: " + Close;
*/

// -- Plot basic candle chart

/*PlotOHLC( Open, High, Low, Close,

          "BIdx = " + BarIndex() +

          "\n" + "O = " + O + "\n" + "H = " + H + "\n" + "L = " + L

          + "\n" + "C ",

          colorBlack, styleBar );
*/
GraphXSpace = 7;

// -- Create 0-initialized arrays the size of barcount

aHPivs = H - H;

aLPivs = L - L;

// -- More for future use, not necessary for basic plotting

aHPivHighs = H - H;

aLPivLows = L - L;

aHPivIdxs = H - H;

aLPivIdxs = L - L;

nHPivs = 0;

nLPivs = 0;

lastHPIdx = 0;

lastLPIdx = 0;

lastHPH = 0;

lastLPL = 0;

curPivBarIdx = 0;

// -- looking back from the current bar, how many bars

// back were the hhv and llv values of the previous

// n bars, etc.?

aHHVBars = HHVBars( H, nBars );

aLLVBars = LLVBars( L, nBars );

aHHV = HHV( H, nBars );

aLLV = LLV( L, nBars );

// -- Would like to set this up so pivots are calculated back from

// last visible bar to make it easy to "go back" and see the pivots

// this code would find. However, the first instance of

// _Trace output will show a value of 0

aVisBars = Status( "barvisible" );

nLastVisBar = LastValue( Highest( IIf( aVisBars, BarIndex(), 0 ) ) );

_TRACE( "Last visible bar: " + nLastVisBar );

// -- Initialize value of curTrend

curBar = ( BarCount - 1 );

curTrend = "";

if ( aLLVBars[curBar] <

        aHHVBars[curBar] )
{

    curTrend = "D";

}

else
{

    curTrend = "U";

}

// -- Loop through bars. Search for

// entirely array-based approach

// in future version

for ( i = 0; i < farback; i++ ){

    curBar = ( BarCount - 1 ) - i;

// -- Have we identified a pivot? If trend is down...

    if ( aLLVBars[curBar] < aHHVBars[curBar] )
    {

// ... and had been up, this is a trend change

        if ( curTrend == "U" )
        {

            curTrend = "D";

// -- Capture pivot information

            curPivBarIdx = curBar - aLLVBars[curBar];

            aLPivs[curPivBarIdx] = 1;

            aLPivLows[nLPivs] = L[curPivBarIdx];

            aLPivIdxs[nLPivs] = curPivBarIdx;

            nLPivs++;

        }

// -- or current trend is up

    }
    else
    {

        if ( curTrend == "D" )
        {

            curTrend = "U";

            curPivBarIdx = curBar - aHHVBars[curBar];

            aHPivs[curPivBarIdx] = 1;

            aHPivHighs[nHPivs] = H[curPivBarIdx];

            aHPivIdxs[nHPivs] = curPivBarIdx;

            nHPivs++;

        }

// -- If curTrend is up...else...

    }

// -- loop through bars

}

// -- Basic attempt to add a pivot this logic may have missed

// -- OK, now I want to look at last two pivots. If the most

// recent low pivot is after the last high, I could

// still have a high pivot that I didn't catch

// -- Start at last bar

curBar = ( BarCount - 1 );

candIdx = 0;

candPrc = 0;

lastLPIdx = aLPivIdxs[0];

lastLPL = aLPivLows[0];

lastHPIdx = aHPivIdxs[0];

lastHPH = aHPivHighs[0];

if ( lastLPIdx > lastHPIdx )
{

// -- Bar and price info for candidate pivot

    candIdx = curBar - aHHVBars[curBar];

    candPrc = aHHV[curBar];

    if (

        lastHPH < candPrc AND

        candIdx > lastLPIdx AND

        candIdx < curBar )
    {


// -- OK, we'll add this as a pivot...

        aHPivs[candIdx] = 1;

// ...and then rearrange elements in the

// pivot information arrays

        for ( j = 0; j < nHPivs; j++ )
        {

            aHPivHighs[nHPivs-j] = aHPivHighs[nHPivs-

                                              ( j+1 )];

            aHPivIdxs[nHPivs-j] = aHPivIdxs[nHPivs-( j+1 )];

        }

        aHPivHighs[0] = candPrc ;

        aHPivIdxs[0] = candIdx;

        nHPivs++;

    }

}
else
{


// -- Bar and price info for candidate pivot

    candIdx = curBar - aLLVBars[curBar];

    candPrc = aLLV[curBar];

    if (

        lastLPL > candPrc AND

        candIdx > lastHPIdx AND

        candIdx < curBar )
    {


// -- OK, we'll add this as a pivot...

        aLPivs[candIdx] = 1;

// ...and then rearrange elements in the

// pivot information arrays

        for ( j = 0; j < nLPivs; j++ )
        {

            aLPivLows[nLPivs-j] = aLPivLows[nLPivs-( j+1 )];

            aLPivIdxs[nLPivs-j] = aLPivIdxs[nLPivs-( j+1 )];

        }

        aLPivLows[0] = candPrc;

        aLPivIdxs[0] = candIdx;

        nLPivs++;

    }

}

// -- Dump inventory of high pivots for debugging

/*

for (k=0; k<nHPivs; k++) {

_TRACE("High pivot no. " + k

+ " at barindex: " + aHPivIdxs[k] + ", "

+ WriteVal(ValueWhen(BarIndex()==aHPivIdxs[k],

DateTime(), 1), formatDateTime)

+ ", " + aHPivHighs[k]);

}

*/

// -- OK, let's plot the pivots using arrows

//============== EXPLORATION ==============
Buy = aLPivs==1;
Sell = aHPivs==1;
//Buy = ExRem(Buy,Sell);
//Sell = ExRem(Sell,Buy);
BuyPrice = ValueWhen( Buy, O );
SellPrice = ValueWhen( Sell, O );

/*SellPrice=ValueWhen(Sell,C,1);
BuyPrice=ValueWhen(Buy,C,1);
Long=Flip(Buy,Sell);
Shrt=Flip(Sell,Buy );
*/

autotrader= ParamToggle( "Automate Trade", "No|Yes", 0 );

if (autotrader == 1) SATC1(Open, High, Low, Close, Volume, Aux1, Aux2, Buy, Sell, Sell, Buy);

for(i=BarCount-1;i>1;i--)
{
if(Buy[i] == 1)
{
entry = C[i];
sig = "BUY";
bars = i;
i = 0;
}
if(Sell[i] == 1)
{
sig = "SELL";
entry = C[i];
bars = i;
i = 0;
}
}


if ( sig =="BUY" )
{
    PopupWindowEx( "ID:0", "Get Ready to BUY  \n" + Name() + " @ " + BuyPrice, "Buy Alert -", timeout, 100, 1 );
}
else
{
    PopupWindowEx( "ID:1", "Get Ready to SELL  \n" + Name() + " @ " + SellPrice, "Sell Alert -", timeout, 100, 1 );
}


PlotShapes(shapeUpArrow*Buy,colorBrightGreen);
PlotShapes(shapeDownArrow*Sell,colorRed);

//PlotShapes( IIf( Sell, shapeDownArrow, shapeNone ), colorRed, 0, High, Offset = -15 );
//PlotShapes( IIf( Buy, shapeUpArrow , shapeNone ), colorBrightGreen, 0, Low, Offset = -15 );


//AlertIf( Sell, "SOUND C:\\Windows\\Media\\Ding.wav", "Sell " + C, 2, 1 + 2, 1 );
//AlertIf( Buy, "SOUND C:\\Windows\\Media\\Ding.wav", "Buy " + C, 1, 1 + 2, 1 );

dist = 1.1 * ATR( 15 );

for ( i=BarCount-1; i > 0; i-- )
{
    if ( Buy[i] )
        PlotText( "Buy@" + O[ i ], i, L[ i ] - dist[i], colorWhite, colorGreen);

    if ( Sell[i] )
        PlotText( "Sell@" + O[ i ], i, H[ i ] + dist[i], colorWhite, colorRed);
}


//============== MESSAGE BOARD ==============
messageboard = ParamToggle( "Message Board", "Show|Hide", 0 );

//CUSTOM CODE FOR MESSAGE BOARD
Hp = HHV( H, 40 );
Lp = LLV( L, 40 );

BarsSincebuy = BarsSince( Buy );
BarsSinceshort = BarsSince( Sell );
LastSignal = IIf( BarsSincebuy < BarsSinceshort, 1, -1 );
Sig = WriteIf( BarsSincebuy < BarsSinceshort, "BUY", "SELL" );

slPrice = IIf( LastSignal == 1, HighestSince( Buy, Lp ), LowestSince( Sell , Hp ) );
initialrisk = IIf( LastSignal == 1, BuyPrice - SLPrice, SLPrice - SellPrice );
CurrentPL = IIf( LastSignal == 1, C - BuyPrice, SellPrice - C );

entry = IIf( LastSignal == 1, BuyPrice, SellPrice );

bars = LastValue( IIf( BarsSincebuy < BarsSinceshort, BarsSincebuy, BarsSinceshort ) );
Offset = 15;
Clr = IIf( LastValue( LastSignal ) == 1, colorGreen, colorRed );

if (messageboard == 0 )
{
    GfxSelectFont( "Tahoma", 11, 700 );
    GfxSetBkMode( 1 );
    GfxSetTextColor( colorWhite );
    GfxSetOverlayMode(0);

	LongCaution = ShortCaution = "";

    if ( SelectedValue( LastSignal ) == 1 )
    {
        GfxSelectSolidBrush( colorDarkGreen );
        Datetim = "" + ValueWhen( Buy, Hour(), 1 ) + ":" + ValueWhen( Buy, Minute(), 1 );
        tar1 = entry + ( entry * .0050 );
        tar2 = entry + ( entry * .0092 );
        tar3 = entry + ( entry * .0179 );
		 LongCaution = WriteIf(LongTrend == "Downtrend", " (Caution)", "");
		 ShortCaution = WriteIf(ShortTrend == "Downtrend", " (Caution)", "");


    }
    else
    {
        GfxSelectSolidBrush( colorDarkRed );
        Datetim = "" + ValueWhen( Sell, Hour(), 1 ) + ":" + ValueWhen( Sell, Minute(), 1 );
        tar1 = entry - ( entry * .0050 );
        tar2 = entry - ( entry * .0112 );
        tar3 = entry - ( entry * .0212 );
		 LongCaution = WriteIf(LongTrend == "Uptrend", " (Caution)", "");
		 ShortCaution = WriteIf(ShortTrend == "Uptrend", " (Caution)", "");

    }

    pxHeight = Status( "pxchartheight" );

    xx = Status( "pxchartwidth" );
    Left = 1100;
    width = 310;
    x = 1.5;
    x2 = 300;
    boxheight = 210;
    y = pxHeight / 1;

    GfxSelectPen( colorLightBlue, 1 );
    GfxRoundRect( x, y - 210, x2, y , 7, 7 ) ;
    GfxTextOut( ( " Trading System "),50, y-boxheight+10);
    GfxTextOut( ( " ..........................................." ), 5, y-boxheight+20 );
    GfxTextOut( ( "Last Signal" ), 13,y-boxheight+40 );
    GfxTextOut( ( ": " + Datetim ), 130, y-boxheight+40 );
    GfxTextOut( ( "" + sig + " Entry @" ), 13, y-boxheight+60 );
    GfxTextOut( ( ": " + entry ), 130, y-boxheight+60 );
    GfxTextOut( ( "Current P/L" ), 13, y-boxheight+80 );
    GfxTextOut( ( ": " + WriteVal( IIf( sig == "BUY", ( C - entry ), ( entry - C ) ), 2.2 ) ), 130, y-boxheight+80 );
    GfxTextOut( ( "Long Trend" ), 13, y-boxheight+100 );
    GfxTextOut( ( ": " + LongTrend + LongCaution ), 130, y-boxheight+100 );
    GfxTextOut( ( "Short Trend" ), 13, y-boxheight+120 );
    GfxTextOut( ( ": " + ShortTrend + ShortCaution ), 130, y-boxheight+120 );
    GfxTextOut( ( " ..........................................." ), 5, y-boxheight+130 );
    GfxTextOut( ("Target1"), 13, y-boxheight+150);
    GfxTextOut( ( ": " + tar1 ), 130, y-boxheight+150 );
    GfxTextOut( ("Target2"), 13, y-boxheight+170);
    GfxTextOut( ( ": " + tar2), 130, y-boxheight+170 );
    GfxTextOut( ("Target3"), 13, y-boxheight+190);
    GfxTextOut( ( ": " + tar3), 130, y-boxheight+190 );

}
_SECTION_END();


//SetChartBkGradientFill( ParamColor( "BgTop", ColorRGB( 0, 0, 0 ) ), ParamColor( "BgBottom", ColorRGB( 0, 0, 0 ) ), ParamColor( "titleblock", ColorRGB( 0, 0, 0 ) ) );


_SECTION_BEGIN("Volume At Price");
PlotVAPOverlay(Param("Lines", 1000, 100, 1000, 10), Param("Width", 15, 1, 100, 1), ParamColor("Color", colorBlue), ParamToggle("Side", "Left|Right", 1) | 4 *ParamToggle("Z-order", "On top|Behind", 1));
_SECTION_END();


//Volume Price Analysis AFL - VPA Version 3.0 -15-06-2015
// Revision Details
// V-2.0 AFL - fully re written for clarity, Minor bugs removed
// V-2.1 support and resistance line added
// V-2.2 Commentary for support and resistance line breaks Added.
// V-2.3 Revision detail- High volume Lines added
// V-2.4 Toggle switch for plotting S/R, High volume and Trend lines added
// V-2.5 Bar coloring option included - VSA based or Trend Based
// V-3.0 Trend detection Method changed to "Random Walk"
//===================Version V.3.0 ======================
//=========================================================================|
//                    VPA Basic Module                                     |
//=========================================================================|
_SECTION_BEGIN("VPA Basic Module");
SetChartOptions(0,chartShowArrows|chartShowDates);
gxs=Param("GRAPH spaceing",10,5,50,5);
GraphXSpace = gxs;
 SetChartBkColor(ParamColor("Outer panel",colorBlack)); // color of outer border
    SetChartBkGradientFill( ParamColor("Inner panel upper",colorBlack),ParamColor("Inner panel lower",colorBlack));

//===================== Basic Definitions =======================================
volAvg				=	MA(V,90);
volMean 			= 	StDev(volAvg,30);
volUpBand3 		= 	volAvg + 3*volMean;
volUpband2 		= 	volAvg + 2*volMean;;
volUpBand1 		= 	volAvg + 1*volMean;;
volDnBand1 		= 	volAvg -1*volMean;
volDnBand2 		= 	volAvg -2*volMean;
midprice			=	(H+L)/2;
spread				=	(H-L);
avgSpread			=	MA(spread,90);
wideRangeBar		=	spread>(1.5*avgSpread);
narrowRangeBar	=	spread<(0.7*avgSpread);
lowVolume			=	V<Ref(V,-1) AND V<Ref(V,-2);
upBar				=	C>Ref(C,-1);
downBar			=	C<Ref(C,-1);
highVolume			=	V>Ref(V,-1) AND Ref(V,-1)>Ref(V,-2);
closeFactor		=	C-L;
clsPosition		=	spread/closeFactor;
closePosition		=	IIf(closeFactor=0,avgSpread,clsPosition);
Vb					=	V>volAvg OR V>Ref(V,-1);
upClose			=	C>=((spread*0.7)+L);// close is above 70% of the Bar
downClose			=	C<=((spread*0.3)+L);// close is below the 30% of the bar
aboveClose			=	C>((spread*0.5)+L);// close is between 50% and 70% of the bar
belowClose			=	C<((spread*0.5)+L);// close is between 50% and 30% of the bar
midClose			=	C>((spread*0.3)+L) AND C<((spread*0.7)+L);// close is between 30% and 70% of the bar
veryLowClose		=	closePosition>4;//close is below 25% of the bar
veryHighClose		=	closePosition<1.35;// Close is above 80% of the bar
ClosePos			= 	IIf(C<=((spread*0.3)+L),1,IIf(C<=((spread*0.5)+L),2,IIf(C<=((spread*0.7)+L),3,4)));
                    // 1 = downclose, 2 = belowclose, 3 = aboveClose, 4 = Upclose
Volpos				=  	IIf(V>volAvg*2,1,IIf(V>volAvg*1.3,2,IIf(V>volAvg,3,IIf(V<volAvg AND V>volAvg*0.7,4,5))));
						// 1 = Very High, 2 = High, 3 = Above Average, 4 = Less than Average, 5 = Low
freshGndHi       =  C > HHV(H,5);
freshGndLo       =  C < LLV(L,5);

//========================Trend Estimation =========================
j=MA(C,5);
trendLongTerm     =  LinRegSlope(j,40) ;
trendMediumTerm   =  LinRegSlope(j,10) ;
trendShortTerm    =  LinRegSlope(j,3);
tls=LinRegSlope(j,3);
_SECTION_END();
//=========================================================================|
//                    Trend Analysis Module                                |
//=========================================================================|
_SECTION_BEGIN("Trend Analysis");
SetChartOptions(0,chartShowArrows|chartShowDates);
 minperiodsRWIst = Param ( "Short term Min Periods", 2, 1, 9, 1);
 maxperiodsRWIst = Param ( "Short term Max Periods", 8, 1, 9, 1);

 minperiodsRWIlt = Param ( "Long Term Min Periods", 10, 1, 32, 1);
 maxperiodsRWIlt = Param ( "Long term Max Periods", 40, 1, 64, 1);

 Ground = RWIHi (minperiodsRWIst, maxperiodsRWIst);
 Sky    = RWILo (minperiodsRWIst, maxperiodsRWIst);
 j      = RWI(minperiodsRWIlt, maxperiodsRWIlt);
 k      =  RWI(minperiodsRWIst, maxperiodsRWIst);
 j2     = RWIHi (minperiodsRWIlt, maxperiodsRWIlt);
 k2     = RWILo (minperiodsRWIlt, maxperiodsRWIlt);
 ja     = Cross(j,1); // The followign section check the diffeent condition of the RWi above and below zero
 jb     = Cross(1,j); // In oder to check which trend is doing what
 jc     = Cross(-1,j);
 jd     = Cross(j,-1);
 j2a    = Cross(j2,1);
 j2b    = Cross(1,j2);
 k2a    = Cross(k2,1);
 k2b    = Cross(1,k2);
//Define the Major, Minor and Immediate trend Sttatus
upmajoron   = j > 1 AND Ref(ja,-1);
upmajoroff  = j < 1 AND Ref(jb,-1);
upminoron   = j2 > 1 AND Ref(j2a,-1);
upminoroff  = j2 < 1 AND Ref(j2b,-1);
dnmajoron   = j < -1 AND Ref(jc,-1);
dnmajoroff  = j > -1 AND Ref(jd,-1);
dnminoron   = k2 > 1 AND Ref(k2a,-1);
dnminoroff  = k2 < 1 AND Ref(k2b,-1);
upimd       = IIf(ground > 1, 1,0);
dnimd       = IIf(sky > 1, 1, 0);
upmajor     = IIf(j>1,1,IIf(j<(-1),-1,0));
upminor     = IIf(j2>1,1,-1);
dnminor     = IIf(k2>1,1,-1);
_SECTION_END();
//======================================================================|
//                      VSA Signal generation                           |
//======================================================================|
_SECTION_BEGIN("Signal Generation");

upThrustBar		=	wideRangeBar AND downClose  AND trendShortTerm>0 AND H>Ref(H,-1);//WRB and UHS and Fresh Ground
nut              =   wideRangeBar AND downClose  AND freshGndHi AND HighVolume;// NEW SIGNAL
bc               =    wideRangeBar AND aboveclose AND V == HHV(V,60) AND upmajor==1;// NEW SIGNAL
upThrustBartrue	=	wideRangeBar AND downClose AND upmajor>0 AND H>Ref(H,-1);//occurs after a major uptrend
upThrustTHV		=	upThrustBartrue AND (VolPos == 2 OR VolPos == 1);
upThrustCond1		=	Ref(upThrustBar,-1) AND downBar ;
upThrustCond2		=	Ref(upThrustBar,-1) AND downBar AND VolPos == 2;
upThrustCond3		=	upThrustBar AND VolPos ==1;
topRevBar			=	Ref(V,-1)>volAvg  AND Ref(upBar,-1) AND Ref(wideRangeBar,-1) AND downBar AND downClose AND wideRangeBar AND trendLongTerm>0 AND H==HHV(H,10);
PseudoUpThrust	=	Ref(upBar,-1) AND Ref(V,-1)>1.5*volAvg AND downBar AND downClose AND  NOT upThrustBar;
pseudoUtCond		=	Ref(PseudoUpThrust,-1) AND downBar AND downClose AND NOT upThrustBar;
trendChange		=	Ref(upBar,-1) AND H==HHV(H,5)AND downBar AND (downClose OR midClose) AND V>volAvg AND NOT wideRangeBar AND NOT PseudoUpThrust ;
sellCond1			=	(upThrustCond1 OR upThrustCond2 OR upThrustCond3) ;
sellCond2			=	Ref(sellCond1,-1)==0;
sellCond			=	sellCond1 AND sellCond2;
strengthDown0		= 	trendLongTerm<0 AND V>Ref(V,-1) AND Ref(downBar,-1) AND upBar AND (upClose OR midClose) AND trendShortTerm<0 AND trendMediumTerm<0;// strength after a long down trend
strengthDown		= 	V>Ref(V,-1) AND Ref(downBar,-1) AND upBar AND (upclose OR midClose) AND trendShortTerm<0 AND trendMediumTerm<0;// Strength after a down trend
strengthDown1		= 	trendLongTerm<0 AND V>(volAvg*1.5) AND Ref(downBar,-1) AND upBar AND (upClose OR midClose)AND trendShortTerm<0 AND trendMediumTerm<0;//Strength after downtrend . High volume
strengthDown2		=	trendShortTerm<0 AND Ref(V,-1)<volAvg  AND upBar AND veryHighClose AND V>volAvg;
buyCond1			= 	strengthDown OR strengthDown1;
buyCond			= 	upBar  AND Ref(buyCond1,-1);
stopVolume			= 	L==LLV(L,5)  AND (upClose OR midClose) AND V>1.5*volAvg AND trendLongTerm<0;
bullBar			=	(V>volAvg OR V>Ref(V,-1)) AND closePosition <2 AND upBar ;
bearBar			=	vb  AND downClose AND downBar AND spread>avgSpread;
noDemandBar		=	upBar AND narrowRangeBar AND lowVolume  AND belowClose ;
strengthUp			= 	trendShortTerm>0 AND trendLongTerm<0 AND upBar AND V>Ref(V,-1) AND V>Ref(V,-2) AND upClose;
strengthBar		=	trendLongTerm>0 AND upBar AND V>Ref(V,-1) AND V>Ref(V,-2) AND upClose;
weakBar			=	trendLongTerm>0 AND trendShortTerm>0 AND spread>avgSpread AND veryLowClose;
weakUp				=	Ref(upBar,-1)AND Ref(wideRangeBar,-1)AND Ref(V,-1)>(2*volAvg) AND downBar AND V<Ref(V,-1) AND trendShortTerm>0;
noSupplyBar		=	downBar AND narrowRangeBar AND lowVolume  AND belowClose ;
revUpThrust		=	trendLongTerm<0 AND upBar AND upClose AND V>Ref(V,-1) AND V>volAvg AND  wideRangeBar AND Ref(downBar,-1) AND Ref(downClose,-1);
noBuyPress			= 	C>Ref(C,-1) AND lowVolume AND narrowRangeBar AND aboveClose;
ownerTransfer		=	wideRangeBar  AND V>(1.5*volAvg)AND midClose;
interSupport		=	trendShortTerm<0 AND trendLongTerm>0 AND upBar AND L<Ref(L,-1) AND L<Ref(L,-2) AND upClose;
confirmWeak		= 	Ref(topRevBar,-1) AND downBar AND V>Ref(V,-1) AND downClose;
testbar			=	L==LLV(L,5) AND upClose AND lowVolume;
testBar1			=	L==LLV(L,5) AND upClose AND wideRangeBar AND trendLongTerm<0 AND trendMediumTerm<0 AND lowVolume ;
lowVolTest    	=	lowVolume AND L<Ref(L,-1) AND upClose;
lowVolTest1		= 	V<volAvg AND L<Ref(L,-1) AND upClose AND trendLongTerm>0 AND trendMediumTerm>0 AND wideRangeBar;
lowVolTest2		= 	Ref(lowVolTest,-1) AND upBar AND upClose;
confirmStrength	= 	Ref(lowVolTest,-1) AND upBar AND V>Ref(V,-1) AND upClose AND trendShortTerm<0;
distributeBar		= 	V>2*volAvg AND downClose AND upBar AND trendShortTerm>0 AND trendMediumTerm>0 AND NOT sellCond1 AND NOT upThrustBar;
confirmWeak1		=	Ref(pseudoUtCond,-1) AND L<Ref(L,-1);
effortUp			=	H>Ref(H,-1) AND L>Ref(L,-1) AND C>Ref(C,-1) AND C>=((H-L)*0.7+L) AND spread>avgSpread AND V>Ref(V,-1);//AND O<=((H-L)*0.3+L)
effortUpfail		=	Ref(effortUp,-1) AND (upThrustBar OR upThrustCond1 OR upThrustCond2 OR upThrustCond3);
effortDown			=	H<Ref(H,-1) AND L<Ref(L,-1) AND C<Ref(C,-1) AND  C<=((H-L)*0.25+L) AND spread>avgSpread AND V>Ref(V,-1);//O>=((H-L)*0.75+L) AND
_SECTION_END();
//|============================================================================================|
//|                                       TITLE                                                |
//|============================================================================================|
_SECTION_BEGIN("Title");
if( Status("action") == actionIndicator )
(
Title = Title + "\n" +EncodeColor(colorWhite)+ "Volume= "+WriteVal(V, 1.0)+"      "+EncodeColor(colorYellow)+

WriteIf (upThrustBartrue, " An Upthrust Bar after upmove. A Sure sign of weakness. ","")+
WriteIf (upThrustBar AND NOT upThrustBartrue, " An Upthrust Bar. A sign of weakness. ","")+
WriteIf (upThrustCond1, " A downbar after an Upthrust. Confirm weakness. ","")+
WriteIf (upThrustCond2 AND NOT upThrustCond1, " A High Volume downbar after an Upthrust. Confirm weakness.","")+
WriteIf (upThrustCond3, "This upthrust at very High Voume, Confirms weakness","")+
WriteIf (strengthDown1, "Strength seen returning after a down trend. High volume adds to strength. ","")+
WriteIf (strengthDown0 AND NOT strengthDown, "Strength seen returning after a down trend. ","")+
WriteIf (strengthDown AND NOT strengthDown1, "Strength seen returning after a down trend. ","")+
WriteIf (lowVolTest, "Test for supply. ","")+
WriteIf (lowVolTest2, "An upBar closing near High after a Test confirms strength. ","")+
WriteIf (buyCond, "An upBar closing near High. Confirms return of Strength. ","")+
WriteIf (distributeBar, "A High Volume Up Bar closing down in a uptrend shows Distribution. ","")+
WriteIf (PseudoUpThrust, "Psuedo UpThrust.   A Sign of Weakness. ","")+
WriteIf (pseudoUtCond, "A Down Bar closing down after a Pseudo Upthrust confirms weakness. ","")+
WriteIf (lowVolTest1, "Test for supply in a uptrend. Sign of Strength. ","")+
WriteIf (strengthDown2, "High volume upBar closing on the high indicates strength. ","")+
WriteIf (trendChange, "High volume Downbar after an upmove on high volume indicates weakness. ","")+
WriteIf (noDemandBar, "No Demand. A sign of Weakness. ","")+
WriteIf (noSupplyBar, "No Supply. A sign of Strength. ","")+
WriteIf (stopVolume, "Stopping volume. Normally indicates end of bearishness is nearing. ","")+
WriteIf (revUpThrust, "Reverse upthrust. Indicates strength. ","")+
WriteIf (effortUp, "Effort to Rise. Bullish sign ","")+
WriteIf (effortDown, "Effort to Fall. Bearish sign ","")+
WriteIf (effortUpfail, "Effort to Move up has failed. Bearish sign ","")+
WriteIf (bc,"Potential Buying climax","")+
("\n Volume: ")+WriteIf(V>volAvg*2,EncodeColor(colorGreen)+"Very High",WriteIf(V>volAvg*1.3,EncodeColor(colorGreen)+
" High",WriteIf(V>volAvg,EncodeColor(colorGreen)+"Above Average",
WriteIf(V<volAvg AND V>volAvg*0.7,EncodeColor(colorRed)+"Less than Average",WriteIf(V<volDnBand1,"Low","")))))+
(EncodeColor(colorYellow)+"      Spread: ")+WriteIf(spread >(avgSpread*1.5),EncodeColor(colorGreen)+" Wide",
WriteIf(spread>avgSpread,EncodeColor(colorGreen)+" Above Average",EncodeColor(colorRed)+WriteIf((spread < avgSpread AND spread >= (AvgSpread*0.7)),"Below Average",
WriteIf(spread < AvgSpread*0.5,EncodeColor(colorRed)+"Very Narrow"," Narrow"))))+
(EncodeColor(colorYellow)+"      Close:  ")+WriteIf(veryHighClose,EncodeColor(colorGreen)+"Very High",WriteIf(upClose,EncodeColor(colorGreen)+"High",WriteIf(midClose,EncodeColor(colorYellow)+"Mid",
WriteIf(downClose,EncodeColor(colorRed)+"Down","Very Low"))))+
EncodeColor(colorYellow)+("\n Major Trend:  ")+WriteIf(upmajor==1,EncodeColor(colorGreen)+"Major Trend UP",WriteIf(upmajor== -1,EncodeColor(colorRed)+
"Major Trend Down",EncodeColor(colorYellow)+"No Trend"))+
WriteIf(upmajoroff,EncodeColor(colorRed)+"    Major UpTrend Ended",WriteIf(dnmajoroff,EncodeColor(colorGreen)+"  Major Down Trend Ended","" ))+
EncodeColor(colorYellow)+("\n Minor Trend:  ")+WriteIf(upminor==1,EncodeColor(colorGreen)+"Minor trend up",WriteIf(dnminor==1,
EncodeColor(colorRed)+"Minor Trend Down",EncodeColor(colorYellow)+"No Trend"))+
EncodeColor(colorYellow)+("\n Immediate Trend:  ")+WriteIf(upimd==1,EncodeColor(colorGreen)+"Immediate trend up",WriteIf(dnimd==1,
EncodeColor(colorRed)+"Immediate Trend Down",EncodeColor(colorYellow)+"No Trend")));
_SECTION_END();
//====================================================================================|
//                        Plotting Module                                             |
//====================================================================================|
_SECTION_BEGIN("Plotting");
//Bar coloring formula 1 _ Preferred - Based on VSA Strength
Vscolor=IIf(lowVolTest,colorTurquoise,IIf(distributeBar,colorPink,IIf(ownerTransfer,colorDarkRed ,IIf(upThrustBar,colorYellow ,IIf(bullbar,colorLime ,
IIf(bearbar,colorRed,IIf(noDemandBar,colorWhite ,IIf(noSupplyBar,colorCustom12,IIf(upbar,colorGreen,IIf(downbar,colorOrange,colorBlue))))))))));
//Bar coloring formula 2 _  Based on Trend
Trcolor=IIf(trendShortTerm>0 AND trendMediumTerm>0 AND trendLongTerm>0,colorLime,IIf(trendShortTerm>0 AND trendMediumTerm>0 AND trendLongTerm<0,colorGreen,
IIf(trendShortTerm>0 AND trendMediumTerm<0 AND trendLongTerm<0,colorPaleGreen,IIf(trendShortTerm<0 AND trendMediumTerm<0 AND trendLongTerm<0,colorRed,IIf(trendShortTerm<0 AND trendMediumTerm>0 AND trendLongTerm>0,colorPaleGreen,
IIf(trendShortTerm<0 AND trendMediumTerm<0 AND trendLongTerm>0,colorOrange,colorBlue))))));
SelectedIndicator = ParamList( "Chart Coloring", "VSA Based,Trend Based", 1 );
switch ( SelectedIndicator )
{
case "VSA Based":
//PlotOHLC( Open,  High,  Low,  Close, "", VScolor, styleBar |styleThick );
break;
case "Trend Based":
//PlotOHLC( Open,  High,  Low,  Close, "", Trcolor, styleBar |styleThick );
break;
}
//=============================== PLOT SHAPES SECTION============================
DeepAnalysis = ParamToggle("Show Deep Analysis Marks","Off|On",0);
if ( DeepAnalysis == 1 )
{
    PlotShapes( shapeSmallDownTriangle*( upThrustBar ) , colorRed, 0, H, -20 );
    PlotShapes( shapeHollowSmallDownTriangle*( upThrustBar ) , colorYellow, 0, H, -20 );
    PlotShapes( shapeSmallCircle*topRevBar, colorBlue, 0, H, 20 );
    PlotShapes( shapeSmallDownTriangle*sellCond, colorRed, 0, H, -20 );
    PlotShapes( shapeSmallSquare*strengthDown, colorLime, 0, L, -20 );
    PlotShapes( shapeSmallSquare*strengthDown1, colorLime, 0, L, -20 );
    PlotShapes( shapeSmallSquare*lowVolTest1, colorLime, 0, L, -20 );
    PlotShapes( shapeSmallUpTriangle*lowVolTest2, colorYellow, 0, L, -20 );
    PlotShapes( shapeHollowSmallCircle*stopVolume, colorLime, 0, L, -10 );
    PlotShapes( shapeSmallUpTriangle*buyCond, colorLime, 0, L, -20 );
    PlotShapes( shapeSmallSquare*( PseudoUpThrust ) , colorBlue, 0, H, 10 );
    PlotShapes( shapeSmallDownTriangle*( pseudoUtCond ) , colorBlue, 0, H, -20 );
    PlotShapes( shapeSmallDownTriangle*trendChange , colorYellow, 0, H, -20 );
    PlotShapes( shapeSmallUpTriangle*strengthDown2, colorAqua, 0, L, -20 );
    PlotShapes( shapeSmallSquare*( distributeBar ) , colorBlue, 0, H, 10 );
    PlotShapes( shapeSmallSquare*noDemandBar, colorCustom12, 0, H, 10 );
    PlotShapes( shapeSmallSquare*( confirmWeak1 ), colorWhite, 0, L, -10 );
    PlotShapes( shapeSmallCircle*noSupplyBar, colorLime, 0, L, -20 );
    PlotShapes( shapeSmallCircle*effortUp, colorTurquoise, 0, midprice, 0 );
    PlotShapes( shapeSmallCircle*effortDown, colorYellow, 0, midprice, 0 );
    PlotShapes( shapeSmallSquare*revUpThrust, colorYellow, 0, L, -20 );
    PlotShapes( shapeHollowSmallCircle*ownerTransfer, colorRed, 0, midprice, 0 );
    PlotShapes( shapeSmallSquare*lowVolTest, colorCustom12, 0, L, -20 );
    PlotShapes( shapeSmallSquare*( upThrustBartrue AND NOT sellCond ) , colorWhite, 0, H, 10 );
    PlotShapes( shapeSmallDownTriangle*( nut ) , colorLime, 0, H, -40 );
    PlotShapes( shapeSmallDownTriangle*( bc ) , colorDarkRed, 0, H, -20 );
    PlotShapes( shapeHollowSmallDownTriangle*( bc ) , colorYellow, 0, H, -20 );
}
_SECTION_END();
//====================================================================================|
//                       Commentry Module                                             |
//====================================================================================|
_SECTION_BEGIN("Commentary");
Vpc= upThrustBartrue OR upThrustCond1 OR upThrustCond2 OR upThrustCond3 OR strengthDown0 OR strengthDown1 OR strengthDown2 OR
strengthDown OR lowVolTest1 OR pseudoUtCond OR lowVolTest2 OR PseudoUpThrust OR pseudoUtCond OR noDemandBar OR stopVolume OR trendChange OR buyCond OR noSupplyBar;

if( Status("action") == actionCommentary ) 	printf ( "==================== Volume Price Analysis V.3.0 ====================\n");

printf ( Name() + " - " + Interval(2) +  "  - " + Date() + " - " + "\n" +
	StrFormat("High  %g   \nLow  %g \nOpen  %g \nClose  %g \nVolume  %g ", H, L, O, C, V));
WriteIf(Vpc,"====================\nVolume Analysis Commentary:","");

WriteIf(upThrustBartrue , "\nUp-thrusts are designed to catch stops and to mislead as many traders as possible. " +
	"They are normally seen after there has been weakness in the background. The market makers know that the " +
	"market is weak, so the price is marked up to catch stops, encourage traders to go long in a weak market, " +
	"AND panic traders that are already Short into covering their very good position.","")
+
WriteIf(upThrustCond3,"\n  This upthrust bar is at high volume. This is a sure sign of weakness. One may even seriously " +
	"consider ending the Longs AND be ready to reverse","")
+
WriteIf(upThrustBartrue OR upThrustCond3,"\nAlso note that A wide spread " +
	"down-bar that appears immediately after any up-thrust, tends to confirm the weakness (the market makers are " +
	"locking in traders into poor positions). With the appearance of an upthrust you should " +
	"certainly be paying attention to your trade AND your stops. On many upthrusts you will find that the market will " +
	"'test' almost immediately.","")
+
WriteIf(upThrustCond1, "\nA wide spread down bar following a Upthrust Bar. " +
	"This confirms weakness. The Smart Money is locking in Traders into poor positions","");

WriteIf(upThrustCond2 , "\nAlso here the volume is high( Above Average).This is a sure sign of weakness. The Smart Money is " +
	"locking in Traders into poor positions","")
+
WriteIf(strengthDown, "\nStrength Bar. The stock has been in a down Trend. An upbar " +
	"with higher Volume closing near the High is a sign of strength returning. The downtrend is likely to reverse soon. ","")
+
WriteIf(strengthDown1,"\nHere the volume is very much above average. This makes this indication more stronger. ","")
+
WriteIf(buyCond,"\nThe previous bar saw strength coming back. This upbar confirms strength. ","")
+
WriteIf(PseudoUpThrust,"\nA pseudo Upthrust. This normally appears after an Up Bar with above average volume. This looks like an upthrust bar " +
	"closing down near the Low. But the Volume is normally Lower than average. this is a sign of weakness.If the Volume is High then weakness " +
	"increases. Smart Money is trying to trap the retailers into bad position. ","")
+
WriteIf(pseudoUtCond, "\nA downbar after a pseudo Upthrust Confirms weakness. If the volume is above average the weakness is increased. ","")
+
WriteIf(lowVolTest1,"\nThe previous bar was a successful Test of supply. The current bar is a upbar with higher volume. This confirms strength","")
+
WriteIf(distributeBar,"\nA wide range, high volume bar in a up trend closing down is an indication the Distribution is in progress. " +
	"The smart money 	is Selling the stock to the late Comers rushing to Buy the stock NOT to be Left Out Of a Bullish move. ","")
+
WriteIf(lowVolTest2,"\nThe previous bar was a successful Test of supply. The current bar is a upbar with higher volume. This confirms strength","")
+
WriteIf(trendChange,"\nThe stock has been moving up on high volume. The current bar is a Downbar with high volume. Indicates weakness and probably end of the up move","")
+
WriteIf(effortUp,"\nEffort to Rise bar. This normally found in the beginning of a Markup Phase and is bullish sign. " +
	"These may be found at the top of an Upmove as the Smart money makes a last effort to move the price to the maximum","")
+
WriteIf(effortDown,"\nEffort to Fall bar. This normally found in the beginning of a Markdown phase.","")
+
WriteIf(noSupplyBar,"\nNo Supply. A no supply bar indicates supply has been removed and the Smart money can markup the price. It is better to wait for confirmation","")
+
WriteIf(stopVolume,"\nStopping Volume. This will be an downbar during a bearish period closing towards the Top accompanied by High volume. " +
	"A stopping Volume normally indicates that smart money is absorbing the supply which is a Indication that they are Bullishon the MArket. " +
	"Hence we Can expect a reversal in the down trend. ","")
+
WriteIf(noDemandBar, "\nNo Demand Brief Description: \n  Any up bar which closes in the middle OR Low, especially if the Volume has fallen off, is a potential sign of weakness. " +
	"Things to Look Out for: \n  if the market is still strong, you will normally see signs of strength in the next few bars, which will most probably show itself as a: " +
	"* Down bar with a narrow spread, closing in the middle OR High. * Down bar on Low Volume.","");
_SECTION_END();
//====================================================================================|
//                       Support & Resistance  Lines                                  |
//====================================================================================|
_SECTION_BEGIN("RS Lines");
// AFL By Karthikmarar
// RESISTANCE AND SUPPORT LINES AFL VERSION 2.00
// Provids upto total 20 lines. Two Adjustable Parameters. 1) Sensitivity and 2) Number of lines
// Depending on the Share Volatility, the Sensitivity Factor can be adjusted
// Support Lines are colored Blue and Resistance Line are colored Red.
SetChartOptions(0,chartShowArrows|chartShowDates);
sr=ParamToggle("Plot Supp/Res lines","No|Yes" ,0);
Per=Param("Sensitivity",6,2,15,1);
g=Param("No.of Lines",5,1,10,1);
x=Cum(1);
Pk1=PeakBars(H,per,1)== 0;
Tk1=TroughBars(L,per,1)== 0;
//peak detection
px1=LastValue(ValueWhen(pk1,x,1));
px2=LastValue(ValueWhen(Pk1,x,2));
px3=LastValue(ValueWhen(Pk1,x,3));
px4=LastValue(ValueWhen(pk1,x,4));
px5=LastValue(ValueWhen(Pk1,x,5));
px6=LastValue(ValueWhen(Pk1,x,6));
px7=LastValue(ValueWhen(pk1,x,7));
px8=LastValue(ValueWhen(Pk1,x,8));
px9=LastValue(ValueWhen(Pk1,x,9));
px10=LastValue(ValueWhen(Pk1,x,10));
//Trough  Detection
tx1=LastValue(ValueWhen(Tk1,x,1));
tx2=LastValue(ValueWhen(Tk1,x,2));
tx3=LastValue(ValueWhen(Tk1,x,3));
tx4=LastValue(ValueWhen(Tk1,x,4));
tx5=LastValue(ValueWhen(Tk1,x,5));
tx6=LastValue(ValueWhen(Tk1,x,6));
tx7=LastValue(ValueWhen(Tk1,x,7));
tx8=LastValue(ValueWhen(Tk1,x,8));
tx9=LastValue(ValueWhen(Tk1,x,9));
tx10=LastValue(ValueWhen(Pk1,x,10));
//values when Peaks occured
XT1 =LastValue(ValueWhen(pk1,H,1));
XT2 =LastValue(ValueWhen(Pk1,H,2));
XT3 =LastValue(ValueWhen(Pk1,H,3));
XT4 =LastValue(ValueWhen(pk1,H,4));
XT5 =LastValue(ValueWhen(Pk1,H,5));
XT6 =LastValue(ValueWhen(Pk1,H,6));
XT7 =LastValue(ValueWhen(pk1,H,7));
XT8 =LastValue(ValueWhen(Pk1,H,8));
XT9 =LastValue(ValueWhen(Pk1,H,10));
XT10 =LastValue(ValueWhen(Pk1,H,10));
//Value when troughs occured
YT1 =LastValue(ValueWhen(tk1,L,1));
YT2 =LastValue(ValueWhen(tk1,L,2));
YT3 =LastValue(ValueWhen(tk1,L,3));
YT4 =LastValue(ValueWhen(tk1,L,4));
YT5 =LastValue(ValueWhen(tk1,L,5));
YT6 =LastValue(ValueWhen(tk1,L,6));
YT7 =LastValue(ValueWhen(tk1,L,7));
YT8 =LastValue(ValueWhen(tk1,L,8));
YT9 =LastValue(ValueWhen(tk1,L,10));
YT10 =LastValue(ValueWhen(tk1,L,10));
LastBar = Cum(1) == LastValue(Cum(1));
//plot peak lines
Plot(IIf(x>px1 AND g>=1 AND sr,XT1,Null),"P1",IIf( LastValue(C)>XT1, colorBlue, colorRed ));
Plot(IIf(x>px2 AND g>=2 AND sr,XT2,Null),"P2",IIf( LastValue(C)>XT2, colorBlue, colorRed ));
Plot(IIf(x>px3 AND g>=3 AND sr,XT3,Null),"P3",IIf( LastValue(C)>XT3, colorBlue, colorRed ));
Plot(IIf(x>px4 AND g>=4 AND sr,XT4,Null),"P4",IIf( LastValue(C)>XT4, colorBlue, colorRed ));
Plot(IIf(x>px5 AND g>=5 AND sr,XT5,Null),"P5",IIf( LastValue(C)>XT5, colorBlue, colorRed ));
Plot(IIf(x>px6 AND g>=6 AND sr,XT6,Null),"P6",IIf( LastValue(C)>XT6, colorBlue, colorRed ));
Plot(IIf(x>px7 AND g>=7 AND sr,XT7,Null),"P7",IIf( LastValue(C)>XT7, colorBlue, colorRed ));
Plot(IIf(x>px8 AND g>=8 AND sr,XT8,Null),"P8",IIf( LastValue(C)>XT8, colorBlue, colorRed ));
Plot(IIf(x>px9 AND g>=9 AND sr,XT9,Null),"P9",IIf( LastValue(C)>XT9, colorBlue, colorRed ));
Plot(IIf(x>px10 AND g>=10 AND sr,XT10,Null),"P10",IIf( LastValue(C)>XT10, colorBlue, colorRed ));
//plot Trough lines
Plot(IIf(x>tx1 AND g>=1 AND sr,YT1,Null),"T1",IIf( LastValue(C)>YT1, colorBlue, colorRed ));
Plot(IIf(x>tx2 AND g>=2 AND sr,YT2,Null),"T2",IIf( LastValue(C)>YT2, colorBlue, colorRed ));
Plot(IIf(x>tx3 AND g>=3 AND sr,YT3,Null),"T3",IIf( LastValue(C)>YT3, colorBlue, colorRed ));
Plot(IIf(x>tx4 AND g>=4 AND sr,YT4,Null),"T4",IIf( LastValue(C)>YT4, colorBlue, colorRed ));
Plot(IIf(x>tx5 AND g>=5 AND sr,YT5,Null),"T5",IIf( LastValue(C)>YT5, colorBlue, colorRed ));
Plot(IIf(x>tx6 AND g>=6 AND sr,YT6,Null),"T6",IIf( LastValue(C)>YT6, colorBlue, colorRed ));
Plot(IIf(x>tx7 AND g>=7 AND sr,YT7,Null),"T7",IIf( LastValue(C)>YT7, colorBlue, colorRed ));
Plot(IIf(x>tx8 AND g>=8 AND sr,YT8,Null),"T8",IIf( LastValue(C)>YT8, colorBlue, colorRed ));
Plot(IIf(x>tx9 AND g>=9 AND sr,YT9,Null),"T9",IIf( LastValue(C)>YT9, colorBlue, colorRed ));
Plot(IIf(x>tx10 AND g>=10 AND sr,YT10,Null),"T10",IIf( LastValue(C)>YT10, colorBlue, colorRed ));
//Crossing Resistance Lines
xt1c=Cross(C,xt1);
xt2c=Cross(C,xt2);
xt3c=Cross(C,xt3);
xt4c=Cross(C,xt4);
xt5c=Cross(C,xt5);
xt6c=Cross(C,xt6);
xt7c=Cross(C,xt7);
xt8c=Cross(C,xt8);
xt9c=Cross(C,xt9);
xt10c=Cross(C,xt10);
//Breaking support Lines
yt1c=Cross(yt1,C);
yt2c=Cross(yt2,C);
yt3c=Cross(yt3,C);
yt4c=Cross(yt4,C);
yt5c=Cross(yt5,C);
yt6c=Cross(yt6,C);
yt7c=Cross(yt7,C);
yt8c=Cross(yt8,C);
yt9c=Cross(yt9,C);
yt10c=Cross(yt10,C);
//Resistance approaching
ax1=C<xt1 AND C>xt1*0.97;
ax2=C<xt2 AND C>xt2*0.97;
ax3=C<xt3 AND C>xt3*0.97;
ax4=C<xt4 AND C>xt4*0.97;
ax5=C<xt5 AND C>xt5*0.97;
ax6=C<xt6 AND C>xt6*0.97;
ax7=C<xt7 AND C>xt7*0.97;
ax8=C<xt8 AND C>xt8*0.97;
ax9=C<xt9 AND C>xt9*0.97;
ax10=C<xt10 AND C>xt10*0.97;
//Support approaching
ay1=C>yt1 AND C<yt1*1.03;
ay2=C>yt2 AND C<yt2*1.03;
ay3=C>yt3 AND C<yt3*1.03;
ay4=C>yt4 AND C<yt4*1.03;
ay5=C>yt5 AND C<yt5*1.03;
ay6=C>yt6 AND C<yt6*1.03;
ay7=C>yt7 AND C<yt7*1.03;
ay8=C>yt8 AND C<yt8*1.03;
ay9=C>yt9 AND C<yt9*1.03;
ay10=C>yt10 AND C<yt10*1.03;
//Resistance lines commentary
src1=xt1c OR xt2c OR xt3c OR xt4c OR xt5c OR xt6c OR xt7c OR xt8c OR xt9c OR xt10c OR yt1c OR yt2c OR yt3c OR yt4c OR yt5c OR yt6c OR yt7c OR yt8c OR yt9c OR yt10c;
src2=ax1 OR ax2 OR ax3 OR ax4 OR ax5 OR ax6 OR ax7 OR ax8 OR ax9 OR ax10 OR ay1 OR ay2 OR ay3 OR ay4 OR ay5 OR ay6 OR ay7 OR ay8 OR ay9 OR ay10;
WriteIf(src1 OR src2,"------------------------------------------","");
WriteIf(src1 OR src2,"SUPPORT/RESISTANCE COMMENTARY:\n","");
WriteIf(xt1c AND V>volAvg,"Resistance at "+xt1+"  crossed with high volume.Bullish.",
WriteIf(xt1c AND V<volAvg,"Resistance at "+xt1+"  crossed, but volume is less. caution adviced."," "))+
WriteIf(xt2c AND V>volAvg,"Resistance at "+xt2+"  crossed with high volume.Bullish.",
WriteIf(xt2c AND V<volAvg,"Resistance at "+xt2+"  crossed, but volume is less. caution adviced."," "))+
WriteIf(xt3c AND V>volAvg,"Resistance at "+xt3+"  crossed with high volume.Bullish.",
WriteIf(xt3c AND V<volAvg,"Resistance at "+xt3+"  crossed, but volume is less. caution adviced."," "))+
WriteIf(xt4c AND V>volAvg,"Resistance at "+xt4+"  crossed with high volume.Bullish.",
WriteIf(xt4c AND V<volAvg,"Resistance at "+xt4+"  crossed, but volume is less. caution adviced."," "))+
WriteIf(xt5c AND V>volAvg,"Resistance at "+xt5+"  crossed with high volume.Bullish.",
WriteIf(xt5c AND V<volAvg,"Resistance at "+xt5+"  crossed, but volume is less. caution adviced."," "))+
WriteIf(xt6c AND V>volAvg,"Resistance at "+xt6+"  crossed with high volume.Bullish.",
WriteIf(xt6c AND V<volAvg,"Resistance at "+xt6+"  crossed, but volume is less. caution adviced."," "))+
WriteIf(xt7c AND V>volAvg,"Resistance at "+xt7+"  crossed with high volume.Bullish.",
WriteIf(xt7c AND V<volAvg,"Resistance at "+xt7+"  crossed, but volume is less. caution adviced."," "))+
WriteIf(xt8c AND V>volAvg,"Resistance at "+xt8+"  crossed with high volume.Bullish.",
WriteIf(xt8c AND V<volAvg,"Resistance at "+xt8+"  crossed, but volume is less. caution adviced."," "))+
WriteIf(xt9c AND V>volAvg,"Resistance at "+xt9+"  crossed with high volume.Bullish.",
WriteIf(xt9c AND V<volAvg,"Resistance at "+xt9+"  crossed, but volume is less. caution adviced."," "))+
WriteIf(xt10c AND V>volAvg,"Resistance at "+xt10+" crossed with High Volume.Bullish.",
WriteIf(xt10c AND V<volAvg,"Resistance at "+xt10+" crossed, but volume is less. caution adviced."," "));
//Support line breaks Commentary
WriteIf(yt1c AND V>volAvg,"Support at "+yt1+"  is broken with high volume.Bearish.",
WriteIf(yt1c AND V<volAvg,"Support at "+yt1+"  is broken, but volume is less. caution adviced."," "))+
WriteIf(yt2c AND V>volAvg,"Support at "+yt2+"  is broken with high volume.Bearish.",
WriteIf(yt2c AND V<volAvg,"Support at "+yt2+"  is broken, but volume is less. caution adviced."," "))+
WriteIf(yt3c AND V>volAvg,"Support at "+yt3+"  is broken with high volume.Bearish.",
WriteIf(yt3c AND V<volAvg,"Support at "+yt3+"  is broken, but volume is less. caution adviced."," "))+
WriteIf(yt4c AND V>volAvg,"Support at "+yt4+"  is broken with high volume.Bearish.",
WriteIf(yt4c AND V<volAvg,"Support at "+yt4+"  is broken, but volume is less. caution adviced."," "))+
WriteIf(yt5c AND V>volAvg,"Support at "+yt5+"  is broken with high volume.Bearish.",
WriteIf(yt5c AND V<volAvg,"Support at "+yt5+"  is broken, but volume is less. caution adviced."," "))+
WriteIf(yt6c AND V>volAvg,"Support at "+yt6+"  is broken with high volume.Bearish.",
WriteIf(yt6c AND V<volAvg,"Support at "+yt6+"  is broken, but volume is less. caution adviced."," "))+
WriteIf(yt7c AND V>volAvg,"Support at "+yt7+"  is broken with high volume.Bearish.",
WriteIf(yt7c AND V<volAvg,"Support at "+yt7+"  is broken, but volume is less. caution adviced."," "))+
WriteIf(yt8c AND V>volAvg,"Support at "+yt8+"  is broken with high volume.Bearish.",
WriteIf(yt8c AND V<volAvg,"Support at "+yt8+"  is broken, but volume is less. caution adviced."," "))+
WriteIf(yt9c AND V>volAvg,"Support at "+yt9+"  is broken with high volume.Bearish.",
WriteIf(yt9c AND V<volAvg,"Support at "+yt9+"  is broken, but volume is less. caution adviced."," "))+
WriteIf(yt10c AND V>volAvg,"Support at "+yt10+"  is broken with high volume.Bearish.",
WriteIf(yt10c AND V<volAvg,"Support at "+yt10+"  is broken, but volume is less. caution adviced."," "));
//Resistance approaching Commentary
WriteIf(ax1 AND tls>0, "Price Approaching resistance at "+xt1+  ". ","")+
WriteIf(ax2 AND tls>0, "Price Approaching resistance at "+xt2+  ". ","")+
WriteIf(ax3 AND tls>0, "Price Approaching resistance at "+xt3+  ". ","")+
WriteIf(ax4 AND tls>0, "Price Approaching resistance at "+xt4+  ". ","")+
WriteIf(ax5 AND tls>0, "Price Approaching resistance at "+xt5+  ". ","")+
WriteIf(ax6 AND tls>0, "Price Approaching resistance at "+xt6+  ". ","")+
WriteIf(ax7 AND tls>0, "Price Approaching resistance at "+xt7+  ". ","")+
WriteIf(ax8 AND tls>0, "Price Approaching resistance at "+xt8+  ". ","")+
WriteIf(ax9 AND tls>0, "Price Approaching resistance at "+xt9+  ". ","")+
WriteIf(ax10 AND tls>0, "Price Approaching resistance at "+xt10+ ". ","");
WriteIf(ay1 AND tls<0, "Price Approaching Support at "+yt1+  ". ","")+
WriteIf(ay2 AND tls<0, "Price Approaching Support at "+yt2+  ". ","")+
WriteIf(ay3 AND tls<0, "Price Approaching Support at "+yt3+  ". ","")+
WriteIf(ay4 AND tls<0, "Price Approaching Support at "+yt4+  ". ","")+
WriteIf(ay5 AND tls<0, "Price Approaching Support at "+yt5+  ". ","")+
WriteIf(ay6 AND tls<0, "Price Approaching Support at "+yt6+  ". ","")+
WriteIf(ay7 AND tls<0, "Price Approaching Support at "+yt7+  ". ","")+
WriteIf(ay8 AND tls<0, "Price Approaching Support at "+yt8+  ". ","")+
WriteIf(ay9 AND tls<0, "Price Approaching Support at "+yt9+  ". ","")+
WriteIf(ay10 AND tls<0, "Price Approaching Support at "+yt10+  ". ","");
_SECTION_END();
//==========================================================================|
//                    Volume Lines Module                                   |
//==========================================================================|
// AFL Karthikmarar
// HIGH VOLUME LINES AFL VERSION 1.00
// Provids upto total 20 lines. Number of lines Adjustable from Parameter window
_SECTION_BEGIN("High Volume Lines");
vr=ParamToggle("Plot High volume lines","No|Yes" ,0);
j=Param("No.of High vol Lines",5,1,20,1);
k=Param("Volume factor",2,1.5,3,0.5);
y=Cum(1);
Hk1=V>k*volAvg;
//High volume detection
hx1=LastValue(ValueWhen(hk1,y,1));
hx2=LastValue(ValueWhen(hk1,y,2));
hx3=LastValue(ValueWhen(hk1,y,3));
hx4=LastValue(ValueWhen(hk1,y,4));
hx5=LastValue(ValueWhen(hk1,y,5));
hx6=LastValue(ValueWhen(hk1,y,6));
hx7=LastValue(ValueWhen(hk1,y,7));
hx8=LastValue(ValueWhen(hk1,y,8));
hx9=LastValue(ValueWhen(hk1,y,9));
hx10=LastValue(ValueWhen(hk1,y,10));
hx11=LastValue(ValueWhen(hk1,y,11));
hx12=LastValue(ValueWhen(hk1,y,12));
hx13=LastValue(ValueWhen(hk1,y,13));
hx14=LastValue(ValueWhen(hk1,y,14));
hx15=LastValue(ValueWhen(hk1,y,15));
hx16=LastValue(ValueWhen(hk1,y,16));
hx17=LastValue(ValueWhen(hk1,y,17));
hx18=LastValue(ValueWhen(hk1,y,18));
hx19=LastValue(ValueWhen(hk1,y,19));
hx20=LastValue(ValueWhen(hk1,y,20));
//values when High volume occured
XV1 =LastValue(ValueWhen(hk1,H,1));
XV2 =LastValue(ValueWhen(hk1,H,2));
XV3 =LastValue(ValueWhen(hk1,H,3));
XV4 =LastValue(ValueWhen(hk1,H,4));
XV5 =LastValue(ValueWhen(hk1,H,5));
XV6 =LastValue(ValueWhen(hk1,H,6));
XV7 =LastValue(ValueWhen(hk1,H,7));
XV8 =LastValue(ValueWhen(hk1,H,8));
XV9 =LastValue(ValueWhen(hk1,H,9));
XV10 =LastValue(ValueWhen(hk1,H,10));
XV11 =LastValue(ValueWhen(hk1,C,11));
XV12 =LastValue(ValueWhen(hk1,C,12));
XV13 =LastValue(ValueWhen(hk1,C,113));
XV14 =LastValue(ValueWhen(hk1,C,14));
XV15 =LastValue(ValueWhen(hk1,C,15));
XV16 =LastValue(ValueWhen(hk1,C,16));
XV17 =LastValue(ValueWhen(hk1,C,17));
XV18 =LastValue(ValueWhen(hk1,C,18));
XV19 =LastValue(ValueWhen(hk1,C,19));
XV20 =LastValue(ValueWhen(hk1,C,20));
LastBar = Cum(1) == LastValue(Cum(1));
//plot High Volume lines
Plot(IIf(y>hx1 AND j>=1 AND Vr,xv1,Null),"v1",colorYellow);
Plot(IIf(y>hx2 AND j>=2 AND Vr,xv2,Null),"v2",colorYellow);
Plot(IIf(y>hx3 AND j>=3 AND Vr,xv3,Null),"v3",colorYellow);
Plot(IIf(y>hx4 AND j>=4 AND Vr,xv4,Null),"v4",colorYellow);
Plot(IIf(y>hx5 AND j>=5 AND Vr,xv5,Null),"v5",colorYellow);
Plot(IIf(y>hx6 AND j>=6 AND Vr,xv6,Null),"v6",colorYellow);
Plot(IIf(y>hx7 AND j>=7 AND Vr,xv7,Null),"v7",colorYellow);
Plot(IIf(y>hx8 AND j>=8 AND Vr,xv8,Null),"v8",colorYellow);
Plot(IIf(y>hx9 AND j>=9 AND Vr,xv9,Null),"v9",colorYellow);
Plot(IIf(y>hx10 AND j>=10 AND Vr,xv10,Null),"v10",colorYellow);
Plot(IIf(y>hx11 AND j>=11 AND Vr,xv11,Null),"v11",colorYellow);
Plot(IIf(y>hx12 AND j>=12 AND Vr,xv12,Null),"v12",colorYellow);
Plot(IIf(y>hx13 AND j>=13 AND Vr,xv13,Null),"v13",colorYellow);
Plot(IIf(y>hx14 AND j>=14 AND Vr,xv14,Null),"v14",colorYellow);
Plot(IIf(y>hx15 AND j>=15 AND Vr,xv15,Null),"v15",colorYellow);
Plot(IIf(y>hx16 AND j>=16 AND Vr,xv16,Null),"v16",colorYellow);
Plot(IIf(y>hx17 AND j>=17 AND Vr,xv17,Null),"v17",colorYellow);
Plot(IIf(y>hx18 AND j>=18 AND Vr,xv18,Null),"v18",colorYellow);
Plot(IIf(y>hx19 AND j>=19 AND Vr,xv19,Null),"v19",colorYellow);
Plot(IIf(y>hx20 AND j>=20 AND Vr,xv20,Null),"v20",colorYellow);
_SECTION_END();


/////////////////////////////

// Supertrend - Translated from Kolier MQ4
// see: http://kolier.li/indicator/kolier-supertrend-indi
// translation in Amibroker AFL code by E.M.Pottasch, 2011

procedure calcTrend_proc(ATR_Period,tr,ATR_Multiplier,TrendMode,CalcPrice)
{
global buffer_line_down;
global buffer_line_up;
buffer_line_down = Null;
buffer_line_up = Null;

PHASE_NONE = 0;
PHASE_BUY = 1;
PHASE_SELL = -1;

phase=PHASE_NONE;
band_upper = 0;band_lower = 0;

for(i = ATR_Period + 1; i < BarCount; i++)
{
    band_upper = CalcPrice[i] + ATR_Multiplier * tr[i];
    band_lower = CalcPrice[i] - ATR_Multiplier * tr[i];

    if(phase==PHASE_NONE)
    {
        buffer_line_up[i] = CalcPrice[i];
        buffer_line_down[i] = CalcPrice[i];
    }
    if(phase!=PHASE_BUY && Close[i]>buffer_line_down[i-1] && !IsEmpty(buffer_line_down[i-1]))
    {
        phase = PHASE_BUY;
        buffer_line_up[i] = band_lower;
        buffer_line_up[i-1] = buffer_line_down[i-1];
    }
    if(phase!=PHASE_SELL && Close[i]<buffer_line_up[i-1] && !IsEmpty(buffer_line_up[i-1]))
    {
        phase = PHASE_SELL;
        buffer_line_down[i] = band_upper;
        buffer_line_down[i-1] = buffer_line_up[i-1];
    }
    if(phase==PHASE_BUY && ((TrendMode==0 && !IsEmpty(buffer_line_up[i-2])) || TrendMode==1) )
    {
        if(band_lower>buffer_line_up[i-1])
        {
            buffer_line_up[i] = band_lower;
        }
        else
        {
            buffer_line_up[i] = buffer_line_up[i-1];
        }
    }
    if(phase==PHASE_SELL && ((TrendMode==0 && !IsEmpty(buffer_line_down[i-2])) || TrendMode==1) )
    {
        if(band_upper<buffer_line_down[i-1])
        {
            buffer_line_down[i] = band_upper;
        }
        else
        {
            buffer_line_down[i] = buffer_line_down[i-1];
        }
    }
}
}

SetBarsRequired(sbrAll,sbrAll);

TrendMode = ParamToggle("TrendMode","Off|On",1);
ATR_Multiplier = Param("ATR_Multiplier",2,0.1,10,0.1);
ATR_Period = Param( "ATR_Period",5,1,20,1);
tr = ATR(ATR_Period);

CalcPrice = (H+L)/2;
calcTrend_proc(ATR_Period,tr,ATR_Multiplier,TrendMode,CalcPrice);

SetChartOptions(0,chartShowDates);
//Plot(C,"C",colorWhite,64);

if ( TrendMode == 1 )
{
    Plot( buffer_line_up, "\ntu", ColorRGB( 28, 134, 238 ), styleThick );
    Plot( buffer_line_down, " // td", ColorRGB( 205, 51, 51 ), styleThick );


    Plot( 4, "", IIf( buffer_line_up, colorBrightGreen, colorBlack ), styleOwnScale | styleArea | styleNoLabel, -0.5, 100 );
    Plot( 6, "", IIf( buffer_line_down, colorRed, colorBlack ), styleOwnScale | styleArea | styleNoLabel, -0.5, 100 );
}
109 comments
Leave Comment
Please login here to leave a comment.
satc1 unidentified error showing
Dear Bro,
As Vinod061 Said there is an error as it mentioned.
Regards,
MrDJ
I am also getting the same error as mentioned in the above
I did asked Amibroker support about this error, they replied me:
The formula seems to be using functions exposed to AFL from an external plugin (SATC1 function for example), so you would need to check with the code authors where to get it from.
Anybody can help!
Thank you very much.
how can i contact to u for nest automation ??
my id yaskanpatel@gmail.com
correct the errors with this lines:
if (autotrader == 1);// SATC1 (Open, High, Low, Close, Volume, Aux1, Aux2, Buy, Sell, Sell, Buy);
closePosition = IIf(closeFactor==0,avgSpread,clsPosition);
beware: this system is ultra looking forward, is not good for real trading, admin why did you post this indicator?
@vinod061, @DJ123143, @kishorektk, @chaser2009, @tradermind
Please remove these lines from program:
autotrader= ParamToggle( “Automate Trade”, “No|Yes”, 0 );
if (autotrader == 1);// SATC1 (Open, High, Low, Close, Volume, Aux1, Aux2, Buy, Sell, Sell, Buy);
This is only for auto trading using program provided by comely. My bad that I included this in program.
@YASKAN PATEL: you can contact me with your requirements at xesachin[at]gmail[dot]com
Keep trading as simple as possible. This program has multiple indicators which have relevant at different times. Once you master understanding this program, you can ride on back of operators.
I am listing some examples below:
*- Minor/major trend (yellow text) indicate momentary trends within long/short trends in message board.
- I always for next candle to confirm the signal since signal may adjust itself to give you best trade. When I get a buy signal, I wait for next 1 or 2 candles to confirm the same. Indicators are not hard indicators i.e. you do not have to go long or short immediately when signal appears. Indicators are to make you ready to take or cover position.
- Volume profiler is useful during last 30 minutes of trade. Price tend to move towards high volume area.
- Targets are defined for those who want to play little safe and do not want to risk money for additional profit (or say loss).
- Fibonacci retracement helps understand price where reversal may happen. Golden rule says majority of reversal takes place between 52% and 68% zone.
- Some stocks are purely bound by pivot points. If you wish to use PP instead of Fibonacci, you can do so from parameters window.
- Sentiments bar is good for understanding the quantum of current trend or counter trend. Counter trend trade is not recommended for beginners or intermediate traders.
- Candle analysis is indicative and is useful to identify movers that are stop loss catchers.
*
I agree this is forward looking program and might not be much useful for beginners. However trading does not allow a trader to remain beginner for ever.
Like I said, this program works wonderfully with automation. Please contact me if you are willing to automate NEST trading with Amibroker.
I strongly recommend that you Backtest it on your stocks in Ami before using. Best used with 1M (aggressive) or 5M (easy) timeframe.
Hi Sachin,
Thanks a ton for sharing this AFL and all other info. Could you please help me in NEST automation, how could Ii do it.
much appreciated for the knowledge that you have shared us here. Thanks
my email : ntadi28@gmail.com
Thanks
Thanks. Thanks. Many thanks xesachin. Worked perfectly on my all stocks.
Removed code lines as suggested. Bull’e eye.
This is great. Sent you email for some additional requirements. Please check.
I have tried satc previously. It does not work good. Plus comely people are high attitude people with poor or no attention to my emails. Are you provide satc only or some other program. SATC does not work properly.
hi giv me ur contact i need auto for nest
Thanks much @dikiya, @ntadi28, and @wiseman.
@vijaykiran – Just replied to your email. My bad I could not reply early. Your license has been upgraded. Please click “Update License” in autotrade menu.
@Sudhakar – Its not satc or third party product. It is .net plugin integrated with software for automated trade
@Teju – please write to me at xesachin[at]gmail[dot]com.
peakbars and troughbars used in this system look into the future.
first of all thank you xesachin..
my question is:- you told to use 1M or 5M TF…
i can see that even 5M giving more signals in a day, so should i stick with 5M or work on 15M ?
another question is, for automation which broker we need ?
@abhishek7271:
1. I don’t recommend 15M with this AFL. Ideally you should not get more than 5-6 signals a day in 5M timeframe unless stock is highly volatile. Nevertheless, I will check it. Please share stock name (you can write me at xesachin[at]gmail[dot]com.
2. It can be any broker but must be providing NEST Trader Software. Brokers like RKSV and Zerodha are good (my personal opinion) for intraday. Both provide NEST trader. Others like sharekhan, icici direct can be very costly for intraday trade.
Hi Sachin,
I am observing this AFL today & bus/sell signals are disappearing suddenly.
scary to trust this AFL. it has to be improvised for more accurate and perfect signals.
but thanks for sharing this AFL.
Thanks
error found in this AFL….Autotrader giving error…correct that
Please upload the correct code, iam getting errors Sachin..
please refer above image as i said its giving too many signals
Link to image
@ntadi28: This is forward looking strategy. That is it will confirm if minor/major trend is building. If not, it will shift to give right entry/exit point. As I mentioned in previous comment, signals should not be treated as hard signal. “Signals are to make you ready”. Wait for 1 or 2 candles to confirm the trend. I know it can be annoying to see signals shifting. But this is how advanced trading strategies work. You might want to try Southwind. It also works on forward looking principle and gives 3 squares for confirmation. However limitation is that sometimes 2 squares disappear which can lead to incorrect trade. Thus, I removed redundancies in my AFL. Currently, alert comes when trend is confirmed. At points you may get multiple alerts at same time. In such case, wait for next few candle sticks. Hope this helps.
@s29ajay, @sethideep:
please remove these lines from code:
autotrader= ParamToggle( “Automate Trade”, “No|Yes”, 0 );
if (autotrader == 1) SATC1 (Open, High, Low, Close, Volume, Aux1, Aux2, Buy, Sell, Sell, Buy);
Let me know if any other error.
@abhishek7271:
Replied to your email. In case of high volatility or side trends, AFL will capture all buy/sell signals at end of every peak/trough. Please back test it on 15M timeframe. I will also check it for next few days :)
Thanks Sachin and that’s nice explanation.
As you mentioned that “Thus, I removed redundancies in my AFL. Currently, alert comes when trend is confirmed.”
Could you please share the corrected AFL which alerts when trend is confirmed. it would be wonderful in that case.
I have been verifying numerous AFL codes/indicators but most of them has their own disadvantages in giving incorrect/fake signals. I don’t know when my search going to be end in finding the perfect/accurate buy/sell signals AFL/strategy for a particular time frame(either for intra-day or for short time-frame.
Hope, this indicator helps…will see
thanks for worthy reply.
Thanks
ntadi28[at]gmail.com
all of above my dear traders this is the PURELY RE-PAINTING INDICATOR THEN WHY THIS ABOVE DISCUSSION THANKYOU
@mony, yes it could be a re-painting stuff. where is our genius to provide an ultimate AFL code to get worthy signals?.
do you have any awesome AFL indicator which is tested to be proven results? please share
Thanks mony
I COMBINED ALL THOSE CAN USEFULL IN INTRADAY TRADING SYSTEM ……..SO JUST WATCH AND TRADE MY……..IN 10 MIN . tIME fRAME …………..JUST CONSIDER RED AND GREEN SIGNALS AND USE AS BREAKOUT TRP LINES ANS BLUE GREEN LINES,,,,,,,,,,,,,,,,,,,,,,,,,,,,,,,,,,,BEEEEEE COOOOLLLLLLLLL
i can post this in this site nine months before but not approve it till today idont know why admin not aprove it it is not my own but just combind prepaired thats it ……
http://www.wisestocktrader.com/indicators/4587-just-trade-in-10-min-time-frame-and-break-out
mony9das@gmail.com
if change parameter 0.5 to 0.1 then more profitable
i am try this AFL to change as
‘’’ trend blaster v4.0 afl’’’’www.stockmaniacs.net……….BUT
NOT SUCCESS IF ANY ONE TRY THIS THEN PLEASE MAIL ME LIKE
Repeate and repeate BUY BUY BUY ……OR SELL SELL SELLL SIGNALS
generate continucely to became a big trend
any senior AFL coder or afl language experts have in this forum please please …….convert this like
‘’’ trend blaster v4.0 afl’’’’www.stockmaniacs.net………then very use full to al traders and various PARAMETERS IS allready have to every individual trader like different then no problem is create.thanks
Any one need free trend blaster 4. I have the free for all. even i have paid for it…
Hi mony,
Thanks for sharing the AFL but it has too many errors. could you please send me the corrected or error free AFL code. thanks in advance.
for instance, FHH = Ref(HHV,-FH_Marker); is giving an error 31.Syntax error, unexpected, expecting ‘(’.
like that there are several errors(around 57 errors found in your AFL).
@ocil, PLease share me the TB4.afl. thanks a lot in advance
email removed by admin
HI ocil,
Please send me the trend blaster4.afl to “email removed by admin”
and its usage details if you have. thanks
thanks
Interested. Please post for discussion in the Forum.
@mony If you need to include a large formula in your comment. Just create an indicator pastie and post a link to it.
@ntadi28, @ocil From what I know trend blaster is a copyright formula so please refrain from asking people to send it to you.
Dear Admin,
Thank you for the suggestion, will do accordingly.
Thanks
THANKS FOR SHARING AFL VERY GREAT AND USEFUL PLEASE TELL HOW TO USE FOR AUTO TRADING WITH NOW OR NEST ?
@ntadi28: Except a few times, AFL gives alert only when trend is confirmed (you will notice alert comes 1 to 3 candlesticks later). At other times, alert is to make you ready. Principle and rules are important. If you follow simple rule (of getting ready to enter/exit on alert), you will be able to maximize intraday profit. Try yourself other indicators. You will come to know how many times you were able to enter exactly at same time when alert appeared. Mostly, other indicators give alert when trend has moved on. For any trader, it takes atleast 1 or 2 candlesticks to enter trade manually, only to realize that you lost good movement.
Please see that I tested this AFL for entering/covering positions immediately when alerted by the system. Overall position has been good and positive. Yes, at times, signal shifted when short-time trend is drifted too long. But it never resulted into loss unless SL was hit. SL hits even for large houses. So do not get disheartened. Decision on exact price of entry/exit is never perfect. I doubt if there is anything such as perfect system either.
Your entry/exit should be based on multiple factors (I explained in previous post). Example, I will not enter with large Qty when buy/short signal comes with opposite sentiment (what we refer to as counter trend trade) or when AFL shows caution in dashboard. I will buy/short quite well when all indicators are good.
There are a few other indicators suggested by other users. You might want so alerts from both the AFL in real time and see how much profit/loss you make through each. Only that will tell which one is near perfection. I am willing to improve other indicators if majority says that’s the best. I have tried many in the past. One indicator is never enough for right call but more than 3 also is a mess.
ok sir i am post my indicator in……….. indcatorpasties
just-trade-in-10-min-time-frame-and-break-out
Trading on the best level, either in the medium range, or support the resistance, or Fibonacci levels. Typically, where traders put a stoploss, and from there comes the rebound. And the need to look for it levels
I looked at the code, and how to understand the system provides dynamic inputs that randomly appear and disappear?
I did not understand what it means LTQ and deep analisys mark.
@xsachin,
An Excellent explanation. I will follow the suggested.
Thanks
@ntadi28, @all: One more input, if you are finding frequent change in sentiments (bottom bar), avoid manual trading during that time. You will not be able to catch the right price. During such time, order has to be placed within seconds. With manual entry/exit, you will incur losses or may end up losing your profit. This is visible in screenshot above (See from 12:30 to 3 PM). Hope this helps.
thank you @xesachin for your sharing. i hope you always profit and sharing you strategi to us.
Hi Xesachin,
Today morning , i have observed this AFL for BANKNIFTY future and initially it was showing sell signals that was generated previous day(trend is showing as downtrend).BANK-NIFTY came down to 16288 around in the opening session and went up…suddenly buy signal came up and showing buy@16269, but the current value by the time was 16330 around(surprised how come it showing that buy@16269 when the current prie is at 16330?)
I am confused to understand it and its signals.
IF any inputs or new updates done to this AFL please let me know.
Thanks
Hi Dear Sachin,
Why not you thanks to Mehedi Arafat and www.stockbangladesh.com from where you got this AFL from A to Z. Please thanks to original author who Mixed the bunch of afls as Intraday profit maker. like VPA analysis by karthik marar etc.
Dont take the credit that you add auto trade feature.it was already there in the above sites listed the Intraday profit maker afl
Why not you named the orignal author in your afl post.
@aaron: Disappointed to see someone pasting this AFL on said website and claiming to be original author. BTW good way of promoting the website.
I would love to know from Mehedi, if he really understands the logic behind this AFL strategy.
FYI. this strategy is based on southwind’s strategy and is modified to remove redundancy. Whoever original author of base code is (Not mehedi for sure), my many thanks to him.
God bless you and him.
@ntadi28: Did you click on back time candlestick by any chance. This is known bug at the moment. If you click on older candlestick, alert pop-ups for previous sell signal. So keep latest bar selected.
@sachin—-
till i m not getting anything about yor auto plugin… no reply of my mail
pls do somthing for that…
thanks
@Yasken: My bad I could not reply to emails for auto trader request. We have added more features and are in final stage of testing. Since this is still beta stage product, I wanted to go slow on it. Please let me know if are interested in beta version. I can provide free trial for 7 days instead but you will have to be careful for any bug while using it. Alternatively, I will contact all who have shown interest in possibly a week’s time.
@sachin…
no problem dear….
i like to use beta version… and as u said be careful about bug… i m ready to close observe…
doing new mail to u… thnks bro..
xesachin Sir,
Your afl was too good. i am really too happy. Now i have two doubts. please explain me.
1) how do backtest checking.
2) IN odin how do set the autotrade. its possible or not.
xesachin pls give ur contact no satish1brediffmail.comXESACHIN PLEASE PROVIDE ME 7 DAY TRAIL OF YOUR BETA VERSION AFL BCOZ OF I AM INTERESTED TO PURCHASE PAID AFL SEND TRAIL AFL ON MY MAIL:ASADARIF92@GMAIL.COM
GENUINE BUYER
xesachin, you wrote…
if he really understands the logic behind this AFL strategy.Can you write about?
Sachin Bro, Thank u 4 sharing such a feature rich AFL
I hve alrdy mailed u abt Backtesting hurdle and, more importantly, abt my enthusiasm towards the auto trade plugin .
A beta version wud b just fine ,eager to try out.
Looking forward 2 ur quick response.
….G.Meyyl….
@all, thanks for your overwhelming response. Auto trader is now available for download at http://www.dynanode.com/downloads/setup.zip
Refer to help manual for installation instructions at http://www.dynanode.com/help/.
Unfortunately, I will not be able to provide support over phone. Soon, will enable ticketing system for you to post issues and for features requests.
Not to promote anything, but if you need customized AFL development or C# development to enhance your trading strategies and methodologies, please contact support[at]dynanode[dot]com.
I will post basic AFL for auto trader separately.
Those availing customized version need not change anything. This one is general beta release.
Regards,
Sachin
Hi Sachin,
I’m looking into your AFL and it looks great. However, I did not find any SL or trailing SL for the buy/ sell calls generated. Is that present in the AFL or am I missing something?
Note:- If the SL is not included, then can you please include it and provide it?
Thanks
Tej
@tej: You get exit signal as soon as trend changes. Thus no SL.
Hi xesachin
Can u please list out buy, sell, stop loss and exit rules for manual trading using this AFL. As many of the indicators you have used in this AFL looks into future, its very difficult to analyse the AFL. So please give the trading rules for this trading system
Also how are you using this trading system for Automation, when many of the indicators used in this afl are looking into the future?
Thanks
Sudha
I am getting error on line no 743 sayin variable sig used without having beein initialised. Second error is operation not allowed or Operator type mismatch.
Please tell me how to resolve this error
@hmsanil: there is already similar discussion (rules for using this afl) happened previously. Please refer to my previous posts in this thread. Let me know if you still have any question after that.
For automation, there are 2 methods:
1. Use 2 step semi-automation: You will get buy/sell indication in your trading platform. Validate buy/sell with information such as minor/major trend. If all are supportive, enter with confidence. If there is caution in message board, wait for some time as it may be a false signal or SL catcher by operators.
2. If you want to automate it fully, you have 2 best options:
a) Delay the order generation by 30 seconds or 60 seconds depending on volatility of your scrip. If you are using Dynanode Auto Trader (dynanode[dot]com), you will get this option by double clicking the scrip.
b) Add more code that will help evaluate the trends and volume (known as confirmation in technical terms).
I got a lot of queries on automation. Friends please understand that there is no public forum where any trader will help setup completely automated profit making trading system. Information you find is either good for manual trading or semi cooked for automated trade. I know it is hard fact but if everyone has automated full proof profit making system, no one will ever loose money. No money lost is no money earned. I stated hard fact of the market. It is not my own whim.
This platform is not for marketing any service but there is way a lot more that need to be done to use systems for highly profitable trade. This AFL will help you reduce losses.
Hope this helps.
@sushant09in: add line sig= "" at top of AFL. Hopefully this should resolve error. For which line did you get other error “Operator type mismatch”.
sachin how can we back-test the system as it generates error saying Array subscript is out of range.Plz let me know.
BEST AFL SACHIN
B
PLZ SHARE BETA ALSO. HIGHLY OBLIGED TO U …
ASHU
PLZ SEND IT ON RUCHIdotUNICONatGMAILdotCOM
Please share auto trader . link you shared does not look like working.
sap.4293@gmail.com
schin pls send mee ur contact no
satish1b@rediffmail.com
Dear Sachin ji,
Thanks a Ton Sachin ji.
Just uploaded your AFL and working on the same. Its too GOOD.
Also sent you test mail, please reply asap.
Prakash Modak
Pune
prakash[dot]modak65[at]gmail[dot]com
Hi Sachin,
I tried to run analysis and in scan i am getting below error.
// — Have we identified a pivot? If trend is down…
if ( aLLVBars[curBar]^
Error 10.
Array subscript out of range.
You must not access array elements outside 0..(BarCount-1) range. You attempted to access non-existing -1-th element of array.
error is in line 510 and not sure what to do..
thanks
looking good, thanks
I WANT THIS SYSTEM FOR AUTOMATION.
MY MAIL IS REIAGRO.SUNIL@GMAIL.COM
This system give Signals Buy & Sell in the reversal trend.
But we should to know the signal is strong or weak.
Mr Xesachin, do you have explore code to analyse stock deeply (Or any one)
Pls may i get in suseda.specialfx@yahoo.com
Thank you
hi Mr Xesachin
Pls mail mee ur contact no.
satishb@rediff.co.in
satish1b@rediffmail.com
thanks
hi Mr Xesachin
Pls send mee ur contact no
grzesiekk87@vp.pl
thanks
hi xesachin,
I’m very interested in auto plugin for Pi, I tried mailing you several times requesting for the plugin but support at dyananode dot com seem to be not working and delivery of message getting failed everytime. please send me your details to me. My mail id
paartha.reddy at gmail dot com. thanks.
Hi Sachin,
I have one question for you, When i open your indicator , Buy Sell Signals are displayed from past two days.When i do back test , it only starts from 2 days back, even though i have 60 days of back data, please let me know any parameters to be changed.?
Attached below screenshot

EDIT RESOLVED
Thanks,
Arjun
Hi,
Thanks for amazing AFL code. But I am unable to do scan and back test and getting following error. Could you please help me to resolve it?
Array Subscript out of range. You must not access array elements outside 0.. (Bar Count – 1) range. You attempted… (Ln: 644, Col: 26).
Please help me as I am not that very good in coding.
Thanks.
curTrend = "";
if ( aLLVBars[curBar]
-————————-^Error 10.
Array subscript out of range.
You must not access array elements outside 0..(BarCount-1) range. You attempted to access non-existing -1-th element of array.
@sabsubs and for all
Regarding the below error :-
*Array Subscript out of range. You must not access array elements outside 0.. (Bar Count – 1) range. You attempted… (Ln: 644, Col: 26).
*
while doing back test
Go to Backtester Settings window and in periodicty – Select 5 minutes
hi xesachin,
Since this AFL is completely for intraday, i request you to add a feature to squareoff orders at the end of the day, can you please let me know AFL code for the same.
Thanks,
Arjun
hi xesachin,
I am onlu getting Long Signals, Which values to be changed to get Short signals..?
Thanks,
Arjun
Error on row 721
autotrader= ParamToggle( “Automate Trade”, “No|Yes”, 0 );
if (autotrader == 1) SATC1;
Error=>if (autotrader == 1) SATC1;how to solve it?
I am getting 3 errors on line 723
error 29 closeFactor,avgSpread,clsPosition variables not initialised. Could u pls assist.
Hi,
i need details for auto trading in Nest..Pls guide me
Hello
Sachin sir
i need details for auto trading in ODIN.
dhavalthakkar77@gmail.com
plz reply
thank you in advance.
HELLO
IF ANY ONE HAVE CONTACT DETAILS MS @xesachin.
PLZ SEND ME ON dhavalthakkar77@gmail.com
plz reply
thank you in advance.
Hi,
SATC1(Open, High, Low, Close, Volume, Aux1, Aux2, Buy, Sell, Short, Cover);is developed by us. If anybody wants to know more details about auto trading software, pls contact us.
Email : santhosh@comely.co.in
Regards,
Santhosh
XESACHIN PLEASE PROVIDE ME 7 DAY TRAIL OF YOUR BETA VERSION AFL BCOZ OF I AM INTERESTED TO PURCHASE PAID AFL SEND TRAIL AFL ON MY MAIL:dhavalthakkar77@gmail.com
GENUINE BUYER
@Dhaval If you read the comments the author has already provided his/her email address. Please don’t spam the comments.
ok administrator ji
sir please send this afl my mail ide mpravinmdu@gmail.com
Hi Sachin, this is a wonderful afl.
" I always for next candle to confirm the signal since signal may adjust itself to give you best trade. When I get a buy signal, I wait for next 1 or 2 candles to confirm the same"
Could you please let me know how to change this behavior? Is it possible to hardcode the buy/sell signal? Because I’m using this afl with auto trade. The signal will disappear some times, it might give loss. I’m using Next trade option in Ami broker.
Please let me know if you can help me automate trading using this afl.
Regards
Gnanendra
m.gnanendra@yahoo.co.in
Hi Sachin,
Thanks for sharing this AFL and all other info.
much appreciated for the knowledge that you have shared us here.
NICE AFL…………. THANKS….
Regards
masumrj
ratulshafin@gmail.com
Hi Sachinji
I got below Error in ami broker
Error 10. Subscript out of range. You must not access array elements outside 0..(BarCount-1) range
and
Warning 501. Assignment within conditional. Did you mean == instead of = ?
Please do needful in above error,
Regards,
Piyush
good job, thanks!
Hi Sachin,
you have done a gret job to help fellow traders.. Hats off…
Can you post the AFL for auto trader pls
Mr Xesachin, do you have explore code to analyse stock deeply (Or any one)
Pls may i get in ovanhoang2908@gmail.com
Thank
Hi Sachin I want to do auto trading
how can i contact you
jeetu26@gmail.com
As it says it is only a warning and the formula should still work.
sir please send this afl my mail id hiteshalkari@gmail.com
Hi please send me the correct afl to santho.d.n@gmail.com since i am getting errors in it.
Best used for automated trade. I tested it with NEST automation. If you are not aware of NEST trade automation, please contact me.
I need help sir how to contact you please…I like your afl but giving errors. Give me your contact details please
Thank you
Regards
Kannan
nagercoil1975@yahoo.com
Can any one share real time performance statistics?
Is any one still using it via automation?
clsPosition = spread/closeFactor;
closePosition = IIf(closeFactor=0,avgSpread,clsPosition);
There are 2 potential errors, correct them as following:
clsPosition = spread/(closeFactor+0.0001);
closePosition = IIf(closeFactor==0,avgSpread,clsPosition);
Hello,
I am getting error @ line no 511. Array out of Range.
if ( aLLVBars[curBar] < aHHVBars[curBar] )
Please help me to resolve the same as soon as possible.
Thanks
Suresh