Supertrend V 5.0 for Amibroker (AFL)
kailashtindwani about 10 years ago Amibroker (AFL)
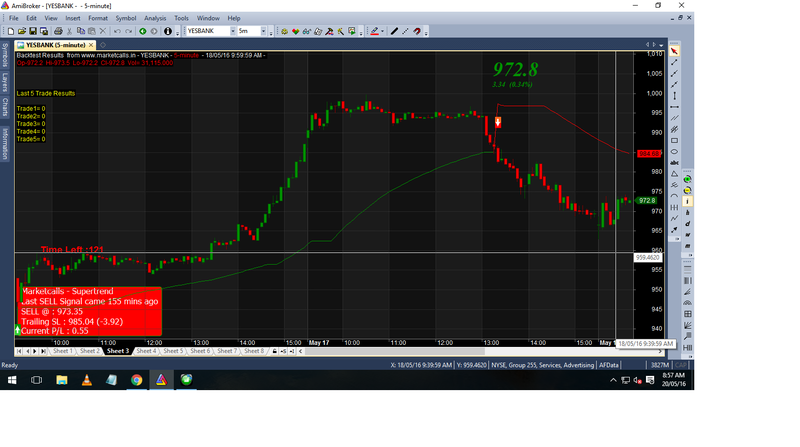
Much Refined Supertrend. Orignal author: Rajandran from Marketcalls.
Screenshots
Indicator / Formula
Copy & Paste Friendly
/* Done by    Rajandran R  */
/* Author of www.marketcalls.in  */
/* Date : 05th Apr 2016 */

function GetSecondNum()
{
    Time = Now( 4 );
    Seconds = int( Time % 100 );
    Minutes = int( Time / 100 % 100 );
    Hours = int( Time / 10000 % 100 );
    SecondNum = int( Hours * 60 * 60 + Minutes * 60 + Seconds );
    return SecondNum;
}

function PopupWindowEx( popupID, bodytext, captiontext, timeout, left, top )
{
    displayText = bodytext + captiontext;
    if ( ( StaticVarGetText( "prevPopup" + popupID ) != displayText) OR ( StaticVarGet( "prevPopupTime" + popupID ) < GetSecondNum() ) )
    {
        StaticVarSetText( "prevPopup" + popupID, displayText);
        StaticVarSet( "prevPopupTime" + popupID, GetSecondNum() + timeout );
        PopupWindow( bodytext, Captiontext + popupID, timeout, Left, top );
        PlaySound("c:\\windows\\media\\ding.wav");
    }
}


procedure DrawData (Text, x1, y1, x2, y2, colorFrom, colorTo)
{
	GfxSetOverlayMode(0);
	GfxSelectFont("Verdana", 8.5, 700);
	GfxSetBkMode(1);
	GfxGradientRect(x1, y1, x2, y2, colorFrom, colorTo);
	GfxDrawText(Text, x1, y1, x2, y2, 32|1|4|16);
}


_SECTION_BEGIN("SuperTrend Ver 5.0 with Sound and Popup Alert");

SetBarsRequired(100000,0);

GraphXSpace = 15;

SetChartOptions(0,chartShowArrows|chartShowDates);

SetChartBkColor(ParamColor("bkcolor",ColorRGB(0,0, 0)));

GfxSetBkMode(0);

GfxSetOverlayMode(1);

SetBarFillColor(IIf(C>O,ParamColor("Candle UP Color", colorGreen),IIf(C<=O,ParamColor("Candle Down Color", colorRed),colorLightGrey)));

Plot(C,"\nPrice",IIf(C>O,ParamColor("Wick UP Color", colorDarkGreen),IIf(C<=O,ParamColor("Wick Down Color", colorDarkRed),colorLightGrey)),styleCandle | styleNoTitle);

// Initial Values overrides your backtesting settings

SetOption( "InitialEquity", 1000000);
SetOption("FuturesMode" ,true);
SetOption("MinShares",1);

SetOption("AccountMargin",100);
SetOption("RefreshWhenCompleted",True);
SetTradeDelays(0,0,0,0);
SetPositionSize(300,spsshares);


HalfLife	= param("channel halflife", 5, 1, 20, 1);
ChanLen	= param("channel length", 20 , 1, 20, 1);

shrink		= 2^(-HalfLife);
shrink2	= 1 - shrink;

topChan[0]	= High[0];
botChan[0]	= Low[0];

HH	= HHV(High, ChanLen);
LL	= LLV(Low, Chanlen);

for( i = 1; i < BarCount-1; i++ ) {
	topChan[i] = shrink * H[i] + shrink2 * topChan[i-1] ;
	botChan[i] = shrink * L[i] + shrink2 * botChan[i-1] ;
	if (HH[i] >= topChan[i])	topChan[i] = HH[i];
	if (LL[i] <= botChan[i])	botChan[i] = LL[i];
	}


Up=topChan;

Dn=botChan;

TrendUp=TrendDown=Null;

trend[0]=1;

changeOfTrend=0;

flag=flagh=0;


for (i = 1; i <BarCount-1; i++) {

      TrendUp[i] = Null;

      TrendDown[i] = Null;


      trend[i]=1;


      if (Close[i]>Up[i-1]) {

         trend[i]=1;

         if (trend[i-1] == -1) changeOfTrend = 1;


      }

      else if (Close[i]<Dn[i-1]) {

         trend[i]=-1;

         if (trend[i-1] == 1) changeOfTrend = 1;

      }

      else if (trend[i-1]==1) {

         trend[i]=1;

         changeOfTrend = 0;

      }

      else if (trend[i-1]==-1) {

         trend[i]=-1;

         changeOfTrend = 0;

      }


      if (trend[i]<0 && trend[i-1]>0) {

         flag=1;

      }

      else {

         flag=0;

      }


      if (trend[i]>0 && trend[i-1]<0) {

         flagh=1;

      }

      else {

         flagh=0;

      }


      if (trend[i]>0 && Dn[i]<Dn[i-1]){

         Dn[i]=Dn[i-1];

		}


      if (trend[i]<0 && Up[i]>Up[i-1])

        { Up[i]=Up[i-1];

		}


      if (flag==1)

       {  Up[i]=topchan[i];;

        }

      if (flagh==1)

        { Dn[i]=botChan[i];;

         }

      if (trend[i]==1) {

         TrendUp[i]=Dn[i];

         if (changeOfTrend == 1) {

            TrendUp[i-1] = TrendDown[i-1];

            changeOfTrend = 0;

         }

      }

      else if (trend[i]==-1) {

         TrendDown[i]=Up[i];

         if (changeOfTrend == 1) {

            TrendDown[i-1] = TrendUp[i-1];

            changeOfTrend = 0;

         }

      }

   }


Plot(TrendUp,"Trend",colorGreen,stylenotitle);

Plot(TrendDown,"Down",colorRed,stylenotitle);


Buy = trend==1;

Sell=trend==-1;


Buy=ExRem(Buy,Sell);

Sell=ExRem(Sell,Buy);

Short=Sell;

Cover=Buy;


BuyPrice=ValueWhen(Buy,C);

SellPrice=ValueWhen(Sell,C);

ShortPrice=ValueWhen(Short,C);

CoverPrice=ValueWhen(Cover,C);


Title = EncodeColor(colorWhite)+ "Super Trend AFL code from www.marketcalls.in" + " - " +  Name() + " - " + EncodeColor(colorRed)+ Interval(2) + EncodeColor(colorWhite) +

 "  - " + Date() +" - "+"\n" +EncodeColor(colorRed) +"Op-"+O+"  "+"Hi-"+H+"  "+"Lo-"+L+"  "+

"Cl-"+C+"  "+ "Vol= "+ WriteVal(V, 7)+"\n"+

EncodeColor(colorLime)+

WriteIf (Buy , " GO LONG / Reverse Signal at "+C+"  ","")+

WriteIf (Sell , " EXIT LONG / Reverse Signal at "+C+"  ","")+"\n"+EncodeColor(colorYellow)+

WriteIf(Sell , "Total Profit/Loss for the Last Trade Rs."+(C-BuyPrice)+"","")+

WriteIf(Buy  , "Total Profit/Loss for the Last trade Rs."+(SellPrice-C)+"","");


PlotShapes(IIf(Buy, shapeSquare, shapeNone),colorGreen, 0, L, Offset=-40);

PlotShapes(IIf(Buy, shapeSquare, shapeNone),colorLime, 0,L, Offset=-50);
PlotShapes(IIf(Buy, shapeUpArrow, shapeNone),colorWhite, 0,L, Offset=-45);
PlotShapes(IIf(Short, shapeSquare, shapeNone),colorRed, 0, H, Offset=40);
PlotShapes(IIf(Short, shapeSquare, shapeNone),colorOrange, 0,H, Offset=50);
PlotShapes(IIf(Short, shapeDownArrow, shapeNone),colorWhite, 0,H, Offset=-45);

duration = 10000000;

LastClose= Ref(C,-1);  // if you like to add this popup will show you

if (Buy[BarCount-2]==true)
{
PopupWindowEx( "ID:1", "Get Ready to BUY  \n"+Name() + "  "+ Interval(2)+" :  "+ " Last ="+LastClose  , "Buy Alert -", 1000, 100, 1 ) ;
}
if (short[BarCount-2]==true)
{
PopupWindowEx( "ID:2", "Get Ready to SHORT  \n"+Name() + "  "+ Interval(2) + "  :  "+ " Last ="+LastClose , "Short   Alert ", 1000, 1, 150 ) ;
}


TrendSL=IIf(trend==1,TrendUp,TrendDown);


for(i=BarCount-1;i>1;i--)

{

if(Buy[i] == 1)

{

entry = C[i];

sig = "BUY";

sl = TrendSL[i];

tar1 = entry + (entry * .0050);

tar2 = entry + (entry * .0092);

tar3 = entry + (entry * .0179);


bars = i;

i = 0;

}

if(Sell[i] == 1)

{

sig = "SELL";

entry = C[i];

sl = TrendSL[i];

tar1 = entry - (entry * .0050);

tar2 = entry - (entry * .0112);

tar3 = entry - (entry * .0212);


bars = i;

i = 0;

}

}

Offset = 20;

Clr = IIf(sig == "BUY", colorLime, colorRed);

ssl = IIf(bars == BarCount-1, TrendSL[BarCount-1], Ref(TrendSL, -1));

sl = ssl[BarCount-1];


Plot(LineArray(bars-Offset, tar1, BarCount, tar1,1), "", Clr, styleLine|styleDots, Null, Null, Offset);

Plot(LineArray(bars-Offset, tar2, BarCount, tar2,1), "", Clr, styleLine|styleDots, Null, Null, Offset);

Plot(LineArray(bars-Offset, tar3, BarCount, tar3,1), "", Clr, styleLine|styleDots, Null, Null, Offset);


//Plot(LineArray(bars-Offset, sl, BarCount, sl,1), "", colorDarkRed, styleLine|styleLine, Null, Null, Offset);

//Plot(LineArray(bars-Offset, entry, BarCount, entry,1), "", colorGreen, styleLine|styleLine, Null, Null, Offset);


/*

for (i=bars; i <BarCount;i++)

{

PlotText(""+sig+"@"+entry, BarCount-5,entry,Null,colorBlue);

PlotText("T1@"+tar1,BarCount-5,tar1,Null,Clr);PlotText("T2@"+tar2,BarCount-5,tar2,Null,Clr);PlotText ("T3@"+tar3,BarCount-5,tar3,Null,Clr);


}*/


messageboard = ParamToggle("Message Board","Show|Hide",1);

if (messageboard == 1 )

{

GfxSelectFont( "Tahoma", 13, 100 );

GfxSetBkMode( 1 );

GfxSetTextColor( colorWhite );


if ( sig =="BUY")

{

GfxSelectSolidBrush( colorBlue ); // this is the box background color

}

else

{

GfxSelectSolidBrush( colorRed ); // this is the box background color

}

pxHeight = Status( "pxchartheight" ) ;

xx = Status( "pxchartwidth");

Left = 1100;

width = 310;

x = 5;

x2 = 290;


y = pxHeight;


GfxSelectPen( colorGreen, 1); // broader color

GfxRoundRect( x, y - 98, x2, y , 7, 7 ) ;

GfxTextOut( ( "Marketcalls - Supertrend"),13,y-100);

GfxTextOut( (" "),27,y-100);

GfxTextOut( ("Last " + sig + " Signal came " + (BarCount-bars-1) * Interval()/60 + " mins ago"), 13, y-80) ; // The text format location

GfxTextOut( ("" + WriteIf(sig =="BUY",sig + " @ ",sig + " @") + " : " + entry), 13, y-60);

GfxTextOut( ("Trailing SL : " + Ref(TrendSL,-1) + " (" + WriteVal(IIf(sig == "SELL",entry-sl,sl-entry), 2.2) + ")"), 13, y-40);

/*GfxTextOut( ("TGT:1 : " + tar1), 13, y -80);

GfxTextOut( ("TGT:2 : " + tar2), 13,y-60);

GfxTextOut( ("TGT:3 : " + tar3), 13,y-40);*/

GfxTextOut( ("Current P/L : " + WriteVal(IIf(sig == "BUY",(C-entry),(entry-C)),2.2)), 13, y-22);;


}


// Calculate Equity Curve

eq = Equity( 1, 0 );

//////////////////////////////////////////////////
// Calculate the Last Five Trades Profit/Losses //
//////////////////////////////////////////////////

tradesback = 5;
Signum = Cum( Buy ) + Cum( Short );
Signumstart1 = LastValue( SigNum ) - ( tradesback - 1 );
Signumstart2 = LastValue( SigNum ) - ( tradesback - 2 );
Signumstart3 = LastValue( SigNum ) - ( tradesback - 3 );
Signumstart4 = LastValue( SigNum ) - ( tradesback - 4 );
Signumstart5 = LastValue( SigNum ) - ( tradesback - 5 );

bi = BarIndex();
bistart = ValueWhen( signum == signumstart1, bi );
bicond = bi >= bistart AND bi <= LastValue( bi );


SellPL = IIf( Sell AND bicond, C-buyprice, 0 );
CovPL = IIf( Cover AND bicond, ShortPrice - C,0 );

cumPL = SellPL + CovPL;

//Plot (SellPL,"Sell",colorGreen,styleHistogram,maskhistogram);
///Plot (CovPL,"Cover", colorRed,styleHistogram,maskhistogram);

lsince = lowestSince(Sell OR Cover, cumPL, 0);
hsince = highestSince(Sell OR cover, CumPL, 0);


vs= IIf(lsince==0,hsince,lsince);


PL1 = ValueWhen( signum == signumstart1 , vs,1 );
PL2 = ValueWhen( signum == signumstart2 , vs,1 );
PL3 = ValueWhen( signum == signumstart3 , vs,1 );
PL4 = ValueWhen( signum == signumstart4 , vs,1 );
PL5 = ValueWhen( signum == signumstart5,  vs ,1 );

//////////////////////////////////////////////////
//   Plot the Last Five Trades Profit/Losses    //
//////////////////////////////////////////////////


Title = EncodeColor(colorWhite)+ "Backtest Results  from www.marketcalls.in" + " - " +  Name() + " - " + EncodeColor(colorRed)+ Interval(2) + EncodeColor(colorWhite) +

 "  - " + Date() +" - "+"\n" +EncodeColor(colorRed) +"Op-"+O+"  "+"Hi-"+H+"  "+"Lo-"+L+"  "+

"Cl-"+C+"  "+ "Vol= "+ WriteVal(V, 7)+"\n"+ EncodeColor(colorYellow)+ "\n\n\nLast 5 Trade Results\n" +
"\nTrade1= " + PL1
+"\n"+ "Trade2= " + PL2
+"\n"+ "Trade3= " + PL3
+"\n"+ "Trade4= " + PL4
+"\n"+ "Trade5= " + PL5;


//Magfied Market Price

FS=Param("Font Size",30,11,100,1);

GfxSelectFont("Times New Roman", FS, 700, True );

GfxSetBkMode( colorWhite );

GfxSetTextColor( ParamColor("Color",colorGreen) );

Hor=Param("Horizontal Position",940,1,1200,1);

Ver=Param("Vertical Position",12,1,830,1);

GfxTextOut(""+C, Hor , Ver );

YC=TimeFrameGetPrice("C",inDaily,-1);

DD=Prec(C-YC,2);

xx=Prec((DD/YC)*100,2);

GfxSelectFont("Times New Roman", 11, 700, True );

GfxSetBkMode( colorBlack );

GfxSetTextColor(ParamColor("Color",colorYellow) );

GfxTextOut(""+DD+"  ("+xx+"%)", Hor , Ver+45 );


_SECTION_END();

_SECTION_BEGIN("Time Left");


RequestTimedRefresh( 1 );

TimeFrame = Interval();

SecNumber = GetSecondNum();

Newperiod = SecNumber % TimeFrame == 0;

SecsLeft = SecNumber - int( SecNumber / TimeFrame ) * TimeFrame;

SecsToGo = TimeFrame - SecsLeft;


x=Param("xposn",50,0,1000,1);

y=Param("yposn",380,0,1000,1);


GfxSelectSolidBrush( ColorRGB( 230, 230, 230 ) );

GfxSelectPen( ColorRGB( 230, 230, 230 ), 2 );

if ( NewPeriod )

{

GfxSelectSolidBrush( colorYellow );

GfxSelectPen( colorYellow, 2 );

Say( "New period" );

}

//GfxRoundRect( x+45, y+40, x-3, y-2, 0, 0 );

//GfxSetBkMode(1);

GfxSelectFont( "Arial", 14, 700, False );

GfxSetTextColor( colorRed );

GfxTextOut( "Time Left :"+SecsToGo+"", x, y );

_SECTION_END();
5 comments
Leave Comment
Please login here to leave a comment.
For my information, can you please share what refinements you have made?
not tested but code written r good. let me test and come back to you.
thanks
i get errors when trying to scan and backtest. Not sure
Thanks for AFL
But Getting error as
warning506:You have specified precision that exceeds IEEE standard. Numbers are only accurate upto 7th significant digit.
Please advice.
It is a warning only. It is safe to ignore.